US30 2024/04/1515min Bearish range, still looking to short within range of POI's, fundamentals is key tho. POI's for LONG/SHORT marked out
US WALL ST 30

US30 USD meltdown (Shorts from 38400.0)My bias for US30 has turned bearish due to the recent Wyckoff distribution that unfolded on the higher time frame, validated by a change of character and a break of structure. This confirmation prompts me to seek selling opportunities to support the downward trend.
I will be targeting sells around the 20-hour supply zone, which recently triggered a Break of Structure (BOS) to the downside. Once we experience a pullback, I will seek a redistribution pattern on lower time frames to initiate sells in line with the prevailing trend.
Confluences for US30 sells are as follows:
- Price played a Wyckoff distribution on the higher time frame and had a CHOCH.
- Continuous breaks of structure have occurred to the downside with strong momentum
- Few clean supply zones have been left including the recent 20hr supply.
- ATH's has been taken, and enough liq has been grabbed to start pushing price down.
- still lots of liquidity and imbalances below that needs to be mitigated.
P.S. Alternatively, I will wait for the daily demand. If price continues to decline, I can capitalize on a retracement back up to the supply zone, making buys a potential option this week. Wishing you all a successful trading week!


US30 2024/04/1115min bearish range, waiting op premium for possible shorts
also looking to go for buys possibly from A-low during London Sesh

US30 2024/04/10Still within 15 min Bearish range
POI's Marked out for CPI, wil be looking for MSS on said POI's, also trendline liq forming above price anticipating it to be run at some point

US30 trade idea 2024/04/0815min bearish range
looking for possible sell from supply
also looking to to see if 15min high holds as we are in discount of the daily range could possible see price go higher

US30 Dow Jones Technical Analysis and Trade IdeaIn this video, we delve into a prospective trading opportunity within the US30 Dow Jones index. Our analysis entails evaluating the prevailing trend, scrutinizing price movements, assessing market dynamics, and identifying a potential entry point under favorable conditions, as elaborated in the video. Incorporating robust risk management principles into your trading strategy is crucial. It's imperative to emphasize that this content is presented solely for educational purposes and should not be construed as financial advice.

US30: Dow Jones Retreats After Double Top FormationThe Dow Jones Industrial Average has shifted into negative territory, experiencing a notable downturn following a double top formation around the $40,000 mark on April 1st. As of the time of writing, the price has descended to $39,179, exhibiting a reaction near the neckline of the price pattern. This development prompts a strategic approach based on Fibonacci levels, indicating potential pullback zones where sell limits have been set to capitalize on retracement opportunities.
The recent softness in US services activity data has provided a degree of respite for investors, who have been increasingly apprehensive about the implications of robust US macroeconomic indicators on Federal Reserve monetary policy. Specifically, the US ISM Services Purchasing Managers' Index (PMI) dipped to 51.4 in March from 52.6 in February, contrary to market expectations of a marginal uptick to 52.7. Furthermore, the Prices Paid sub-index receded to 53.4 from 58.6, marking its lowest reading in years and indicating a disinflationary trend in the economy. These figures have somewhat counterbalanced the impact of strong ADP employment data and hawkish remarks from Federal Reserve Chair Powell and Atlanta Fed President Bostic.
In light of these developments, our strategy revolves around anticipating a pullback from the previous zone area, followed by a renewed downward movement. This tactical approach aims to capitalize on market dynamics and potential retracement opportunities, aligning with broader market sentiments and macroeconomic indicators.
As market conditions evolve, continued monitoring and adjustment of strategies will be essential to adapt to changing dynamics and capitalize on emerging opportunities in the Dow Jones Industrial Average.

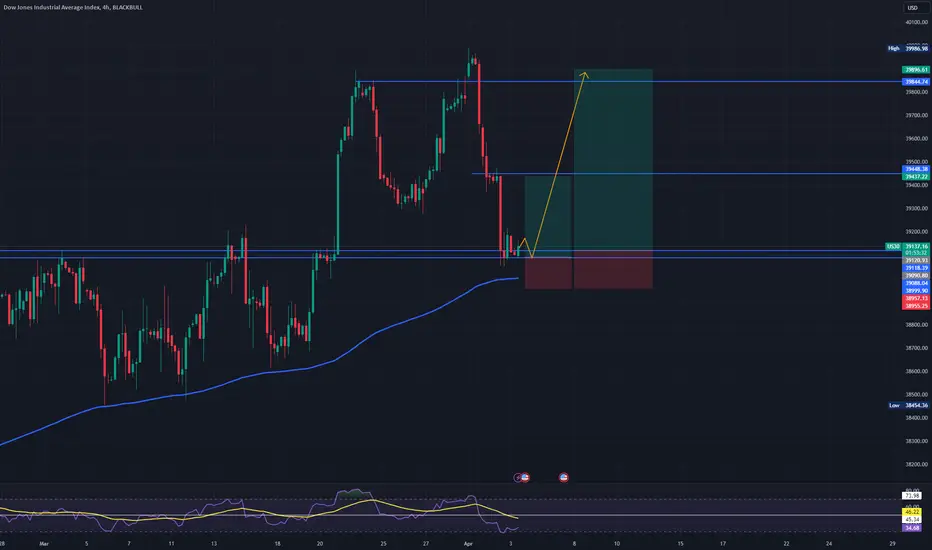
US30 | Ready to retest the price ceiling?The important support area for the US30 index is around the price of 39000. Considering the RSI is in the oversold range, an upward movement with targets at 39448 and 39844 can be expected. 📈
US30 Technical Analysis: Counter-Trend Short OpportunityThe US30's bullish momentum has encountered a key resistance level. This presents a potential counter-trend shorting opportunity. Here's the trade idea:
Entry: Sell short at the current resistance level.
Stop-Loss: Place a stop-loss order above the recent high.
Target: Aim for the previous support/imbalance zone established at a prior low.
Rationale: The US30's extended rally into resistance increases the likelihood of a pullback. This setup offers a favorable risk-reward ratio for a short-term counter-trend trade.
Important Note: Market conditions can change rapidly. Manage risk diligently and adapt your strategy as needed.

US30 Bulls still holding strong (buys potentially from 39400.0)US30 remains in a strong bullish stance, and I'm still on the lookout for long opportunities. Last week, we witnessed a retracement in price to fill the previous imbalance, although some imbalances remain. This was adequate for initiating a new rally, as we're currently observing.
Now, I anticipate two possibilities: either price will break past the newly formed high, or it will retrace to address a significant demand level. In the event of a retracement to the demand level, I'll wait for lower timeframe confirmation before preparing long setups, targeting either new highs or significant liquidity points.
Confluences for US30 Buys are as follows:
- Price broke structure to the upside once again.
- Lower and higher time frame remains extremely bullish.
- Clean nearby demand zone on the 18hr or 21hr.
- New high is close by which is a strong level of liquidity tat is lying there.
- After this imminent retracement we can expect a new rally.
P.S. I strongly favor the bullish trend due to several recent breaks of new highs. Additionally, there are several demand zones that have yet to be mitigated. However, given the impulsive nature of price movements, I wouldn't be surprised if we witness further upward momentum, potentially breaking the high once again.
Have a great trading week guys!

DOW JONES - BULLISH MOVE 🚀Hello Traders !
On Wednesday 20 March The US30 Broke The Resistance Level (39284.87 - 39080.39).
The Price Retreated To The Support Level and Failed To Break it !
The Lower High is Broken (ChoCh).
So, I Expect a Bullish Move 📈
TARGET: 39790.00🎯


US30 remains bullish ( 39200.0 or 38800.0 longs?)This week, I'm bullish on US30. I'm waiting for a pullback followed by a re-accumulation within the demand zone. Once I receive confirmation on the lower time frame, specifically in the 21-hour or 18-hour demand zone, I'll consider taking long positions along the trend.
With the recent breach of all-time highs and significant bearish momentum, there's a possibility of price dipping further to capture liquidity and address imbalances before initiating a new upward rally.
Confluences for US30 Buys are as follows:
- Price broke structure to the upside once again.
- Lower and higher time frame remains extremely bullish.
- Two clean demand zones that have caused BOS to the upside.
- Imbalances left above that need to get filled before price comes in to zone
- After this imminent retracement we can expect a new rally.
P.S. If the price declines and breaches my Points of Interest (POIs), I won't be surprised. Since price has absorbed all liquidity to the upside, a decrease in bullish pressure is possible. With major news behind us, the trading week ahead appears promising!
Have a great trading week guys and lets catch those pips!

US30 START OF A BEARISH MELTDOWN?Short positions on US30 appear compelling this week. We've observed significant bearish momentum lately, leading to a shift in character towards the downside, hinting at a potential trend reversal. Despite not having breached major structural levels yet, two robust supply zones remain, from which we can expect a bearish response.
The slowdown in price movement suggests distribution on higher time frames and hints at an impending reversal. Moreover, there's considerable liquidity to the downside, attracting price action, potentially resulting in a sweep of those equal lows.
Confluences for US30 Sells are as follows:
- Price has changed character on the 4-hourly time frame to the downside.
- Lots if liquidity to the downside in the form of equal lows.
- Two good supply zones in which we can expect a major bearish reaction to take place.
- Price has been heavily bullish and its due for a retracement.
- On the higher time frame price has slowed down momentum, good sign for a reversal.
P.S. However, on the higher time frames, the price remains notably bullish, with equal highs recently established at the latest swing high. These highs represent significant liquidity points, and it wouldn't be surprising if the price retraces to take them out.
FOMC news this Wednesday, trade safe and have a great week!

US30 Pair : US30 Dow Jones
Description :
Completed " 12345 " Impulsive Waves
RSI - Divergence
Break of Structure
Bullish Channel as an Corrective Pattern in Short Time Frame
Impulse Correction

SPY WEEKLY 11 MARCH 2024Welcome to Spy weekly. I have clearly explained the levels where you can go long. If you have any doubts do let me know in the comments below.
NOTE: DO NOT SHORT THE MARKET

Bitcoin - BTCUSD 1hr Just so we are clear... I do not trade crypto... but I can not help myself when I see a perfect setup. It's simple trading once again. we are in a bullish market so we are looking for buy opportunities.
*NFP week! We all saw it, Negative USD News!
BULLISH CONFIRMATIONS:
1. massive head and shoulders
2. Hammer above bearish trend high
3. Hammer above Daily Resistance
4. Higher highs above the previous shoulder
*Do not overthink it. We are in a bullish market with clean higher highs.
*Pay attention to Daily and Weekly Close

US30 finally breaking down? (sells from 39000.0)My bias for US30 this week is bullish, anticipating a further upward movement before encountering a 2-hour supply zone around 39000.0. Afterward, I expect a slowdown and distribution within this area before a potential downward move.
Upon receiving confirmation on lower time frames, selling could target the new trendline liquidity above the 23-hour demand zone. If this scenario doesn't unfold initially, I'll wait for a break in structure to the downside to buy back up, as the overall trend remains bullish.
My confluences for US30 Sells are as follows:
- Price changed character to the downside on the higher time frame
- Lots of liquidity to the downside i.e. trend line liquidity and equal lows.
- We've experienced lots of bullish pressure and now bulls are getting exhausted.
- Nice supply zone left on the 2 hourly that caused the move to the downside.
- In order for price to keep going up it must retrace for healthy price action to continue.
P.S. Given the shift in price action to the downside on higher time frames, it appears that a bearish trend is beginning as bullish momentum wanes. Nonetheless, it's crucial to stay flexible and responsive to price movements, adapting to whichever direction it ultimately takes.


Us30usd sell confirm Crude oil is one of the most in-demand commodities, with the two most popularly traded grades of oil being Brent Crude and West Texas Intermediate (WTI). Crude oil prices reflect the market’s volatile and liquid nature, as well as oil being a benchmark for global economic activity. The oil price charts offer live data and comprehensive price action on WTI Crude and Brent Crude patterns. Get information on key pivot points, support and resistance and crude oil news today. Confirm signal

DOW JONES - DOUBLE TOP 📉Hi Traders !
Yesterday, The Dow Jones Price Formed a Double TOP Pattern.
Currently, The Neckline is Broken !
So, I Expect a Bearish Move📉
-------------
TARGET: 38355.00🎯

US30 - DOW JONES INDUSTRIALS AVERAGE US30 has been in a major bearish divergence from Jan 2018, I think march 2024 will be a month of correction (10%-15%) and then a pickup from April 2024 all the way to September/October when I think the market will hit the top for the US30 that will be around $44,200.
- Monthly MACD (Bearish)
- Monthly Pekipek's Divergence BETA (Bearish)
- Monthly RSI (Bullish)
- Monthly Stochastic RSI (Bearish)
