S&P500 This is why every CORRECTION is a GIFT.The S&P500 index (SPX) has been steadily rising since the April bottom to new All Time Highs (ATH). On the grand 100 year scale, the February - March tariff fueled correction, has been nothing significant. The last true technical correction has been the 2022 Inflation Crisis because it touched, and instantly rebounded on, the 1M MA50 (blue trend-line).
This is not the first time we bring forward our multi-decade perspective on stock and in particular this chart. But it serves well, keeping us into the meaningful long-term outlook of the market. This suggests that since the Great Depression and the first signs of recovery after the 1935 - 1941 Bear Cycle, the market has entered a multi-decade Channel Up, which is divided into long-term aggressive expansion periods (Bull Cycles) and shorter term depressions (Bear Cycles).
During a Bull Cycle, every test of the 1M MA50 is a instant cyclical buy opportunity and in fact that isn't presented very often. During a Bear Cycle, the market makes an initial aggressive correction below the 1M MA50, turns increasingly volatile for 5-7 years, trading sideways within the Channel Up with its second peak resulting into a 2nd correction that eventually breaks below the 1M MA200 (orange trend-line).
That is what we call a 'generational buy opportunity' as in the past 80 years, it has only been taken place 2 times.
Right now (again this is not something we mention for the first time), the market is at the start of the A.I. Bubble, with incredibly strong similarities with the Internet Bubble of the 1990s.
In fact, relative to the Internet Bubble, it appears that we are on a stage similar to 1993 - 1994, before the market turned parabolic to the eventual Dotcom Bust of 2000.
As a result, from a technical perspective, every 'small' correction such as the one we had this year, is a blessing in disguise (buy opportunity). As the index grew by 5 times during the Internet Bubble (300 to 1500), it is also very possible to see it approach this feat going from roughly 3500 (late 2022) to 14000 (by late 2032) and touch the top of the multi-decade Channel Up.
Are you willing to miss out on this generational wealth creation opportunity?
-------------------------------------------------------------------------------
** Please LIKE 👍, FOLLOW ✅, SHARE 🙌 and COMMENT ✍ if you enjoy this idea! Also share your ideas and charts in the comments section below! This is best way to keep it relevant, support us, keep the content here free and allow the idea to reach as many people as possible. **
-------------------------------------------------------------------------------
💸💸💸💸💸💸
👇 👇 👇 👇 👇 👇
Us500

S&P500 push to new ATH? Key Developments:
AI Drives Earnings Momentum
Alphabet reported strong results, but flagged surging AI infrastructure costs, signaling increased capex ahead.
SK Hynix posted record earnings and committed to expanding AI-related investments, reinforcing the sector’s critical growth role.
Investor sentiment remains AI-positive, with capital rotation favoring tech and semiconductors despite margin compression risks.
Banking Sector Boosted by Tariff-Driven Volatility
Deutsche Bank’s FIC (Fixed Income & Currencies) trading revenue jumped 11% to €2.28B, its best Q2 since 2007, aided by global trade uncertainty.
BNP Paribas also beat earnings estimates, continuing the strong showing from European banks amid market volatility.
Trade & Tariff Watch
The EU and US are nearing a deal on a 15% standard tariff rate, potentially stabilizing trade flows and market pricing.
Trump’s broader reciprocal tariff push remains in focus, especially after the US-Japan deal. Investors are watching for signs of escalation or resolution with other partners like the EU and Canada.
Fed in the Political Spotlight
Trump visited the Fed’s construction site, criticizing costs and maintaining pressure on Chair Jerome Powell.
Speculation about Fed leadership changes and political interference is unsettling, though markets have largely shrugged this off for now.
Meanwhile, House Republicans are drafting a follow-up tax-and-spending plan, which could shape future fiscal policy and market expectations.
Conclusion: S&P 500 Trading Outlook
The S&P 500 remains buoyed by strong earnings, particularly from AI-linked sectors and financials, while geopolitical risks and tariff volatility are being absorbed as catalysts for trading profits rather than panic.
Bullish factors: Strong corporate earnings (Alphabet, SK Hynix, Deutsche Bank), potential trade de-escalation (EU-US tariff deal), and AI momentum.
Risks to monitor: Rising AI capex (impact on margins), political tension around the Fed, and tariff uncertainty.
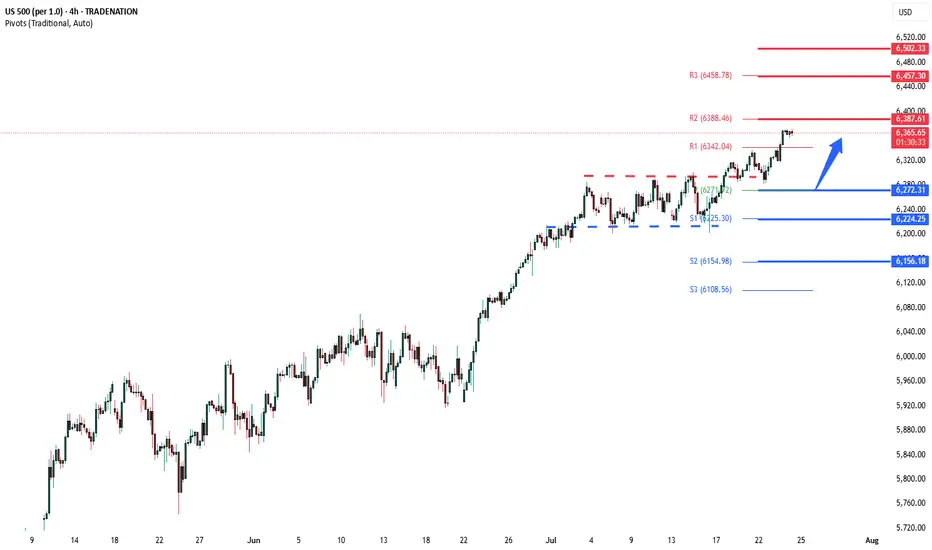
Key Support and Resistance Levels
Resistance Level 1: 6387
Resistance Level 2: 6457
Resistance Level 3: 6502
Support Level 1: 6272
Support Level 2: 6224
Support Level 3: 6156
This communication is for informational purposes only and should not be viewed as any form of recommendation as to a particular course of action or as investment advice. It is not intended as an offer or solicitation for the purchase or sale of any financial instrument or as an official confirmation of any transaction. Opinions, estimates and assumptions expressed herein are made as of the date of this communication and are subject to change without notice. This communication has been prepared based upon information, including market prices, data and other information, believed to be reliable; however, Trade Nation does not warrant its completeness or accuracy. All market prices and market data contained in or attached to this communication are indicative and subject to change without notice.
S&P500 INDEX (US500): Bullish Trend Continues
US500 updated a higher high this week, breaking a resistance
of a bullish flag pattern on a daily time frame.
I think that the market will rise even more.
Next goal for the bulls - 6359
❤️Please, support my work with like, thank you!❤️
I am part of Trade Nation's Influencer program and receive a monthly fee for using their TradingView charts in my analysis.

S&P500 Critical short-term crossroads.The S&P500 index (SPX) has been trading within a Channel Up since for the entirety of July and right now is ahead of important crossroads. It either breaks out above the pattern or pulls back to price a new Higher Low.
Based on the 4H CCI and the similarities with the June 24 - 25 consolidation, there are higher probabilities to break upwards. That fractal reached the 2.0 Fibonacci extension after it broke out. We will wait for confirmation and if it's delivered, we will buy the break-out and target 6460 (just below Fib 2.0 ext).
Until then, being so close to the Channel Up top, makes a solid short opportunity targeting a Higher Low (bottom). The previous one was priced exactly on the 4H MA100 (green trend-line) so that's our target or 6250 if it comes earlier.
-------------------------------------------------------------------------------
** Please LIKE 👍, FOLLOW ✅, SHARE 🙌 and COMMENT ✍ if you enjoy this idea! Also share your ideas and charts in the comments section below! This is best way to keep it relevant, support us, keep the content here free and allow the idea to reach as many people as possible. **
-------------------------------------------------------------------------------
Disclosure: I am part of Trade Nation's Influencer program and receive a monthly fee for using their TradingView charts in my analysis.
💸💸💸💸💸💸
👇 👇 👇 👇 👇 👇

S&P500 sideways consolidation breakoutKey Developments:
Fed Politics: Treasury Secretary Scott Bessent called for a review of the Fed’s $2.5B HQ renovation, continuing political pressure on Jerome Powell. This adds to the uncertainty around Fed independence and rate path.
Meme Stock Surge:
Opendoor soared 121% amid a retail-driven frenzy.
Major institutional investors are also chasing the rally, pushing broader equities to record highs.
However, upcoming Alphabet and Tesla earnings could be a turning point for momentum.
Corporate News:
Hewlett Packard Enterprise suffered a $985M loss in the Autonomy case—corporate governance and M&A risks in spotlight.
Sarepta paused drug shipments amid backlash—biotech volatility rising.
LA Times plans IPO—media valuations may resurface.
Crypto Moves:
Trump Media bought $2B in Bitcoin and related assets, aiming to become a crypto treasury.
JPMorgan may lend against crypto, signaling broader institutional adoption.
Tech & AI:
MIT’s Andrew Lo predicts AI will make real investment decisions in 5 years.
OpenAI–Oracle to expand US data center capacity by 4.5 GW—significant tech infrastructure tailwind.
Conclusion for S&P 500 Trading:
The S&P 500 remains supported by strong risk appetite, AI optimism, and crypto momentum, but faces near-term tests from key tech earnings (Alphabet, Tesla). Political noise around the Fed and signs of speculative froth (meme stocks) could introduce volatility. Stay bullish with caution—watch earnings and Fed commentary closely for market direction.
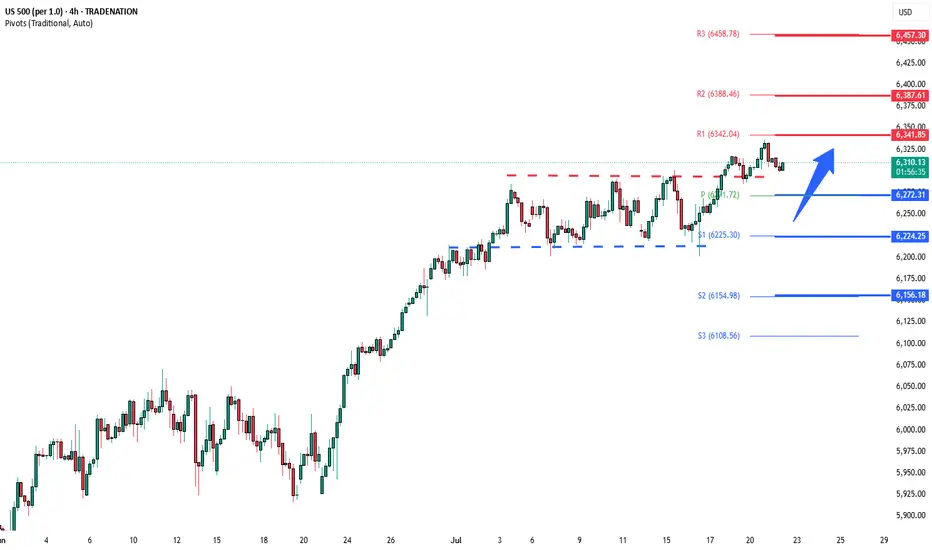
Key Support and Resistance Levels
Resistance Level 1: 6340
Resistance Level 2: 6390
Resistance Level 3: 6457
Support Level 1: 6270
Support Level 2: 6224
Support Level 3: 6156
This communication is for informational purposes only and should not be viewed as any form of recommendation as to a particular course of action or as investment advice. It is not intended as an offer or solicitation for the purchase or sale of any financial instrument or as an official confirmation of any transaction. Opinions, estimates and assumptions expressed herein are made as of the date of this communication and are subject to change without notice. This communication has been prepared based upon information, including market prices, data and other information, believed to be reliable; however, Trade Nation does not warrant its completeness or accuracy. All market prices and market data contained in or attached to this communication are indicative and subject to change without notice.
US stocks hold near record highs on strong 2Q earnings
Despite elevated valuation pressures, US equities remain near all-time highs. While tariff concerns persist, resilient US economic data continues to support the market's upward momentum.
United Airlines reported a 1.7% YoY increase in 2Q revenue, citing easing geopolitical and macroeconomic uncertainties and a double-digit rebound in corporate demand. Meanwhile, earnings and share performance among mega-cap stocks have also been strong.
Netflix (NFLX) beat market expectations with 2Q revenue of $11.08 billion and EPS of $7.19. At the same time, Nvidia (NVDA) reached a fresh all-time high on renewed optimism over a potential resumption of exports to China.
After testing the support at 6285, US500 rebounded and approached its previous high again. The index holds above EMA21, suggesting the continuation of bullish momentum. If US500 remains above both EMA21 and the support at 6285, the index could breach the 6320 high. Conversely, if the US500 breaks below the support at 6285, the index could retreat further toward 6200.

ES Weekly Outlook & Game Plan 20/07/2025ES Weekly Outlook & Game Plan
🧠 Fundamentals & Sentiment
Market Context:
ES continues its bullish momentum, driven by institutional demand and a supportive U.S. policy environment.
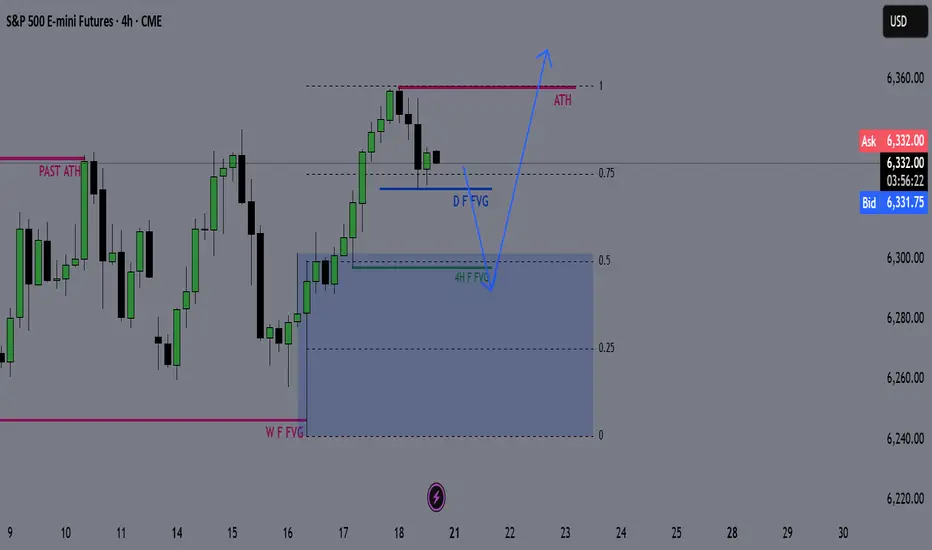
📊 Technical Analysis:
Price is currently in price discovery, and the weekly structure remains strongly bullish — so I prefer to follow the strength.
We might see a minor retracement before pushing further above the all-time high (ATH).
🎯 Game Plan:
I'm expecting a potential retracement to the 0.5 Fibonacci level, which is the discount zone in a bullish environment.
Interestingly, the 4H liquidity zone aligns perfectly with the 0.5 Fib level — this confluence suggests price may gather enough energy from there to make new highs.
✅ Follow for weekly recaps & actionable game plans.
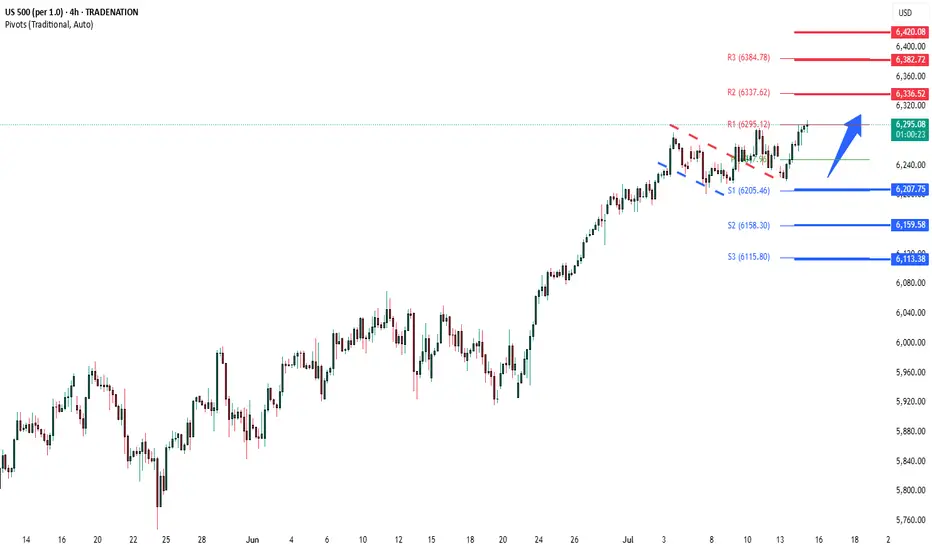
S&P overbought sideways consolidation supported at 6207 Fed Signals Rate Cut Ahead
US Federal Reserve Governor Christopher Waller called for a quarter-point interest rate cut this month, citing cooling inflation and minimal upside price risks. His dovish stance diverges from the broader FOMC consensus, which still views the labor market as resilient.
UK-Germany Defense Pact
UK PM Keir Starmer signaled potential alignment with Germany to purchase US weapons for Ukraine, following the signing of the “Kensington Treaty.” The accord emphasizes mutual defense cooperation, raising expectations of deeper UK involvement in European security initiatives.
Intel Concerns with Spain
US lawmakers raised concerns over intelligence sharing with Spain, due to the country's reliance on Huawei for its wiretap infrastructure, highlighting geopolitical tech tensions.
Trump Authorizes Epstein Testimony Release
President Donald Trump has authorized the release of grand jury testimony from the Epstein case, yielding to public and political pressure for greater transparency.
S&P 500 Outlook:
Waller’s call for a rate cut adds bullish momentum for equities, especially rate-sensitive sectors like tech and real estate. While geopolitical tensions and defense headlines introduce headline risk, the dovish Fed signal is likely to dominate sentiment in the near term. Expect S&P 500 support near 6207 with upside potential if more Fed officials echo Waller’s stance.
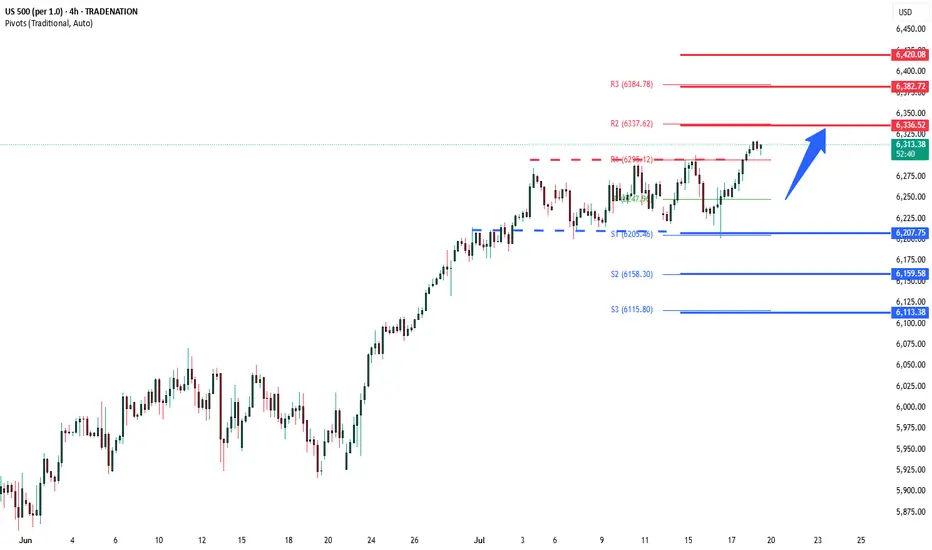
Key Support and Resistance Levels
Resistance Level 1: 6336
Resistance Level 2: 6383
Resistance Level 3: 6420
Support Level 1: 6207
Support Level 2: 6160
Support Level 3: 6113
This communication is for informational purposes only and should not be viewed as any form of recommendation as to a particular course of action or as investment advice. It is not intended as an offer or solicitation for the purchase or sale of any financial instrument or as an official confirmation of any transaction. Opinions, estimates and assumptions expressed herein are made as of the date of this communication and are subject to change without notice. This communication has been prepared based upon information, including market prices, data and other information, believed to be reliable; however, Trade Nation does not warrant its completeness or accuracy. All market prices and market data contained in or attached to this communication are indicative and subject to change without notice.
Rob the Rally SPX500: Enter Before Resistance Catches You🦹♂️💰**“SPX500 Street Heist” – Thief-Style Robbery Plan for Bulls!**📈💸
(Powered by Thief Trader's Market Robbing Tactics – Scalp | Swing | Day Trade Edition)
🌍Hello, Global Money Hunters!
📣 Salaam, Bonjour, Ola, Hola, Hallo, Marhaba & Welcome to the heist floor! 🎩💼
Thief Trader is back again with a loaded plan to rob the market clean — this time targeting the mighty SPX500 / US500 🎯. Based on a fusion of technical setups, macro sentiment, and the Thief Trading System, we’ve set our sights on the next breakout vault of Wall Street.
🎯 The Gameplan – Heist the Resistance Vault
The index is entering a high-risk resistance barricade — overbought, consolidated, and heavily guarded by bearish robbers (sellers). This is the zone where the market police lurk and trend reversals often get triggered. However, smart thieves always plan with precision.
Here’s the mission briefing:
🔓Entry Zone (Break-in Point)
💥 “The vault is open — grab the bullish loot!”
Enter Long anywhere close to market price or on pullbacks near recent swing lows/highs.
Preferred timeframes: 15-min to 30-min for sniper-level accuracy.
Deploy DCA-style limit orders (layered entries for maximum control).
🛑Stop Loss (Escape Hatch)
Base SL on recent swing low candle wicks on the 4H timeframe.
Suggested: ~6250.00 — but adapt based on your risk appetite, lot size, and position stacking.
📈Target / Loot Location
🎯 Primary Take-Profit: 6450.00
Or… pull out early if you spot resistance fighters guarding the vault.
Use trailing SL to secure gains and manage getaway.
⚡Scalper’s Notice
Only Long-side allowed!
Got big capital? Jump in now.
Running low? Tag along with swing traders and follow the robbery protocol.
Always protect your bag with dynamic trailing stops.
🧠Fundamental Fuel Behind the Plan
Bullish sentiment across major indices
Macro trends, COT positioning, sentiment outlook, and intermarket analysis all greenlit
Geopolitical and Fed tone supportive — tap into real data before entering
👉 Always analyze: News, Fundamentals, Sentiment, COT reports, and macro conditions.
🚨NEWS ZONE ALERT – No Loud Moves!
Avoid entry during major economic news drops
Use trailing SLs to guard profits
Don’t let your open trades get caught in the chaos of news releases!
💥Let’s Boost the Thief Army!
Smash the BOOST button 💖 to power up the robbery crew.
Support the strategy, share the love, and stay ahead of the game using Thief Trading Style. Every trade is a step closer to freedom from financial traps. 🚀💰🎉
📌Disclaimer: This is a general market analysis for educational purposes and should not be considered personal financial advice. Please evaluate your own risk management strategy before placing trades.
📌Markets shift fast — stay flexible, stay alert, and always rob smart.
🔥Stay locked in for the next heist plan — Thief Trader signing off for now…
💸💼📈 Trade smart. Rob harder. 🤑🦹♂️📊

S&P500 Accumulation almost over. New rally begins.The S&P500 index (SPX) has been trading within a 3-month Channel Up pattern, within which, it's been replicating almost the same structure. This involves an aggressive Bullish Leg Phase (dotted Channel Up), followed by a correction/ Accumulation Phase (blue Channels), which eventually leads to the new Bullish Leg.
The 1D RSI fractals among those patterns are similar and right now it seems that we are about to complete the latest Accumulation Phase. Having completed a 1D Golden Cross 2 weeks ago, the time-frame looks more bullish than ever and as long as the 1D MA50 (blue trend-line) holds, we expect at least a +5.68% rise (the minimum of the previous Bullish Legs), targeting 6550.
-------------------------------------------------------------------------------
** Please LIKE 👍, FOLLOW ✅, SHARE 🙌 and COMMENT ✍ if you enjoy this idea! Also share your ideas and charts in the comments section below! This is best way to keep it relevant, support us, keep the content here free and allow the idea to reach as many people as possible. **
-------------------------------------------------------------------------------
Disclosure: I am part of Trade Nation's Influencer program and receive a monthly fee for using their TradingView charts in my analysis.
💸💸💸💸💸💸
👇 👇 👇 👇 👇 👇

S&P500 Bullish breakout supported at 6207Trump’s $3.4 Trillion Tax Plan
Favors wealthy investors: Tax burden shifts based on how you earn, not how much.
Winners: Business owners, investors, high-income earners.
Losers: Immigrants, elite universities.
Trade Tensions
EU Tariffs: Brussels targets $72B in US goods (e.g., Boeing, cars, bourbon) in response to Trump’s tariff threats.
Impact: Risk to transatlantic trade; US open to talks.
US-China Tech Relations
Nvidia: Resumes H20 AI chip sales to China after US approval—boosted chip stocks.
Trump: To announce $70B in AI & energy investments today in Pennsylvania.
Trend: Signs of easing tensions between US and China.
Earnings Focus: Big US Banks
Q2 results (JPM, Citi, WFC, BNY Mellon, BlackRock) will highlight:
Net interest income: How rate levels affect profits
Loan growth & credit quality: Signs of lending strength or weakness
Capital markets activity: Trading & investment banking trends
Key Support and Resistance Levels
Resistance Level 1: 6335
Resistance Level 2: 6380
Resistance Level 3: 6420
Support Level 1: 6207
Support Level 2: 6160
Support Level 3: 6115
This communication is for informational purposes only and should not be viewed as any form of recommendation as to a particular course of action or as investment advice. It is not intended as an offer or solicitation for the purchase or sale of any financial instrument or as an official confirmation of any transaction. Opinions, estimates and assumptions expressed herein are made as of the date of this communication and are subject to change without notice. This communication has been prepared based upon information, including market prices, data and other information, believed to be reliable; however, Trade Nation does not warrant its completeness or accuracy. All market prices and market data contained in or attached to this communication are indicative and subject to change without notice.
US500 Bulls Assemble | Breakout Heist Strategy📈🚨 MASTER HEIST PLAN: “SPX500 ROBBERY – THIEF TRADING STYLE 🔥💸” 🚨📈
(The Ultimate Long Strategy Blueprint for Smart Day/Swing Traders)
🌍 Greetings to All Market Bandits, Bullish Burglars, and Chart Snipers!
Hola! Bonjour! Ola! Hallo! Marhaba! 🙌
🦹♂️This is your friendly chart thief checking in with the latest SPX500/US500 masterplan!
This isn’t just a trade—it’s a heist 🎯. We’re not here to participate, we’re here to dominate! Welcome to the Thief Trading Style, where we map, trap, and snatch those pips with ruthless precision. 🧠🔍💰
🚀 THIEF TRADE SETUP - SPX500/US500
A mix of technical sniper entries + fundamental black ops analysis = 💸 Maximum Extraction. 💸
🎯 ENTRY PLAN: THE BREAKOUT HEIST
📍Buy Entry Zone: Wait for the clean breakout + candle close above 6270.00.
"The vault opens once we clear that wall. Let the bullish getaway begin!" 💥🚪📈
🛠️Thief Tips for Entry:
Use Buy Stop Orders above resistance levels.
OR layer in Buy Limit Orders near recent pullbacks (15/30m swing zones) using DCA Style (Dollar Cost Average layering like a pro).
Want stealth mode? Set that alert (alarm), and strike when the breakout sings. 🔔🎯
🛑 STOP LOSS – PROTECT THE LOOT
🧨Set your SL smart—beneath the nearest swing low using the 2H timeframe for stronger structure.
💬 “Look, don’t gamble. A thief knows when to run. Set that stop where I showed ya, or risk losin’ the bag.” 💼💣
❗Your SL should reflect your risk per trade, lot size, and number of entries. It’s your getaway plan—don’t mess it up.
💥 TARGETS – WHERE WE CASH OUT
🏴☠️Primary Take Profit (TP1): 6310.00
🏴☠️Secondary Take Profit (TP2): 6370.00
💹 Scalp Traders: Stick to the Long Side Only. Ride the momentum, but use trailing SL to lock it in.
🔍 THIEF FUNDAMENTAL INTEL: WHY THIS IS OUR MOMENT
Current SPX500 bullishness driven by:
✅ Positive macro & geopolitical tailwinds
✅ Institutional positioning (COT reports)
✅ Intermarket analysis showing strong correlations
✅ Momentum building with sentiment and volume
📌 Stay sharp—check all your fundamental reports, news catalysts, and sentiment tools before executing your move. Smart thieves plan every detail. 🎓📊
⚠️ NEWS RELEASE REMINDER
📢 News = Chaos. Don’t get caught in the spray:
🔒Avoid entering trades just before big announcements.
🚀 Use Trailing SL to secure profit if you're already in.
Stay agile. Stay smart. Stay rich. 💼🚁
❤️ SUPPORT THE HEIST – HIT THAT BOOST BUTTON!
👊 Liked the plan? Hit the Boost to join the elite robbery crew.
Every boost fuels the mission. Every like sharpens the strategy. Let's build a team of smart, profitable traders. 🚀💸🔥
🧠 Remember: This is general analysis – not financial advice. Manage your risk like a true thief. Stay updated. Adapt fast. Don't get caught. 🕵️♂️
🎉See you in the next Heist Plan! Keep your tools sharp, your charts cleaner, and your profit bags fatter. 🤑🔥

US500 Is Bullish! Long!
Here is our detailed technical review for US500.
Time Frame: 3h
Current Trend: Bullish
Sentiment: Oversold (based on 7-period RSI)
Forecast: Bullish
The market is trading around a solid horizontal structure 6,252.40.
The above observations make me that the market will inevitably achieve 6,297.19 level.
P.S
Overbought describes a period of time where there has been a significant and consistent upward move in price over a period of time without much pullback.
Disclosure: I am part of Trade Nation's Influencer program and receive a monthly fee for using their TradingView charts in my analysis.
Like and subscribe and comment my ideas if you enjoy them!

Quick take on the S&P500From the very short-term perspective, the SP:SPX is currently stuck in a tight range. Waiting for a little breakout.
Let us know what you think in the comments below.
Thank you.
75.2% of retail investor accounts lose money when trading CFDs with this provider. You should consider whether you understand how CFDs work and whether you can afford to take the high risk of losing your money. Past performance is not necessarily indicative of future results. The value of investments may fall as well as rise and the investor may not get back the amount initially invested. This content is not intended for nor applicable to residents of the UK. Cryptocurrency CFDs and spread bets are restricted in the UK for all retail clients.

S&P500 Bullish continuation developing close to ATHUS Secretary of State Marco Rubio is meeting Russian Foreign Minister Lavrov today at an ASEAN summit, as tensions remain high over the war in Ukraine. President Trump has criticized Putin and pledged more weapons for Ukraine. Meanwhile, Ukrainian allies are meeting in Rome to plan postwar rebuilding.
Trump also announced new tariff plans—50% on Brazil and 20% on the Philippines, though further talks are expected. He said a temporary ceasefire between Israel and Hamas could be close, possibly within weeks.
In business news, X CEO Linda Yaccarino is stepping down, Meta faces a competition warning in France, and Wall Street banks are preparing financing for a $4.25 billion Boots buyout. Nvidia became the first company ever to hit a $4 trillion market value, boosted by strong investor demand.
US Equity Outlook:
Markets may trade mixed. Nvidia’s historic surge could lift tech stocks, but geopolitical tensions and trade uncertainty may limit gains. Investors will watch for more updates on tariffs and global talks.
Key Support and Resistance Levels
Resistance Level 1: 6290
Resistance Level 2: 6340
Resistance Level 3: 6400
Support Level 1: 6180
Support Level 2: 6120
Support Level 3: 6070
This communication is for informational purposes only and should not be viewed as any form of recommendation as to a particular course of action or as investment advice. It is not intended as an offer or solicitation for the purchase or sale of any financial instrument or as an official confirmation of any transaction. Opinions, estimates and assumptions expressed herein are made as of the date of this communication and are subject to change without notice. This communication has been prepared based upon information, including market prices, data and other information, believed to be reliable; however, Trade Nation does not warrant its completeness or accuracy. All market prices and market data contained in or attached to this communication are indicative and subject to change without notice.

Bearish drop?S&P500 is reacting off the resistance level which is a pullback resistance and could drop from this level too ur take profit.
Entry: 6,237.85
Why we like it:
There is a pullback resistance level.
Stop loss: 6,268.46
Why we like it:
There is a pullback resistance level.
Take profit: 6,187.51
Why we like it:
There is a pullback support that is slightly below the 61.8% Fibonacci retracement.
Enjoying your TradingView experience? Review us!
Please be advised that the information presented on TradingView is provided to Vantage (‘Vantage Global Limited’, ‘we’) by a third-party provider (‘Everest Fortune Group’). Please be reminded that you are solely responsible for the trading decisions on your account. There is a very high degree of risk involved in trading. Any information and/or content is intended entirely for research, educational and informational purposes only and does not constitute investment or consultation advice or investment strategy. The information is not tailored to the investment needs of any specific person and therefore does not involve a consideration of any of the investment objectives, financial situation or needs of any viewer that may receive it. Kindly also note that past performance is not a reliable indicator of future results. Actual results may differ materially from those anticipated in forward-looking or past performance statements. We assume no liability as to the accuracy or completeness of any of the information and/or content provided herein and the Company cannot be held responsible for any omission, mistake nor for any loss or damage including without limitation to any loss of profit which may arise from reliance on any information supplied by Everest Fortune Group.

S&P500 Strong Buy Signal flashed for the 3rd time in 2 years!The S&500 index (SPX) is comfortably trading above its previous All Time High (ATH) and shows no signs of stopping here. Coming off a 1D MA50/ 100 Bullish Cross, we expect the 1D MA50 (blue trend-line) to turn now into the first long-term Support going towards the end of the year.
The last 1D MA50/ 100 Bullish Cross (December 15 2023) was nothing but a bullish continuation signal, which extended the uptrend all the way to the 2.0 Fibonacci extension, before a pull-back test of the 1D MA100 (green trend-line) again.
The 1W RSI is now on the same level (63.30) it was then. In fact it is also on the same level it was on June 05 2023, which was another such bullish continuation signal that peaked on the 2.0 Fib ext.
This suggests that we have a rare long-term Buy Signal in our hands, only the 3rd time in 2 years that has emerged. Based on that, we should be expecting to see 7600 as the next Target before it hits the 2.0 Fib ext and pulls back to the 1D MA100 again and there is certainly enough time to do this by the end of the year, assuming the macroeconomic environment favors (trade deals, potential Fed Rate cuts etc).
-------------------------------------------------------------------------------
** Please LIKE 👍, FOLLOW ✅, SHARE 🙌 and COMMENT ✍ if you enjoy this idea! Also share your ideas and charts in the comments section below! This is best way to keep it relevant, support us, keep the content here free and allow the idea to reach as many people as possible. **
-------------------------------------------------------------------------------
Disclosure: I am part of Trade Nation's Influencer program and receive a monthly fee for using their TradingView charts in my analysis.
💸💸💸💸💸💸
👇 👇 👇 👇 👇 👇

S&P Bullish Flag developing supported at 6180Trump Softens Tariff Stance:
Trump said the Aug. 1 tariff deadline isn’t firm, easing fears of an immediate trade war. US equity futures rose on hopes for more negotiation. Japan criticized the planned 25% tariff, calling it “truly regrettable.”
Texas Floods – Trump to Visit:
Over 100 people died in the Texas floods, including 27 children. Trump said he’ll visit the state Friday to support recovery efforts. The news may draw attention to infrastructure and emergency response spending.
Apple Loses AI Chief to Meta:
Apple’s AI lead, Ruoming Pang, is leaving for Meta’s new AI unit. This raises more questions about Apple’s AI strategy, while Meta’s aggressive hiring supports its tech edge.
US Resumes Ukraine Weapons Aid:
Biden will restart weapons shipments to Ukraine, reversing a previous pause. This could support defense stocks, though broader market impact is limited for now.
Takeaway:
Markets welcomed Trump’s trade flexibility, lifting sentiment. Watch tech and industrials as traders react to shifts in AI leadership and trade policy.
Key Support and Resistance Levels
Resistance Level 1: 6290
Resistance Level 2: 6340
Resistance Level 3: 6400
Support Level 1: 6180
Support Level 2: 6120
Support Level 3: 6065
This communication is for informational purposes only and should not be viewed as any form of recommendation as to a particular course of action or as investment advice. It is not intended as an offer or solicitation for the purchase or sale of any financial instrument or as an official confirmation of any transaction. Opinions, estimates and assumptions expressed herein are made as of the date of this communication and are subject to change without notice. This communication has been prepared based upon information, including market prices, data and other information, believed to be reliable; however, Trade Nation does not warrant its completeness or accuracy. All market prices and market data contained in or attached to this communication are indicative and subject to change without notice.

Bullish continuation?S&P500 (US500) is falling towards the pivot which acts as a pullback support and could bounce to the 1st resistance, which aligns with the 161.8% Fibonacci extension.
Pivot: 6,127.80
1st Support: 5,785.00
1st Resistance: 6,428.64
Risk Warning:
Trading Forex and CFDs carries a high level of risk to your capital and you should only trade with money you can afford to lose. Trading Forex and CFDs may not be suitable for all investors, so please ensure that you fully understand the risks involved and seek independent advice if necessary.
Disclaimer:
The above opinions given constitute general market commentary, and do not constitute the opinion or advice of IC Markets or any form of personal or investment advice.
Any opinions, news, research, analyses, prices, other information, or links to third-party sites contained on this website are provided on an "as-is" basis, are intended only to be informative, is not an advice nor a recommendation, nor research, or a record of our trading prices, or an offer of, or solicitation for a transaction in any financial instrument and thus should not be treated as such. The information provided does not involve any specific investment objectives, financial situation and needs of any specific person who may receive it. Please be aware, that past performance is not a reliable indicator of future performance and/or results. Past Performance or Forward-looking scenarios based upon the reasonable beliefs of the third-party provider are not a guarantee of future performance. Actual results may differ materially from those anticipated in forward-looking or past performance statements. IC Markets makes no representation or warranty and assumes no liability as to the accuracy or completeness of the information provided, nor any loss arising from any investment based on a recommendation, forecast or any information supplied by any third-party.

S&P500: Once it breaks the 1W MA50, it doesn't look back.S&P500 has turned overbought on its 1D technical outlook (RSI = 75.570, MACD = 96.940, ADX = 23.950) and rightly so as it is extending the rally after crossing above the 1W MA50. The Channel Up since late 2011 shows that when the index crosses above its 1W MA50, it tends to spend a notable time over it (and every contact is a buy opportunity), with the most recent example being the March 2023 - December 2024 period. The shortest such period has been in 2019, which was suddently disrupted by the black Swan event of COVID. We may have gotten out of a similar situation as Trump's tariffs disrupted the uptrend earlier this year with a huge, unexpected correction. There 1W MA200 supported and this brings us to a new 'above the 1W MA50 bullish phase', which even if it is as short as 2019, it can still target 7,000.
See how our prior idea has worked out:
## If you like our free content follow our profile to get more daily ideas. ##
## Comments and likes are greatly appreciated. ##

S&P500 bullish ahead of US employment- NFP numbersHouse Republicans moved Trump’s major tax and spending bill closer to a final vote, which could happen before his July 4 deadline. The package includes tax cuts, immigration funding, and the rollback of green energy incentives. Gamblers are raising concerns about a tax increase in the bill that could affect them.
In trade news, the US eased export rules on chip design software to China as part of an ongoing deal. China’s tone has shifted more positively, with a top official saying he’s hopeful about US-China relations and that conflict between the two is “unimaginable.”
At the Fed, Chair Jerome Powell hasn’t said if he’ll step down when his term ends in May, adding uncertainty. Trump, who wants a loyal replacement, has called for his resignation after a federal agency accused Powell of giving misleading testimony about expensive Fed building renovations.
On Wall Street, value investing made a comeback last quarter. Over 60% of active value fund managers beat their benchmarks by buying cheap industrial stocks and avoiding underperforming sectors like utilities and consumer staples.
Conclusion:
US equities are steady but cautious. Uncertainty around Fed leadership and Trump’s economic plans is keeping markets in check, while improving US-China trade relations and a shift toward value stocks are offering support.
Key Support and Resistance Levels
Resistance Level 1: 6260
Resistance Level 2: 6307
Resistance Level 3: 6355
Support Level 1: 6130
Support Level 2: 6090
Support Level 3: 6055
This communication is for informational purposes only and should not be viewed as any form of recommendation as to a particular course of action or as investment advice. It is not intended as an offer or solicitation for the purchase or sale of any financial instrument or as an official confirmation of any transaction. Opinions, estimates and assumptions expressed herein are made as of the date of this communication and are subject to change without notice. This communication has been prepared based upon information, including market prices, data and other information, believed to be reliable; however, Trade Nation does not warrant its completeness or accuracy. All market prices and market data contained in or attached to this communication are indicative and subject to change without notice.

Bitcoin & Ethereum New Quarter | What To Look For🎯 New Quarter For COINBASE:BTCUSD & COINBASE:ETHUSD — What To Look For
As we enter a new quarter, smart money is already positioning.
Institutional investors, hedge funds, and asset managers don’t just trade price — they rotate capital based on quarterly performance, risk appetite, and macro expectations. That’s why each quarterly open is a key inflection point across all markets — including crypto.
In this video, I break down:
• 🧠 How institutional capital rotation impacts Bitcoin and Ethereum
• 📈 Key levels to watch as Q3 unfolds
• 🔁 What are the likely outcomes
• 📊 How to prepare for volatility and new trend formation
This isn’t just another candle — it’s the start of a new chapter in the cycle.
If you’re serious about understanding where the money flows next , this video is for you.
This is the likely outcome
Price not ready to moon yet
Strong candle implying new highs incoming
Watch for bearish stop hunt on new quarter
This is a bullish outside bar
MartyBoots here , I have been trading for 17 years and sharing my thoughts
👍 Enjoyed the insights?
Let me know your thoughts in the comments below — and don’t forget to like this post to support the channel!

S&P500 Bullish Leg not over yet.The S&P500 index (SPX) has been trading within a Channel Up since the May 07 Low and is currently unfolding the latest Bullish Leg.
As you can see, it is far from having topped, not just by a plain trend-line (Higher Highs) perspective but also based on the Fibonacci and % rise terms relative to the previous Bullish Leg.
That peaked after a +7.10% rise, a little above the 3.0 Fibonacci extension. As a result, a 6330 Target on the short-term is more than fitting.
-------------------------------------------------------------------------------
** Please LIKE 👍, FOLLOW ✅, SHARE 🙌 and COMMENT ✍ if you enjoy this idea! Also share your ideas and charts in the comments section below! This is best way to keep it relevant, support us, keep the content here free and allow the idea to reach as many people as possible. **
-------------------------------------------------------------------------------
Disclosure: I am part of Trade Nation's Influencer program and receive a monthly fee for using their TradingView charts in my analysis.
💸💸💸💸💸💸
👇 👇 👇 👇 👇 👇
