S&P500 INTRADAY support retest The Israel-Iran conflict has now entered its fourth day, with no signs of de-escalation. Iran launched more missile attacks, while Israel struck back, targeting a major gas field and a key military figure. Notably, Israeli strikes damaged Iran’s uranium facility in Isfahan, and an Iranian missile caused minor damage near the U.S. consulate in Tel Aviv.
While these developments added geopolitical stress, markets showed some resilience:
Oil prices pulled back after initial gains but remain volatile as the risk of supply disruption in the Middle East — a region supplying ~1/3 of global crude — persists.
S&P 500 futures edged higher, indicating investors are not fully in risk-off mode, but remain cautious.
On the political front, Donald Trump reportedly blocked an Israeli plan to assassinate Iran’s Supreme Leader. He mentioned the possibility of a future agreement between the two sides but said more conflict may come first. Trump is attending the G7 summit in Canada today, where leaders will discuss how to manage the Middle East crisis and navigate diplomacy with Trump.
For S&P 500 traders:
Monitor oil prices — a sharp spike on new escalation could weigh on risk sentiment.
Headlines from the G7 and any sign of U.S. involvement or de-escalation efforts could shift markets.
Geopolitical risk remains elevated, but the market is currently pricing in a contained conflict.
Key Support and Resistance Levels
Resistance Level 1: 6,058
Resistance Level 2: 6,138
Resistance Level 3: 6,200
Support Level 1: 5,953
Support Level 2: 5,913
Support Level 3: 5,845
This communication is for informational purposes only and should not be viewed as any form of recommendation as to a particular course of action or as investment advice. It is not intended as an offer or solicitation for the purchase or sale of any financial instrument or as an official confirmation of any transaction. Opinions, estimates and assumptions expressed herein are made as of the date of this communication and are subject to change without notice. This communication has been prepared based upon information, including market prices, data and other information, believed to be reliable; however, Trade Nation does not warrant its completeness or accuracy. All market prices and market data contained in or attached to this communication are indicative and subject to change without notice.
Us500

US500 Will Fall! Short!
Here is our detailed technical review for US500.
Time Frame: 10h
Current Trend: Bearish
Sentiment: Overbought (based on 7-period RSI)
Forecast: Bearish
The market is approaching a significant resistance area 5,979.56.
Due to the fact that we see a positive bearish reaction from the underlined area, I strongly believe that sellers will manage to push the price all the way down to 5,838.14 level.
P.S
Overbought describes a period of time where there has been a significant and consistent upward move in price over a period of time without much pullback.
Disclosure: I am part of Trade Nation's Influencer program and receive a monthly fee for using their TradingView charts in my analysis.
Like and subscribe and comment my ideas if you enjoy them!

S&P500 INTRADAY consolidation range Boeing Crash: An Air India Boeing 787 crashed after takeoff from Ahmedabad to London, killing all 242 on board. It’s the worst accident involving this model. Boeing shares dropped on renewed safety concerns.
Trump Tariffs: Donald Trump plans to set new tariff rates within 1–2 weeks before a July 9 deadline. The EU may be last to get a trade deal. Japan is cautious about any agreement.
US-UK Trade Deal: The US and UK plan to move quickly on a trade deal. The EU is expected to face delays.
Tariff Pause: The US may extend a 90-day pause on tariffs for countries negotiating seriously.
Middle East Tensions: The US is pulling embassy staff as tensions rise. Iran warned of retaliation if nuclear talks fail. Reports say the US is preparing for a possible Israeli strike on Iran. Oil prices eased.
Key Support and Resistance Levels
Resistance Level 1: 6060
Resistance Level 2: 6120
Resistance Level 3: 6172
Support Level 1: 5960
Support Level 2: 5900
Support Level 3: 5800
This communication is for informational purposes only and should not be viewed as any form of recommendation as to a particular course of action or as investment advice. It is not intended as an offer or solicitation for the purchase or sale of any financial instrument or as an official confirmation of any transaction. Opinions, estimates and assumptions expressed herein are made as of the date of this communication and are subject to change without notice. This communication has been prepared based upon information, including market prices, data and other information, believed to be reliable; however, Trade Nation does not warrant its completeness or accuracy. All market prices and market data contained in or attached to this communication are indicative and subject to change without notice.

S&P500 is Nearing an Important Support of 5,960!!!Hey Traders, in today's trading session we are monitoring US500 for a buying opportunity around 5,960 zone, US500 is trading in an uptrend and currently is in a correction phase in which it is approaching the trend at 5,960 support and resistance area.
Trade safe, Joe.

S&P500: Targeting 7,000 by the end of the year.S&P500 is bullish on its 1D technical outlook (RSI = 64.729, MACD = 100.990, ADX = 19.772) as it is extending the bullish wave started on the April 7th bottom. The long term formation is a Bullish Megaphone and the previous bullish wave peaked after a +48.33% rise. With the 1W RSI pattern almost identical as then, we remain bullish on SPX, TP = 7,000.
## If you like our free content follow our profile to get more daily ideas. ##
## Comments and likes are greatly appreciated. ##

S&P500 No signs of stopping here. Can hit 6900 before years end.The S&P500 index (SPX) has turned the 1W MA50 (blue trend-line) into Support, successfully testing it and holding and is now going for the All Time High Resistance test. Based on its 1W RSI structure and candle action, it resembles the previous times since 2023 that after a quick consolidation, it broke upwards again aggressively.
As you can see, both of those Bullish Legs that started on the 2023 Higher Lows trend-line, hit at least their 1.618 Fibonacci extension before a new 3-week red pull-back. In the case of 2024, even the 2.0 Fib ext got hit a little later.
As a result, we expect to see at least 6900 (Fib 1.618) before the end of 2025, with the good case scenario (Fib 2.0) going as high as 7500.
-------------------------------------------------------------------------------
** Please LIKE 👍, FOLLOW ✅, SHARE 🙌 and COMMENT ✍ if you enjoy this idea! Also share your ideas and charts in the comments section below! This is best way to keep it relevant, support us, keep the content here free and allow the idea to reach as many people as possible. **
-------------------------------------------------------------------------------
Disclosure: I am part of Trade Nation's Influencer program and receive a monthly fee for using their TradingView charts in my analysis.
💸💸💸💸💸💸
👇 👇 👇 👇 👇 👇

S&P500 INTRADAY uptrend continuation supported at 5960Key Support and Resistance Levels
Resistance Level 1: 6120
Resistance Level 2: 6170
Resistance Level 3: 6220
Support Level 1: 5960
Support Level 2: 5900
Support Level 3: 5800
This communication is for informational purposes only and should not be viewed as any form of recommendation as to a particular course of action or as investment advice. It is not intended as an offer or solicitation for the purchase or sale of any financial instrument or as an official confirmation of any transaction. Opinions, estimates and assumptions expressed herein are made as of the date of this communication and are subject to change without notice. This communication has been prepared based upon information, including market prices, data and other information, believed to be reliable; however, Trade Nation does not warrant its completeness or accuracy. All market prices and market data contained in or attached to this communication are indicative and subject to change without notice.

up or down...Hello friends🙌
🔊As you can see, the US500 index has been identified with several resistance encounters and the good support that the price has been able to break the resistance and turn it into support. Now, according to today's news, it seems that the price is targeting higher targets that we have identified for you.
In case of correction, it has strong support ahead of it, which we have identified with a white line, but don't forget that buyers have entered...📈
🔥Join us for more signals🔥
Trade safely with us.

US500 potential buyUS500 is setting up for a classic Wyckoff spring. This is a high probability set up with high risk to reward (5R+)
Here is what needs to happen
For situations 1 and 2,
a. price should break blue support (traps sellers and shakes out weak hands)
b. price should then close above any of the 2 blue supports with high volume
c. enter at the close of that bar or retest of the blue line
d. T.P @ recent high.
What do you think? how would you approach this better?

S&P500 awaits Trade Balance and Jobless Claims figuresTrump Tightens Immigration: Bans people from 12 countries, limits entry from 7 more, and blocks foreign students from attending Harvard.
Russia-Ukraine Tensions: Putin plans to strike back after a Ukrainian drone attack. Trump says Russia’s allies won’t profit from rebuilding Ukraine.
UK Housing Boom: Home sales rose 6% in May, the strongest in 3+ years, despite the end of a buyer tax break.
Germany & U.S.: German politician Friedrich Merz meets Trump today. At home, Germany faces rising public concern about tough economic times.
ECB Rate Cut Likely: The European Central Bank is expected to cut rates by 0.25% to 2%, but may slow further cuts soon.
Key Support and Resistance Levels
Key trading leel is at: 6000
Resistance Level 1: 6090
Resistance Level 2: 6140
Resistance Level 3: 6200
Support Level 1: 5900
Support Level 2: 5845
Support Level 3: 5800
This communication is for informational purposes only and should not be viewed as any form of recommendation as to a particular course of action or as investment advice. It is not intended as an offer or solicitation for the purchase or sale of any financial instrument or as an official confirmation of any transaction. Opinions, estimates and assumptions expressed herein are made as of the date of this communication and are subject to change without notice. This communication has been prepared based upon information, including market prices, data and other information, believed to be reliable; however, Trade Nation does not warrant its completeness or accuracy. All market prices and market data contained in or attached to this communication are indicative and subject to change without notice.

S&P500 Index (US500): Bullish Accumulation Pattern
I spotted a nice example of an ascending triangle pattern on a daily time frame.
To confirm a bullish continuation, we will need a bullish breakout
of its neckline.
A daily candle close above 5996 will provide a reliable confirmation.
A rise will be anticipated at least to 6080 resistance then.
❤️Please, support my work with like, thank you!❤️
I am part of Trade Nation's Influencer program and receive a monthly fee for using their TradingView charts in my analysis.

S&P500: Gearing up for a push to 6,100S&P500 is bullish on its 1D technical outlook (RSI = 64.611, MACD = 85.830, ADX = 19.630) as it has been trading inside a Channel Up for over a month. Right now it is halfway through the new bullish wave. We expect it to rise by at least +4.40%, same as the previous one. Stay bullish as long as the 4H MA50 holds, TP = 6,100.
## If you like our free content follow our profile to get more daily ideas. ##
## Comments and likes are greatly appreciated. ##

NASDAQ INDEX (US100): More Growth Ahead
For some unknown reason, I was asked by a dozen
of my subscribers to provide the update for US100.
Since early May, the index successfully updates the highs on a daily.
Such a tendency will remain at least till a test of a current ATH.
I think that the market is going to grow and reach at least 22100 level soon.
❤️Please, support my work with like, thank you!❤️

S&P500 Giant Inverse Head and Shoulders waiting for its breakoutThe S&P500 index (SPX) appears to be forming the Right Shoulder of a long-term Inverse Head and Shoulders (IH&S), the pattern that made the April 07 bottom of the Tariff War correction.
Currently supported by both its 1D MA50 (blue trend-line) and 1D MA200 (orange trend-line), once the overhead Resistance/ neckline breaks, we expect a +24.55% rise to the 2.0 Fibonacci extension, the equivalent of the rise it made from the April bottom up until now.
The target given is 7400.
-------------------------------------------------------------------------------
** Please LIKE 👍, FOLLOW ✅, SHARE 🙌 and COMMENT ✍ if you enjoy this idea! Also share your ideas and charts in the comments section below! This is best way to keep it relevant, support us, keep the content here free and allow the idea to reach as many people as possible. **
-------------------------------------------------------------------------------
Disclosure: I am part of Trade Nation's Influencer program and receive a monthly fee for using their TradingView charts in my analysis.
💸💸💸💸💸💸
👇 👇 👇 👇 👇 👇

S&P turns flat after bouncing off lows
The S&P 500, which ended Friday's session flat, has turned flat in today's session as well, after bouncing back from its earlier lows on reports that the US and Chinese leaders will meet to discuss trade after the two sides accused each other of violating their recent trade deal.
June could be a more challenging month for stocks if trade uncertainty persists, following what had been a strong May for global equities—marking their best monthly performance since November 2023. Much of that rally was driven by optimism that the worst of the US tariff threats had passed, encouraging investors to return to risk assets. However, any sense of calm was quickly disrupted after in the last few days, when Trump announced plans to double tariffs on steel and aluminum from 25% to 50%. This move has reignited concerns about a potential resurgence of trade tensions, adding to the already growing list of market risks. On top of that, investors are also bracing for political gridlock in Washington, as lawmakers prepare to negotiate a sweeping tax and spending bill amid escalating concerns about US government debt. With the debt ceiling deadline approaching, June could bring renewed market volatility, casting a cloud over the near-term S&P 500 outlook.
From a technical point of view, the trend is bullish but the doji candles in the last few trading sessions suggest that the momentum is waning and that a bit of a pullback could be on the cards.
Resistance at 5,900 was being tested at the time of writing. A daily close above this level would be a bullish outcome, in which case a run towards last week's high near 6,000 could be on the cards.
However, if resistance at 5,900 holds, then a potential drop to the next support area around 5787 would be the more likely outcome first. Further support is seen between 5,670 to 5,695.
By Fawad Razaqzada, market analyst with FOREX.com

S&P INTRADAY corrective pullback - pivotal zoneMacro & FX Outlook
Morgan Stanley forecasts a 9% decline in the US dollar by mid-2026, driven by a slowing US economy and expected Fed rate cuts.
Trading implication: Long positions in EUR, GBP, and other G10 currencies may benefit as USD weakens. Watch for renewed momentum in carry trades and emerging market FX.
Geopolitics
Ukraine-Russia conflict escalates with Ukrainian drone strikes hitting deep into Russia (including Siberia) and Moscow launching one of its most sustained aerial attacks.
Peace talks are expected in Turkey today.
Trading implication: Elevated geopolitical risk could support safe havens (gold, CHF, USD short-term) and oil prices, depending on energy infrastructure vulnerability.
UK Defense Spending
The UK will allocate £15 billion to expand its nuclear warhead program, new attack submarines, and build munitions factories.
Trading implication: Likely to support defense sector stocks and raise questions around fiscal policy ahead of elections; may contribute to upward pressure on gilts if deficits widen.
Poland Political Shift
Nationalist Karol Nawrocki wins presidential election, a setback for Poland’s pro-EU coalition government.
Trading implication: Potential increase in EU policy friction. May weigh on Polish assets and zloty (PLN) in the short term.
US Debt Ceiling & Diplomacy
Treasury Secretary Scott Bessent assured markets the US will not default but gave no timeline on cash exhaustion.
Also noted a Trump–Xi call is imminent, aiming to ease US-China tensions.
Trading implication: Uncertainty over Treasury liquidity may raise short-term bill yields. Any improvement in US-China relations could lift global risk sentiment and Chinese equities.
Key Support and Resistance Levels
Resistance Level 1: 6010
Resistance Level 2: 6070
Resistance Level 3: 6160
Support Level 1: 5780
Support Level 2: 5740
Support Level 3: 5700
This communication is for informational purposes only and should not be viewed as any form of recommendation as to a particular course of action or as investment advice. It is not intended as an offer or solicitation for the purchase or sale of any financial instrument or as an official confirmation of any transaction. Opinions, estimates and assumptions expressed herein are made as of the date of this communication and are subject to change without notice. This communication has been prepared based upon information, including market prices, data and other information, believed to be reliable; however, Trade Nation does not warrant its completeness or accuracy. All market prices and market data contained in or attached to this communication are indicative and subject to change without notice.

S&P500 finishing re-accumulation and sets eyes on 6230.The S&P500 / SPX has turned sideways after an impressive recovery from April's lows.
The 1day MA50 provides the same kind of support as it did after the October 2023 rebound.
The RSI pattern on both sequences is also similar and it suggests that the price is at the point where it breaks upwards to the Rising Resistance.
Target 6230.
Follow us, like the idea and leave a comment below!!

Bullish bounce off overlap support?S&P500 is falling towards the support level which is an overlap support that lines up with the 23.6% Fibonacci retracement and could bounce from this level to our take profit.
Entry: 5,784.04
Why we like it:
There is an overlap support level that aligns with the 23.6% Fibonacci retracement.
Stop loss: 5,689.40
Why we like it:
There is a pullback support level that is slightly above the 38.2% Fibonacci retracement.
Take profit: 5,973.58
Why we like it:
There is a pullback resistance level.
Enjoying your TradingView experience? Review us!
Please be advised that the information presented on TradingView is provided to Vantage (‘Vantage Global Limited’, ‘we’) by a third-party provider (‘Everest Fortune Group’). Please be reminded that you are solely responsible for the trading decisions on your account. There is a very high degree of risk involved in trading. Any information and/or content is intended entirely for research, educational and informational purposes only and does not constitute investment or consultation advice or investment strategy. The information is not tailored to the investment needs of any specific person and therefore does not involve a consideration of any of the investment objectives, financial situation or needs of any viewer that may receive it. Kindly also note that past performance is not a reliable indicator of future results. Actual results may differ materially from those anticipated in forward-looking or past performance statements. We assume no liability as to the accuracy or completeness of any of the information and/or content provided herein and the Company cannot be held responsible for any omission, mistake nor for any loss or damage including without limitation to any loss of profit which may arise from reliance on any information supplied by Everest Fortune Group.

S&P500: Inverse Head and Shoulders set to extend Apr-May rally.The S&P500 is bullish on its 1D technical outlook (RSI = 58.868, MACD = 85.480, ADX = 31.901) as it maintains a steady Channel Up pattern and just formed the first 1H Golden Cross in a month. Technically this is forming the Right Shoulder of an Inverse Head and Shoulders pattern, typically a bullish reversal formation, which not surprisingly was last seen in April when the Channel Up started and was completed with the previous 1H Golden Cross on April 24th. The result was a bullish extension fo rht 1.618 Fibonacci level. We're bullish on this, TP = 6,150.
## If you like our free content follow our profile to get more daily ideas. ##
## Comments and likes are greatly appreciated. ##

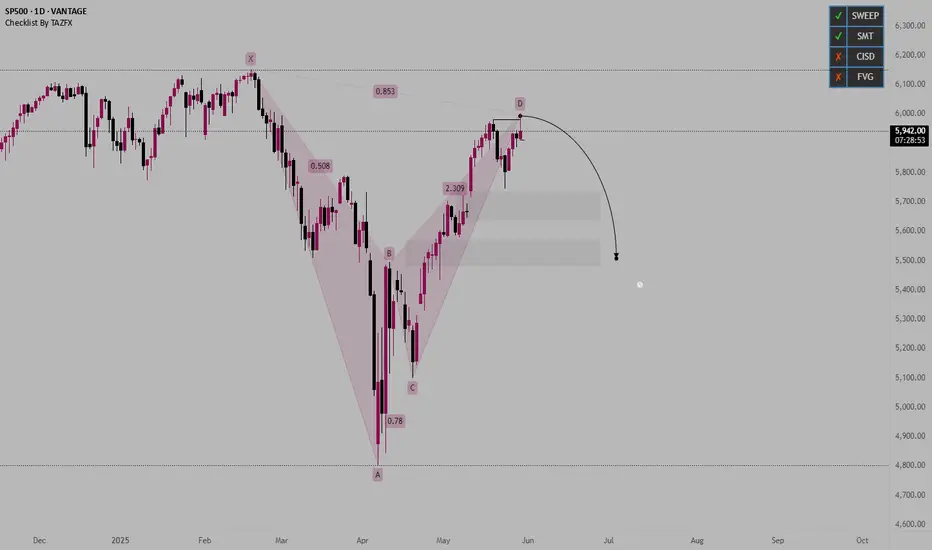
US500 - BEARISH HARMONICFollowing are the marked targets as am expecting price to move to downside to atleast fill the gap area
S&P INTRADAY corrective pullback - support retest?Trump-Era Tariffs Canceled: A US court struck down the “Liberation Day” tariffs, effective immediately. This boosts sentiment for industrials, consumer goods, and global supply chain-reliant stocks. The government is appealing the ruling.
US Dollar Strengthens: The DXY is back above 100, up 1.8% from last week’s lows. A strong dollar helps importers but may pressure exporters and commodities.
Fed Rate Cut Expectations Decline: Markets now price 42 bps of rate cuts in 2024, down from 50 bps. This supports financials (e.g. banks), but challenges rate-sensitive sectors like real estate and small caps.
Mixed Eurozone Data: Positive Italian confidence figures offset weak German and French job numbers, offering slight global risk support. Limited direct impact on US stocks.
Fed Flags Stagflation Risk: Minutes show the Fed is worried about stagflation. This could weaken confidence in growth stocks and favor defensive sectors.
Today’s US Data Watch:
Q1 GDP 2nd estimate (expected -0.3%)
Weekly jobless claims
Fed speakers
All ahead of Friday’s key PCE inflation data
Market Outlook
Positive: Trade relief, resilient dollar, stronger bank outlook
Caution: Slowing growth, inflation worries, fewer rate cuts
Focus Areas: Industrials, financials, tech (watch for pullbacks); avoid rate-sensitive sectors short term
Key Support and Resistance Levels
Resistance Level 1: 6010
Resistance Level 2: 6070
Resistance Level 3: 6160
Support Level 1: 5780
Support Level 2: 5740
Support Level 3: 5700
This communication is for informational purposes only and should not be viewed as any form of recommendation as to a particular course of action or as investment advice. It is not intended as an offer or solicitation for the purchase or sale of any financial instrument or as an official confirmation of any transaction. Opinions, estimates and assumptions expressed herein are made as of the date of this communication and are subject to change without notice. This communication has been prepared based upon information, including market prices, data and other information, believed to be reliable; however, Trade Nation does not warrant its completeness or accuracy. All market prices and market data contained in or attached to this communication are indicative and subject to change without notice.

US500 Is Going Down! Sell!
Please, check our technical outlook for US500.
Time Frame: 1D
Current Trend: Bearish
Sentiment: Overbought (based on 7-period RSI)
Forecast: Bearish
The market is approaching a key horizontal level 5,960.96.
Considering the today's price action, probabilities will be high to see a movement to 5,538.99.
P.S
We determine oversold/overbought condition with RSI indicator.
When it drops below 30 - the market is considered to be oversold.
When it bounces above 70 - the market is considered to be overbought.
Disclosure: I am part of Trade Nation's Influencer program and receive a monthly fee for using their TradingView charts in my analysis.
Like and subscribe and comment my ideas if you enjoy them!

US500 - Will the stock market reach ATH?!The index is above the EMA200 and EMA50 on the four-hour timeframe and is trading in its ascending channel. I expect the index to continue moving, and on the other hand, if the index declines towards a certain zone, you can also look for the next S&P long positions with a risk-reward ratio.
Yesterday, a U.S. federal court halted the implementation of President Trump’s “Freedom Day” tariffs. The U.S. Court of International Trade ruled that these tariffs exceeded the legal authority granted to the president and unanimously decided to revoke them. Nonetheless, Trump still retains the right to appeal the ruling.
Following the court’s decision, President Trump promptly filed an appeal. In response, the White House issued a statement asserting, “The decision on how to handle a national emergency should not fall into the hands of unelected judges.”
Meanwhile, the market reacted strongly to Nvidia’s latest financial report. The company’s stock surged by as much as 5.8% in after-hours trading, before settling at a 4.8% gain compared to the previous day.
This bullish movement reflects investors’ confidence in Nvidia’s continued strong performance.
Nvidia is actively expanding into new markets, including the Middle East—an indication that the company is poised for sustained growth even if its presence in China is constrained.
The rally in Nvidia’s stock didn’t just lift semiconductor companies; broader markets followed suit. The S&P 500 index climbed to 6,005.75 points, representing a 1.7% increase from the prior session.
According to the company’s announcement, Nvidia posted $44.1 billion in revenue for the first quarter of fiscal year 2026, marking a 69% increase year-over-year and slightly surpassing analysts’ expectations. Revenue from data center operations rose 73% to reach $39.1 billion.
CEO Jensen Huang stated: “Our Blackwell NVL72 AI supercomputer—designed for reasoning and acting as a ‘thinking machine’—is now being mass-produced by system builders and cloud service providers.” He added, “There is enormous global demand for Nvidia’s AI infrastructure. Over the past year alone, AI inference token generation has grown tenfold. As AI agents become mainstream, the demand for AI compute will continue to surge.”
A Reuters poll now projects that the S&P 500 will reach 5,900 by the end of 2025—down from the 6,500 level forecast in February. Similarly, the Dow Jones index is expected to close 2025 at 43,708, compared to the previous projection of 47,024 from the February survey.
Separately, the Federal Deposit Insurance Corporation (FDIC) reported that the increase in U.S. bank profits was largely driven by growth in noninterest income. Bank earnings in the first quarter of 2025 rose by 5.8%, reaching $70.6 billion. While overall asset quality remains favorable, the commercial real estate loan portfolios continue to show signs of weakness. The number of “problem banks” declined by three, bringing the total down to 63. The banking industry also reported a slowdown in lending growth; the annual loan growth rate for the first quarter was just 3%, down from the pre-pandemic average of 4.9%.
