"US500/SPX500" Index Market Money Heist Plan (Day / Scalping)🌟Hi! Hola! Ola! Bonjour! Hallo! Marhaba!🌟
Dear Money Makers & Robbers, 🤑 💰💸✈️
Based on 🔥Thief Trading style technical and fundamental analysis🔥, here is our master plan to heist the "US500 / SPX500" Index CFD Market. Please adhere to the strategy I've outlined in the chart, which emphasizes long entry. Our aim is to escape near the high-risk ATR Zone. Risky level, overbought market, consolidation, trend reversal, trap at the level where traders and bearish robbers are stronger. 🏆💸"Take profit and treat yourself, traders. You deserve it!💪🏆🎉
Entry 📈 : "The heist is on! Wait for the MA breakout (5500) then make your move - Bullish profits await!"
however I advise to Place Buy stop orders above the Moving average (or) Place buy limit orders within a 15 or 30 minute timeframe most recent or swing, low or high level for Pullback entries.
📌I strongly advise you to set an "alert (Alarm)" on your chart so you can see when the breakout entry occurs.
Stop Loss 🛑: "🔊 Yo, listen up! 🗣️ If you're lookin' to get in on a buy stop order, don't even think about settin' that stop loss till after the breakout 🚀. You feel me? Now, if you're smart, you'll place that stop loss where I told you to 📍, but if you're a rebel, you can put it wherever you like 🤪 - just don't say I didn't warn you ⚠️. You're playin' with fire 🔥, and it's your risk, not mine 👊."
📍 Thief SL placed at the recent/swing low level Using the 1H timeframe (5200) Day trade basis.
📍 SL is based on your risk of the trade, lot size and how many multiple orders you have to take.
🏴☠️Target 🎯: 5750 (or) Escape Before the Target
🧲Scalpers, take note 👀 : only scalp on the Long side. If you have a lot of money, you can go straight away; if not, you can join swing traders and carry out the robbery plan. Use trailing SL to safeguard your money 💰.
💰💵💴💸"US500/SPX500" Index CFD Market Heist Plan (Day / Scalping Trade) is currently experiencing a bullishness🐂.., driven by several key factors.👆👆👆
📰🗞️Get & Read the Fundamental, Macro economics, COT Report, Geopolitical and News Analysis, Sentimental Outlook, Intermarket Analysis, Index-Specific Analysis,Positioning and future trend targets with Overall Score...... go ahead to check 👉👉👉🔗🔗
⚠️Trading Alert : News Releases and Position Management 📰 🗞️ 🚫🚏
As a reminder, news releases can have a significant impact on market prices and volatility. To minimize potential losses and protect your running positions,
we recommend the following:
Avoid taking new trades during news releases
Use trailing stop-loss orders to protect your running positions and lock in profits
💖Supporting our robbery plan 💥Hit the Boost Button💥 will enable us to effortlessly make and steal money 💰💵. Boost the strength of our robbery team. Every day in this market make money with ease by using the Thief Trading Style.🏆💪🤝❤️🎉🚀
I'll see you soon with another heist plan, so stay tuned 🤑🐱👤🤗🤩
Us500

S&P INTRADAY uptrend consolidation supported at 5793US Equities poised for a post-holiday rebound, with futures up following Donald Trump's decision to delay EU tariff implementation until July 9. The temporary reprieve has improved short-term risk sentiment, with the EU seeking to fast-track trade talks focused on critical sectors—potentially bullish for industrials, autos, and tech exporters.
Geopolitical Risk Elevated
Western pressure on Russia is intensifying:
Germany's decision to allow Ukraine long-range strikes into Russian territory marks a notable escalation.
Trump signaled potential new sanctions against Russia and sharply criticized Putin, increasing global risk premiums.
This could fuel defense sector strength and lift energy stocks if geopolitical tension drives oil prices higher.
FX Pressure – USD Weakness Persists
The U.S. dollar remains under pressure, despite a slight intraday bounce. It has fallen over 7% YTD, hitting its lowest level since 2023 last Friday.
Speculative traders and hedge funds are building USD short positions.
Drivers of weakness: Trump’s tariff rhetoric, and concerns over the expanding U.S. fiscal deficit.
Trading Implications:
Risk-on tone favors growth stocks, tech, and cyclicals.
Multinationals may benefit from USD weakness, improving earnings translations.
Defense stocks (e.g., RTX, LMT) could gain from the escalation in Ukraine.
Watch for volatility as headlines shift around trade, tariffs, and Russia.
Key Support and Resistance Levels
Resistance Level 1: 5970
Resistance Level 2: 6010
Resistance Level 3: 6085
Support Level 1: 5793
Support Level 2: 5730
Support Level 3: 5685
This communication is for informational purposes only and should not be viewed as any form of recommendation as to a particular course of action or as investment advice. It is not intended as an offer or solicitation for the purchase or sale of any financial instrument or as an official confirmation of any transaction. Opinions, estimates and assumptions expressed herein are made as of the date of this communication and are subject to change without notice. This communication has been prepared based upon information, including market prices, data and other information, believed to be reliable; however, Trade Nation does not warrant its completeness or accuracy. All market prices and market data contained in or attached to this communication are indicative and subject to change without notice.

Bullish continuation?S&P500 has bounced off the support level which is a pullback support that aligns with the 23.6% Fibonacci retracement and could potentially rise from this level to our take profit.
Entry: 5,784.04
Why we like it:
There is a pullback support level that lines up with the 23.6% Fibonacci retracement.
Stop loss: 5,689.40
Why we lik eit:
There is a pullback support level that is slightly above the 38.2% Fibonacci retracement.
Take profit: 6,003.35
Why we like it:
There is a pullback resistance level.
Enjoying your TradingView experience? Review us!
Please be advised that the information presented on TradingView is provided to Vantage (‘Vantage Global Limited’, ‘we’) by a third-party provider (‘Everest Fortune Group’). Please be reminded that you are solely responsible for the trading decisions on your account. There is a very high degree of risk involved in trading. Any information and/or content is intended entirely for research, educational and informational purposes only and does not constitute investment or consultation advice or investment strategy. The information is not tailored to the investment needs of any specific person and therefore does not involve a consideration of any of the investment objectives, financial situation or needs of any viewer that may receive it. Kindly also note that past performance is not a reliable indicator of future results. Actual results may differ materially from those anticipated in forward-looking or past performance statements. We assume no liability as to the accuracy or completeness of any of the information and/or content provided herein and the Company cannot be held responsible for any omission, mistake nor for any loss or damage including without limitation to any loss of profit which may arise from reliance on any information supplied by Everest Fortune Group.

Risk-Off Mode: Indices Under Pressure, VIX Breakout in Play!🌍 Indices Under Pressure as Volatility Spikes – Market Analysis (May 22, 2025) 🚨
My TradingView multi-chart workspace is tracking major global indices alongside the VIX (bottom right). The visual tells the story: broad-based selling is hitting equities, and the VIX is on the rise, signaling a clear risk-off environment.
Key Observations:
Indices in the Red:
All major indices in my workspace are under pressure, with sharp declines across the S&P 500, NASDAQ, Dow, DAX, and others. This aligns with today’s global heatmaps, which are flashing red across sectors and regions. The selling is broad, not just isolated to tech or cyclicals.
VIX Volatility Index Elevated:
The VIX (CBOE Volatility Index) is spiking, up over 15% today and holding above the 20 level (FXEmpire). This “fear gauge” confirms that traders are hedging aggressively and bracing for more turbulence. Historically, a rising VIX alongside falling indices is a classic sign of heightened uncertainty and potential for further downside.
Macro & Geopolitical Backdrop:
The selling pressure is fueled by persistent US-China trade tensions, new tariffs, and a lack of clear central bank support. The White House remains firm on its trade stance, while the Fed is not signaling imminent rate cuts (VT Markets). This policy vacuum is amplifying volatility and risk aversion.
Global Sentiment:
Asian and European markets are also deep in the red, with historic single-day losses in some indices. The “Magnificent Seven” US tech stocks have entered bear market territory, and even traditional safe havens like gold are seeing some liquidation as investors scramble for cash.
What’s Next?
Short-Term Outlook:
With the VIX elevated and indices breaking key support levels, expect continued choppiness and possible further downside. Macro data releases and any shift in trade rhetoric will be key catalysts. Defensive positioning and risk management are crucial in this environment.
Potential for Rebound:
If we see a de-escalation in trade tensions or dovish signals from central banks, a relief rally is possible. But for now, the path of least resistance appears lower, with volatility likely to remain high.
Summary:
The charts don’t lie – indices are under heavy selling pressure, and the VIX is confirming a risk-off mood. Stay nimble, watch for headline risks, and be prepared for more volatility in the days ahead. 📉🟥⚡

S&P500: First Trade War indicates that ATH comes soon.S&P500 is a very healthy bullish levels on its 1D technical outlook (RSI = 65.213, MACD = 111.000, ADX = 49.249), being considerably over its 1D MA200, with the 1D RSI very close to the overbought zone. This resembles the first Trade War in 2018, when once the 1D MA200 was crossed, it became a Support level and extended the rally to the index Highs and the R1. We remain bullish on SPX with TP = 6,150.
See how our prior idea has worked out:
## If you like our free content follow our profile to get more daily ideas. ##
## Comments and likes are greatly appreciated. ##

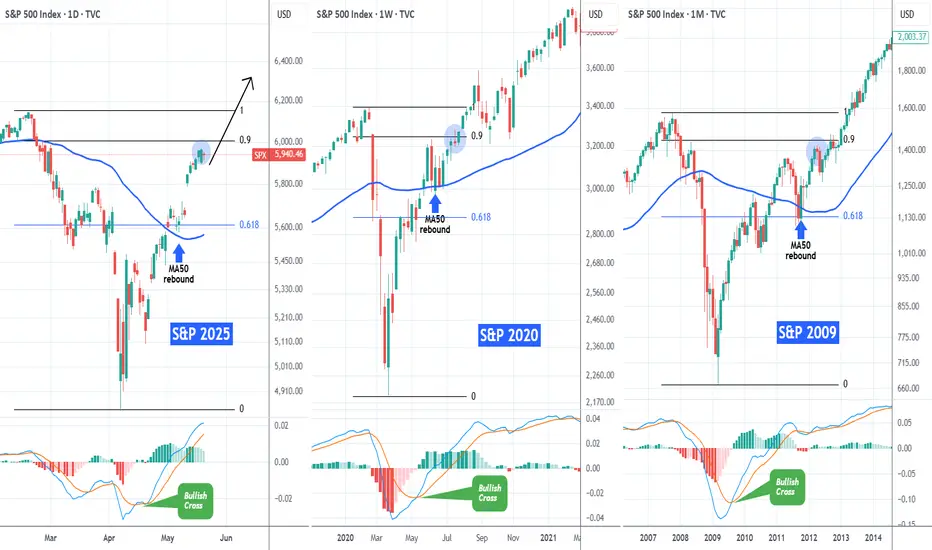
S&P500 Same recovery path with 2020 and 2009The S&P500 index (SPX) has recovered almost 90% of its losses since the February 19 2025 All Time High (ATH) and many have already started calling for a technical correction.
If we compare however this 2025 Tariff fueled correction with the recent most aggressive ones (COVID crash in 2020 and Housing Crisis 2008/2009) we see a different picture.
On their respective 0.9 Fibonacci levels (close to which we are today), both of those market recoveries went straight to new ATHs, without testing their MA50 (blue trend-line) until the next Cycle peak. They had that tested before when the price was trading near (or on)the 0.618 Fib. Notice also how a MACD Bullish on all three charts, confirmed the aggressive recovery pattern straight after the bottom.
Instead of a correction, history shows that we might be looking at new ATH soon.
-------------------------------------------------------------------------------
** Please LIKE 👍, FOLLOW ✅, SHARE 🙌 and COMMENT ✍ if you enjoy this idea! Also share your ideas and charts in the comments section below! This is best way to keep it relevant, support us, keep the content here free and allow the idea to reach as many people as possible. **
-------------------------------------------------------------------------------
💸💸💸💸💸💸
👇 👇 👇 👇 👇 👇
S&P500 Steady Channel Up to 6100The S&P500 index (SPX) has been trading within a Channel Up pattern from the moment (April 22) it broke above the 4H MA50 (blue trend-line). For that 1 month period, it has held the 4H MA50 and that maintains the bullish trend, generating Bullish Legs to High after High.
The last two Bullish Legs have increased by +4.92%, so as long as the 4H MA50 holds, we expect the current Leg to be completed at 6100.
-------------------------------------------------------------------------------
** Please LIKE 👍, FOLLOW ✅, SHARE 🙌 and COMMENT ✍ if you enjoy this idea! Also share your ideas and charts in the comments section below! This is best way to keep it relevant, support us, keep the content here free and allow the idea to reach as many people as possible. **
-------------------------------------------------------------------------------
Disclosure: I am part of Trade Nation's Influencer program and receive a monthly fee for using their TradingView charts in my analysis.
💸💸💸💸💸💸
👇 👇 👇 👇 👇 👇

S&P500 Historic reversals like this delivered even +100% gains!The S&P500 (SPX) is making a remarkable bullish reversal and on the monthly (1M) chart is even more evident due to April's candle, which almost closed flat leaving a huge wick under it, a feat we've never seen in recent history.
What we have seen however since the 2008 Housing Crisis, is every time the index hits (or approaches) its 1M MA50 (blue trend-line), it reverses to an incredible rally, technically a new Bull Cycle.
This is what happened in April, the index came a breath away from the 1M MA50 and delivered the strongest monthly bullish reversal of our time. On top of that, it hit and rebounded exactly on the former All Time High Resistance, which held and turned into Support. All such Resistance levels since 2008 have held. Also note that the only time the 1M MA50 really broke (closed the month below it), was during the March 2020 COVID flash-crash, which is a non-technical event/ irregularity and still it rebounded on the 1M MA100 (green trend-line).
The minimum long-term rise that SPX had after such correction was +76.20% and the maximum +104.17%. Assuming the minimum price increase for the current emerging rise, we expect the index to hit 8300 by late 2027.
-------------------------------------------------------------------------------
** Please LIKE 👍, FOLLOW ✅, SHARE 🙌 and COMMENT ✍ if you enjoy this idea! Also share your ideas and charts in the comments section below! This is best way to keep it relevant, support us, keep the content here free and allow the idea to reach as many people as possible. **
-------------------------------------------------------------------------------
💸💸💸💸💸💸
👇 👇 👇 👇 👇 👇

S&P500 INDEX (US500): More Growth is Coming
This week, S&P500 managed to violated a significant
daily demand zone.
It opens a potential for much more growth and trend-continuation.
Next resistance - 5973
❤️Please, support my work with like, thank you!❤️

S&P500 Uptrend pause supported at 5925India Trade Deal: Trump claims India offered a zero-tariff trade deal with the U.S., but no official confirmation yet. He also said he told Apple CEO Tim Cook to stop building plants in India, despite Apple shifting production there to reduce reliance on China.
Iran Nuclear Talks: Iran may be open to giving up nuclear weapons in exchange for immediate sanctions relief, per NBC. Oil prices fell on speculation this could boost supply.
Russia-Ukraine Talks: Peace progress looks unlikely as Putin sent only low-level officials to talks in Turkey. Trump said he might attend “if appropriate,” but downplayed chances.
Overall: Trump is emphasizing trade and foreign policy strength, while global tensions continue to shape markets and diplomacy.
Key Support and Resistance Levels
Resistance Level 1: 5925
Resistance Level 2: 5970
Resistance Level 3: 6000
Support Level 1: 5790
Support Level 2: 5730
Support Level 3: 5685
This communication is for informational purposes only and should not be viewed as any form of recommendation as to a particular course of action or as investment advice. It is not intended as an offer or solicitation for the purchase or sale of any financial instrument or as an official confirmation of any transaction. Opinions, estimates and assumptions expressed herein are made as of the date of this communication and are subject to change without notice. This communication has been prepared based upon information, including market prices, data and other information, believed to be reliable; however, Trade Nation does not warrant its completeness or accuracy. All market prices and market data contained in or attached to this communication are indicative and subject to change without notice.

S&P500: VIX confirmed new Bull Cycle, eyes 9,800.S&P500 is on excellent bullish levels on its 1D technical outlook (RSI = 66.480, MACD = 76.110, ADX = 38.627) and has technically fulfilled all conditions to extend this recovery and transition into a new Bull Cycle. VIX shows with its massive spike and then aggressive retreat that the correction's bottom is in and is in fact similar to March 2020 (COVID) and March 2009 (subprime crisis). The Bull Cycles after those were similar, the smallest was +105.62%. In accordance to that, we have a long term TP = 9,800.
## If you like our free content follow our profile to get more daily ideas. ##
## Comments and likes are greatly appreciated. ##

US500 - Let the Bulls Strive!Hello TradingView Family / Fellow Traders. This is Richard, also known as theSignalyst.
📈US500 has been overall bullish trading within the rising channel marked in red.
Moreover, the blue zone is a strong support and structure!
🏹 Thus, the highlighted blue circle is a strong area to look for buy setups as it is the intersection of support and lower red trendline acting as a non-horizontal support.
📚 As per my trading style:
As #US500 approaches the blue circle zone, I will be looking for bullish reversal setups (like a double bottom pattern, trendline break , and so on...)
📚 Always follow your trading plan regarding entry, risk management, and trade management.
Good luck!
All Strategies Are Good; If Managed Properly!
~Rich
Disclosure: I am part of Trade Nation's Influencer program and receive a monthly fee for using their TradingView charts in my analysis.

S&P500 Alert! Entering a medium-term SELL ZONE!The S&P500 index (SPX) has recovered the 0.786 Fibonacci retracement level, limiting the Trade War losses considerably. Trading this week above its 1W MA50 (blue trend-line), the index has confirmed that it resumed its long-term bullish trend.
On he medium-term though attention is needed as we're headed towards a range, which in the past 10 years has historically been an interim Sell Zone. That's the 0.786 - 0.9 Fibonacci range, which since the 2016 correction, it has always rejected the uptrend of a 1W MA200 (orange trend-line) led recovery.
On 3 out of 3 occasions so far (April 2016, June 2020, July 2023), every time the price tested the 0.9 Fib, it got rejected back to its 1W MA50 (blue trend-line). In 2023 the pull-back bottomed in 3 months but in 2020 and 2016 it took considerably less.
As a result, we call for caution near the 0.9 Fib for a potential medium-term pull-back but on the long-term the bullish trend is intact and historically it targets a minimum +27.74% from the All Time High (ATH), which is translated into a 7800 Target.
-------------------------------------------------------------------------------
** Please LIKE 👍, FOLLOW ✅, SHARE 🙌 and COMMENT ✍ if you enjoy this idea! Also share your ideas and charts in the comments section below! This is best way to keep it relevant, support us, keep the content here free and allow the idea to reach as many people as possible. **
-------------------------------------------------------------------------------
💸💸💸💸💸💸
👇 👇 👇 👇 👇 👇

S&P500 Chasing a Retrace - Waiting for Equilibrium After Rally🗓️ Yesterday, I mentioned watching the S&P 500 for a retrace to find a potential long entry. But with the US-China tariff agreement announced, the market rallied hard 🚀—a clear positive for stocks. We didn’t get much of a pullback, and right now, I see the S&P 500 as overextended. I’m not looking to jump in at these premium levels. Instead, I’m waiting for a Fibonacci retrace back down into equilibrium on the current swing for a better opportunity. 👀
My plan: I’ll watch for a bearish break of structure to signal a retrace, then monitor price action as we approach support. If support holds and we get a bullish break of structure, that’s when I’ll look to get involved. 🔄
Just sharing my idea here—this isn’t financial advice! 📢

Cautious Optimism: What’s Next for the S&P 500US500 My Outlook for the Next Week:
Given the relentless bullishness on the chart and the current backdrop, here’s how I see the next week playing out:
Short-Term: The S&P 500 may continue to consolidate or experience mild pullbacks as investors digest recent gains and await fresh catalysts. Sector rotation could create choppiness, especially if tech underperforms.
Catalysts: Watch for key economic data (inflation, employment, Fed commentary) and any major earnings surprises. These could trigger renewed momentum or a sharper correction.
Risk/Reward: The risk of a sharp correction is rising, but the underlying trend remains bullish unless there’s a significant negative surprise. A shallow pullback or sideways action would be healthy and could set up the next leg higher if fundamentals remain intact.
In summary: The S&P 500’s relentless bullishness is being tested by mixed sentiment and cautious analyst forecasts. Fundamentals are still supportive, but risks are rising. For the next week, expect consolidation or mild volatility, with the potential for renewed upside if economic data and earnings remain strong. Stay nimble, watch for sector rotation, and be prepared for both short-term pullbacks and longer-term opportunities.
Not financial advice.

US500 bearish 12 May - 16 May 2025S&P 500 Bearish Outlook: Targeting $5,100 Amid Rising Uncertainty
As of May 12, 2025, the S&P 500 (US500) stands at 5,661, reflecting a robust recovery from its April lows. However, I anticipate a bearish shift, projecting a decline towards the $5,100 level in the near term. Several converging factors underpin this outlook:
1. Anticipated Weakness in Core CPI Data
The upcoming release of the April Core Consumer Price Index (CPI) on May 13 is poised to be a pivotal event. While the year-over-year Core CPI is forecasted at 2.8%, matching the previous month's figure, the month-over-month increase is expected to rise to 0.3%, up from 0.1% in March. This acceleration suggests persistent inflationary pressures, potentially prompting the Federal Reserve to maintain or even tighten monetary policy, thereby exerting downward pressure on equities.
2. Deteriorating Market Sentiment and Forecasts
A notable shift in market sentiment is evident, with key indicators turning bearish. A prominent S&P 500 model has signaled its first bearish outlook since February 2022, reflecting growing investor apprehension. Additionally, leading financial institutions have revised their S&P 500 targets downward:
Goldman Sachs: Reduced from 6,500 to 5,700
RBC Capital Markets: Lowered from 6,600 to 5,500
Oppenheimer: Cut from 7,100 to 5,950
Yardeni Research: Adjusted from 7,000 to 6,000
These revisions underscore the mounting concerns over economic headwinds and market volatility.
3. Sectoral Divergence: Opportunities Amidst the Downturn
While the broader market faces challenges, certain sectors may exhibit resilience or even bullish tendencies:
Healthcare: Continues to serve as a defensive sector, with companies demonstrating solid quarterly results and reaffirming full-year guidance despite tariff impacts.
Energy Infrastructure: Firms like Enbridge and TC Energy benefit from long-term structural tailwinds, including rising energy demand and global energy security priorities.
Financials and Technology: Sectors represented by ETFs such as XLK and XLF are highlighted for their strong fundamentals and growth prospects.
Conversely, consumer discretionary sectors are showing signs of strain, with negative revenue surprises and companies like Harley-Davidson withdrawing their 2025 outlooks amid tariff uncertainties.
4. Implications of the US-UK Trade Deal
Recent developments in the US-UK trade agreement further contribute to market uncertainty. While the deal includes exemptions for certain British goods, such as aerospace components and a quota of 100,000 UK-made cars annually, it also maintains a baseline 10% tariff on foreign goods. This policy introduces complexity and potential cost pressures for multinational companies operating across borders.
Moreover, the agreement has faced criticism for being one-sided, with concerns that it may not adequately protect domestic industries or address broader trade imbalances. Such apprehensions can dampen investor confidence and contribute to market volatility.
The convergence of persistent inflation, cautious monetary policy, revised market forecasts, and the complexities introduced by recent trade agreements suggest a bearish trajectory for the S&P 500, with a potential decline towards $5,100. Investors should remain vigilant, monitoring sector-specific developments and macroeconomic indicators to navigate the evolving market landscape.
Disclaimer: This analysis is for informational purposes only and does not constitute investment advice. Always conduct your own research before making investment decisions.

S&P INTRADAY uptrend continuationMarket and Geopolitical Update
US–UK Trade Deal: Donald Trump announced a trade agreement with the UK, calling it the first of his promised deals. Details will be released by the White House.
Chipmakers Rise: The US plans to roll back some Biden-era AI chip export restrictions, boosting chip stocks. New rules are in development to better control foreign chip use.
Markets Rally: US stock futures climbed, Bitcoin neared $100,000, and the dollar strengthened slightly after the Fed signaled no rush to cut rates.
Corporate Struggles: Despite market optimism, companies continue to feel tariff pressure. Toyota expects a $1.3 billion hit, while Maersk downgraded its transport outlook.
India–Pakistan Tensions: Pakistan reported shooting down 12 Indian drones, escalating long-standing tensions. India’s Nifty 50 dropped 0.4%, and Pakistan’s KSE-30 fell 7%.
Key Support and Resistance Levels
Resistance Level 1: 5730
Resistance Level 2: 5780
Resistance Level 3: 5874
Support Level 1: 5580
Support Level 2: 5510
Support Level 3: 5440
This communication is for informational purposes only and should not be viewed as any form of recommendation as to a particular course of action or as investment advice. It is not intended as an offer or solicitation for the purchase or sale of any financial instrument or as an official confirmation of any transaction. Opinions, estimates and assumptions expressed herein are made as of the date of this communication and are subject to change without notice. This communication has been prepared based upon information, including market prices, data and other information, believed to be reliable; however, Trade Nation does not warrant its completeness or accuracy. All market prices and market data contained in or attached to this communication are indicative and subject to change without notice.

US500 - Which way will the stock market go?!The index is trading above the EMA200 and EMA50 on the four-hour timeframe and is trading in its ascending channel. If the index moves down towards the specified demand zone, one can look for further S&P buy positions with a good risk-reward ratio.
In its meeting last night, the U.S. Federal Reserve decided to keep the federal funds rate steady within the 4.25% to 4.50% range. This decision comes amid growing concerns about simultaneous rises in inflation and unemployment, particularly driven by the tariff policies of the Trump administration.
This marks the third consecutive time this year that the Fed has held rates unchanged, reflecting mounting economic uncertainty and fears of stagflation.Fed Chair Jerome Powell warned that the combination of high inflation, slow economic growth, and rising unemployment could lead the economy into stagflation. He noted that newly imposed tariffs could delay the disinflation process for up to a year or more.
The Trump administration has introduced steep tariffs, including a 145% levy on imports from China. These measures have contributed to rising prices and slower economic growth, placing additional strain on monetary policymakers.
Following the Fed’s announcement, stock markets exhibited volatility. The S&P 500 initially fell but ended the day higher. Bond yields declined, while the U.S. dollar strengthened.
Powell emphasized that future monetary policy decisions will be heavily data-dependent, and the central bank stands ready to act swiftly if necessary. He acknowledged that the economic outlook remains uncertain, requiring cautious and adaptive policy management.
Faced with escalating uncertainty and inflationary pressures stemming from new trade measures, the Fed has adopted a cautious stance. Given the current mixed economic indicators, the central bank is expected to maintain its interest rate policy until the economic picture becomes clearer.
Economists at Goldman Sachs have issued a warning that U.S. inflation is on the rise and may reach 3.8% by the end of 2025. According to their analysis, the weakening of the U.S. dollar and the implementation of tariff policies are the main drivers of increased inflationary pressure. Additionally, changes in import demand could elevate production costs and further intensify price increases.
The Wall Street Journal reported that new tariffs may raise the prices of smartphones and laptops by up to 30%. Contrary to popular belief, this inflationary impact may not be temporary and could result in sustained upward pressure on prices.
Meanwhile, ahead of the FOMC meeting, Alphabet (Google’s parent company) saw its stock plunge over 8%, falling to $149.50. Eddy Cue, a senior executive at Apple, disclosed that for the first time in April, user activity on browsers and search engines had declined. In response, Apple is exploring the integration of AI-powered search into its browsers—a move that could pose a serious threat to Google’s advertising revenue.
Simultaneously, President Trump announced he would not enforce the AI content restriction law, initially introduced during the Biden administration and scheduled to take effect on May 15. This decision comes just before his trip to the Middle East, where countries like Saudi Arabia and the UAE have voiced frustration over chip access restrictions.
Trump administration officials are currently drafting new legislation aimed at tightening control over the export of advanced chips. This initiative may form part of a broader agreement, as the UAE has pledged to invest up to $1.4 trillion in U.S. technology and infrastructure over the next decade.

S&P500: Hit its 4H MA50. Can it provide a price push?S&P500 (SPX) is neutral on its 1D technical outlook (RSI = 52.949, MACD = 19.450, ADX = 31.038) as the index just hit its 4H MA50, which is holding since April 22nd. This is at the bottom of the 4H Channel Up so as long as it holds, the signal is bullish. In the meantime the index again hit the P1 level, which was previously a Resistance. As long as this demand zone holds, we are aiming at the R2 level (TP = 5,790).
## If you like our free content follow our profile to get more daily ideas. ##
## Comments and likes are greatly appreciated. ##

S&P500 Stuck between the 1D MA50 and 1D MA200.The S&P500 index (SPX) is now on a short-term correction following the impressive recovery of the last 30 days that made it almost test its 1D MA200 (orange trend-line). This is a technical rejection but the fact that the 1D MA50 (blue trend-line) is now the Support can be encouraging.
The reason is that since January 2023, every time the index broke above its 1D MA50 it turned into a Support that held and produced an immediate bullish extension on every occasion except for one time (Sep 2024), which still recovered 1 week after.
As a result, it is more likely for SPX to test its All Time High (ATH) by July than entering a long-term correction again.
-------------------------------------------------------------------------------
** Please LIKE 👍, FOLLOW ✅, SHARE 🙌 and COMMENT ✍ if you enjoy this idea! Also share your ideas and charts in the comments section below! This is best way to keep it relevant, support us, keep the content here free and allow the idea to reach as many people as possible. **
-------------------------------------------------------------------------------
Disclosure: I am part of Trade Nation's Influencer program and receive a monthly fee for using their TradingView charts in my analysis.
💸💸💸💸💸💸
👇 👇 👇 👇 👇 👇

S&P500 INTRADAY resistance at 5510US stock futures are signaling a second straight day of losses. Palantir shares dropped 9% pre-market after its earnings disappointed high expectations. Ford also fell, withdrawing its financial guidance and warning that new tariffs would hurt profitability.
In Europe, political uncertainty hit German markets as Friedrich Merz failed to secure a majority vote to become Germany’s next chancellor, delaying his swearing-in and shaking investor confidence. The DAX index slid 1.4% on the news.
Meanwhile, EU-US trade tensions are intensifying. The European Union expects new US trade probes could expose up to €549 billion ($622 billion) worth of EU exports to American tariffs, adding pressure to already strained transatlantic negotiations.
Key Support and Resistance Levels
Resistance Level 1: 5693
Resistance Level 2: 5780
Resistance Level 3: 5876
Support Level 1: 5512
Support Level 2: 5438
Support Level 3: 5390
This communication is for informational purposes only and should not be viewed as any form of recommendation as to a particular course of action or as investment advice. It is not intended as an offer or solicitation for the purchase or sale of any financial instrument or as an official confirmation of any transaction. Opinions, estimates and assumptions expressed herein are made as of the date of this communication and are subject to change without notice. This communication has been prepared based upon information, including market prices, data and other information, believed to be reliable; however, Trade Nation does not warrant its completeness or accuracy. All market prices and market data contained in or attached to this communication are indicative and subject to change without notice.

NAS100USD: SMT Divergence Hints at Potential ReversalGreetings Traders,
In today’s analysis of NAS100USD, although the current market structure reflects bearish institutional order flow, there are growing signs that a potential reversal may be forming.
Key Observations:
1. Smart Money Technique (SMT) Divergence:
We are currently observing SMT divergence—a strategy where the underlying asset (NAS100) is compared against its benchmark (US500). These indices typically maintain a 90–100% correlation. However, when this correlation breaks down, it often signals that a reversal may be imminent. In this case, while NAS100 continues to show bearish momentum, the divergence from US500 suggests the possibility of bullish interest building.
2. Institutional Support at the Rejection Block:
Further confluence for a potential reversal lies in the presence of a rejection block acting as a strong institutional support level. This is a zone where smart money previously defended price, and if confirmed, it could provide an optimal entry for long positions.
Trading Plan:
We will monitor the rejection block for confirmation of bullish intent before entering any trades. If confirmed, the idea is to target the buy-side liquidity residing in premium pricing zones.
Invalidation Level : This reversal idea will be invalidated if NAS500 breaks below its most recent swing low.
Stay alert for confirmation, and always ensure the idea fits within your broader trading framework.
Kind regards,
The Architect

US100 - Perfect Long Opportunities Unfolding?This chart illustrates a high-probability bullish setup based on a combination of market structure shifts, fair value gaps (FVGs), Fibonacci retracement confluence, and order block interaction. We are analyzing the US Tech 100 on the 1-hour timeframe, focusing on recent price action development and a potential reversal scenario forming after a corrective move.
Context and Market Structure:
Price action has been in a corrective downtrend after printing a local high near the 19,950–20,000 range. This move led to a break in short-term bullish structure as sell-side liquidity was swept. A series of bearish candles followed, confirming a shift in momentum to the downside.
However, the retracement stalled upon entering a prior area of imbalance—highlighted here as a larger fair value gap (FVG) zone. This FVG zone acted as a significant demand area, with price reacting strongly upon entry. The zone is marked with a light blue shaded rectangle and aligns with a 1-hour bullish order block.
Price created a swing low in this FVG area before forming higher lows, suggesting the possibility of a short-term reversal.
Golden Pocket & Liquidity Sweep:
A key zone of interest is the "Golden Pocket downtrend" area, which is derived from the 0.618–0.65 Fibonacci retracement levels of the last impulse down. Price previously respected this zone, leading to a rejection and continuation lower. This makes it a notable supply area. Price may revisit this zone as a target or potential reaction point on the next bullish leg.
Note how the initial reaction from the FVG brought the market back into a smaller 1H FVG, situated just beneath the 0.5 retracement level. The internal structure within this zone supports a bullish outlook due to the formation of a higher low followed by a bullish engulfing candle.
Fibonacci Confluence & Execution Levels:
The 0.618 Fibonacci retracement level of the recent move aligns closely with the midpoint of the bullish FVG, providing confluence for a potential re-entry or continuation point. This level is annotated on the chart and highlighted with a horizontal line labeled "0.618 - Entry." This suggests it may act as a magnet for price before further continuation to the upside.
The 0.786 retracement level, also plotted on the chart, indicates the deeper end of the retracement spectrum and lies just above a major structural low. This region, though aggressive, would represent a final line of defense for bullish continuation.
Projection and Price Path:
Based on the current structure and bullish reaction from the FVG zone, a potential price path is drawn on the chart. It suggests one more liquidity grab into the FVG area followed by an impulsive move to the upside.
The blue projection line outlines a potential retracement to fill the nearby FVG (which remains partially unmitigated), followed by a resumption of bullish momentum that targets a revisit to the previous high area around 19,875.
Additional Notes:
* Multiple FVGs are actively interacting in this region, giving layered confluence for demand zones.
* The reaction from the FVG zone is coupled with a bullish engulfing pattern on the 1-hour timeframe, signaling aggressive buying.
* Price remains above the internal bullish structure despite the earlier rejection from the Golden Pocket area.
Conclusion:
The chart setup represents a textbook example of FVG demand zone reaction, supported by Fibonacci confluence and market structure shifts. As price consolidates above this key FVG, a continuation to the upside becomes a strong probability if the internal structure remains intact. Traders should monitor price behavior on lower timeframes as it interacts with the 0.618 and FVG zones for confirmation of bullish continuation.
