US500 Will Go Lower! Sell!
Please, check our technical outlook for US500.
Time Frame: 4h
Current Trend: Bearish
Sentiment: Overbought (based on 7-period RSI)
Forecast: Bearish
The market is testing a major horizontal structure 4560.8.
Taking into consideration the structure & trend analysis, I believe that the market will reach 4532.7 level soon.
P.S
We determine oversold/overbought condition with RSI indicator.
When it drops below 30 - the market is considered to be oversold.
When it bounces above 70 - the market is considered to be overbought.
Like and subscribe and comment my ideas if you enjoy them!
Us500

US500 Technical Analysis! SELL!
My dear subscribers ,
US500 looks like it will make a good move, and here are the details:
The instrument tests an important psychological level 4560.9
Bias - Bearish
Technical Indicators: Supper Trend gives a precise Bearish signal, while Pivot Point HL predicts price changes and potential reversals in the market.
Target - 4531.5
Recommended Stop Loss - 4579.4
About Used Indicators:
For more efficient signals, super-trend is used in combination with other indicators like Pivot Points.
———————————
WISH YOU ALL LUCK

Dow Jones Index (US30) Technical Outlook Ahead of FED
US30 Index is currently trading on a key daily structure resistance.
The market is consolidating on 4H time frame,
forming a head and shoulders pattern.
If the price breaks and closes below its neckline (35330 level),
I will expect a bearish continuation, at least to a support line of an expanding wedge pattern.
Bearish breakout of the support of the wedge, will push the Index even lower.
Alternatively, a bullish breakout of the underlined blue structure on a daily will be a strong
bullish signal.
❤️Please, support my work with like, thank you!❤️

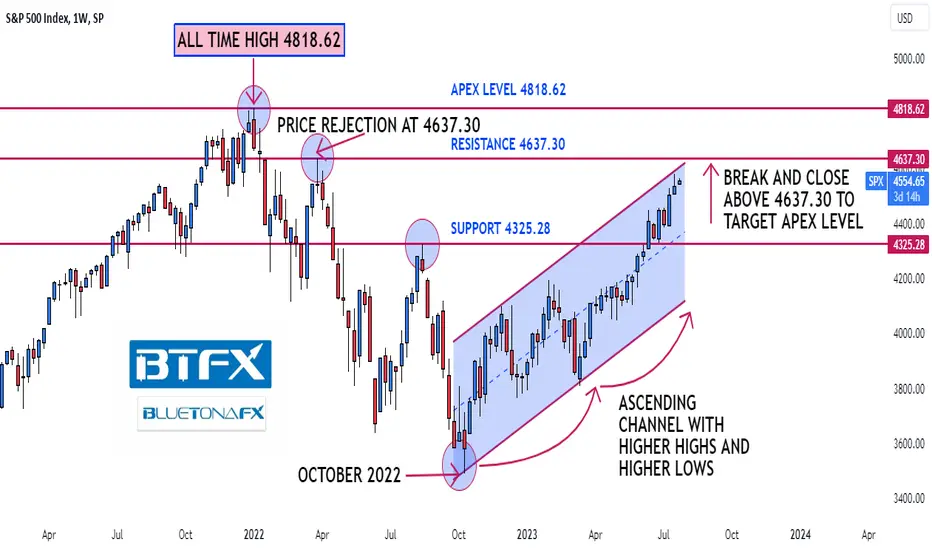
BluetonaFX - SPX Approaching All-Time HighHi Traders!
We are approaching the all-time high on the S&P 500, and traders are eagerly anticipating tomorrow's Federal Reserve interest rate decision along with the FOMC minutes meeting announcement.
Looking at the technical price action on the 1W chart, the market has been in a steady bull market since October 2022. We have drawn the ascending price channel on the chart for you to see.
Before the all-time high at 4818.62 (the apex level), there is a resistance level at 4637.30. This level is key because there was a price rejection at this level 16 months ago, and we have not been above it since then.
If we get a break and close above 4637.30, then the apex level at 4818.62 is the next target, and if that breaks, then we will be trading in record-breaking territory.
On the other side, if 4637.30 holds and there is not a break and close above this level, then the bull market we have had for the past 16 months may be coming to an end, and we may get a pullback to the long-term support level at 4325.28.
Please do not forget to like, comment, and follow, as your support greatly helps.
We appreciate your continued support!
BluetonaFX
US500 - Time for consolidation?Hi Traders,
we have a busy week ahead. We have 3 central bank interest rate decisions and a few other fundamentals coming up.
Week 30/2023
Monday: Purchasing managers' indices DE🇩🇪 , UK 🇬🇧and USA 🇺🇸
Tuesday: ifo business climate index🇩🇪, CB consumer confidence🇺🇸
Wednesday: FED interest rate decision🇺🇸
Thursday: ECB interest rate decision 🇪🇺
Friday: BOJ interest rate decision🇯🇵, CPI DE🇩🇪, PCE core rate 🇺🇸
Some Infos about the Central Banks
FED🇺🇸: The Fed is expected to raise rates by 25 basis points to between 5.25% and 5.50% at its July meeting, with traders looking for clues as to whether this will be the central bank's last rate hike of the cycle or whether it will deliver another rate hike at a future meeting that is in line with its own forecasts.
ECB🇪🇺: Again, a 25 basis point rate hike is a foregone conclusion. However, the wording will be crucial here. Because currently, a further increase in September is priced in by around 50% of market participants. The other 50% do not expect any further increase. Depending on which way the wording goes, there is definitely a lot of upside or downside potential for the euro.
BOJ🇯🇵: The Bank of Japan's interest rate and monetary policy is still expected to remain loose. This could be very exciting, especially after the last correction against the USD.
So we can expect at least on Thing... Volatility!
From Technical point of view a consolidation in the stock market would not be a surprise.
If the SP500 moves back to first Support Level this would be a possible zone for new long entry. But we should wait for the FED and their outlook.
Wish you a great Trading week!
Team tegasFX

S&P500 Another buy opportunity on its way to 4640.S&P500 is having a short pull back today after crossing over Resistance 1 (4515).
Despite the constant rise, it remains inside both the yellow 4 month Channel Up as well as the wider one from late last year.
This bullish wave draws similarities with May-June.
Trading Plan:
1. Buy on the current market price.
2. Sell if it crosses under the MA50 (1d).
Targets:
1. 4640 (Resistance 2 and top of both Channel Up patterns).
2. 4200 (projected course of the MA200 1d).
Tips:
1. The RSI (1d) is trading inside its own Channel Up. A break under it, could be an early sell signal to watch for the MA50 (1d).
Please like, follow and comment!!
Notes:
Past trading plan:

Buy STOCKS heavily and dump GOLD according to this ratio.It is not the first time we use the SPX/GOLD ratio (S&P500 to XAUUSD) for a macro analysis and certainly each time it manages to offer us different and very helpful insights. This time on the 1W time-frame, the ratio is consolidating these past 2 weeks but after having broken in late May - early June above the 2022 Lower Highs trend-line.
That alone is a strong bullish signal and a look in the past 10 years shows that this is a cyclical pattern that has already been formed twice. The SPX/GOLD ratio following its market peak, enters a Descending Triangle (which is during a time of risk crisis in the markets) where Gold starts to outperform the S&P500 (stocks), a natural move as the yellow metal is a safe haven.
Then as the Triangle's Support holds, the price breaks above the Lower Highs and starts the new Bull Phase. Exception is of course the March 2020 COVID crash, which is a Black Swan event and doesn't count as technical. If it wasn't for that, the price would continue breaking above the Lower Highs as the rest of the fractals. In addition, the 1D RSI breaking above its own Lower Highs trend-line, is a similar buy signal.
Currently, since the ratio is significantly above not just the Lower Highs trend-line (RSI as well) but also the 1W MA50 (blue trend-line), we can expect it to reach the 2.68 Resistance within 6 months.
Naturally, as the title says, this means for investors to buy stocks at the expense of holding Gold. This is translated that we are in a Bullish Phase (risk-on) where buying assets like stocks offer more return than Gold, which should be converted to riskier assets.
-------------------------------------------------------------------------------
** Please LIKE 👍, FOLLOW ✅, SHARE 🙌 and COMMENT ✍ if you enjoy this idea! Also share your ideas and charts in the comments section below! **
-------------------------------------------------------------------------------
💸💸💸💸💸💸
👇 👇 👇 👇 👇 👇

The SPX/DJI ratio points to a multi-year Bull ahead.This is a very informative analysis using the SPX/DJI ratio. In recent decades this has helped at identifying recession and expansion cycles. As this chart shows on the 1M time-frame, after each crash since 2000 and the Dot Com crash (Housing crash, China slowdown, Brexit, Oil Crsis, Trade War crash and the more recent Inflation Crisis), the ratio started to rise, meaning that the S&P500 started to outperform the heavily industrialized Dow Jones Index, which led to a new Bull Cycle.
Since the bottom of the Dot Com Crash, the ration has been trading within a 20 year Channel Up, which is limited by a Lower Highs trend-line. If broken we can start talking above a new mega expansion phase.
The 1M MACD just completed a Bullish Cross last month, suggesting that the current Bull Cycle may only be at its very beginning. Regardless of all that, we believe this is a very interesting ratio to follow and that has offered useful conclusions to you. We hope you enjoyed it!
-------------------------------------------------------------------------------
** Please LIKE 👍, FOLLOW ✅, SHARE 🙌 and COMMENT ✍ if you enjoy this idea! Also share your ideas and charts in the comments section below! **
-------------------------------------------------------------------------------
💸💸💸💸💸💸
👇 👇 👇 👇 👇 👇

SPX eyes $4,600. But can it make there?Yesterday, after the market close, International Business Machines, Netflix, and Tesla unveiled their earnings for the second quarter of 2023. Investors did not take this news positively, and shares of all three companies slumped in response. Today, in the pre-market, Netflix is down more than 8%, Tesla more than 4%, and IBM approximately 1%. More U.S. corporations are scheduled to report their earnings today, including Abbott Laboratories, Johnson & Johnson, and Philip Morris. In addition to that, today, we can anticipate crucial economic data, including updates on initial jobless claims and the Philadelphia FED Manufacturing Index. In regard to technical indicators, RSI traveled into the overbought territory on the daily chart while MACD and Stochastic continued to develop bullish structures. The price deviated too far from the 20-day SMA, which makes a case for a slight pullback before SPX continues higher. We will update our thoughts as the earnings season progresses further.
Illustration 1.01
Illustration 1.01 shows the daily chart of SPX and RSI. Yellow arrows indicate the first divergence between the price and RSI. Now, we will watch whether RSI can overtake its peak on 15th June 2023. If RSI crosses below 70 points, it will be bearish.
Technical analysis gauge
Daily time frame = Bullish
Weekly time frame = Bullish
*The gauge does not necessarily indicate where the market will head. Instead, it reflects the constellation of RSI, MACD, Stochastic, DM+-, ADX, and moving averages.
Please feel free to express your ideas and thoughts in the comment section.
DISCLAIMER: This analysis is not intended to encourage any buying or selling of any particular securities. Furthermore, it should not be a basis for taking any trade action by an individual investor. Therefore, your own due diligence is highly advised before entering a trade.

USA S&P 500 (US500) Index Analysis 05/01/2022Fundamental Analysis:
As we can see the Index has shown a very strong come back after the Covid-19 pandemic of March 2021 which caused the market to fall and create a panic to the world.
Since then there are lots of changes to the world and the way companies are operating, such as releasing of their premises and offices as they should have discharge lots of their employees and the work from home schemes was the main reason to cut the expenditure of these companies drastically down.
From the other hand, the market administration and governments including Banks has injected lots of funds and so called Rescue Packages and the market stimulant's packages to protect the Market from its Hard and Drastically fall to the lower levels and prevent a gigantic Global Markets Crises.
These funds and injection of the cash to these companies along side of cost deduction due to their risk measurement policies, forced these companies to invest the receiving funds in to the companies assets to protect themselves from the Pandemic Crises and hedged their exposed risks instead of investing these funds to the new Projects or renovations which could Couse their Share prices to appreciate intrinsically but instead these investments in the assets made an inflation to the prices of the assets and created a bobble in their share value and Prices without having any inheritance or intrinsic values.
so we can easily have a decision derived from the current situation that there has to be an other market fall and crises soon so the Price and its relevant intrinsic values get converged and market comes to its correct values.
we can observe the same situation in many different centralized markets such as Dow Jones and even other Stock Exchanges around the world like London and rest European market places to be in the same inflated status.
there exist a huge chance of an other Global Market Crises coming soon which has the domino effect and Couse the entire markets to fall for some times .
This fall of the market shall remove off the liquidity from the equity and debt market and streamflow them to some green heaven Asset classes including Gold and silver or even newly invented Technologies such as decentralized markets and Cryptocurrencies and DeFi.
if we have a look at the Current crypto's Total Crypto Market Capitalization we can see it has a very good chances of Rally Continuation to some very high levels such as 5 to 6 Trillion dollars or even much higher.
Gold even can see higher Prices such as 2500 USD per ounce which is currently ranging at 1800 USD.
we even can some how speculate a 3 world War to be the initiator of this Market fall which is even not so far from the reality as the situation in middle east is not very stable due to the Iran and Israel disputes and new anti-covid's restriction social movements in Europe and America continent.
we shall analyze few other markets and indices and ultimately Propose some Assets which are at their low Points Currently and can be counted as under values at present times.
Technical Analysis:
we have used the Fibonacci retracement and Expansion from the low to the Highest point before the Covid pandemic to have a better vision of the Higher expansion levels for the post retracement's rallies and identify the Potential Price levels and resistance zones. where the market can show some stagnation and starts its retracement and price correction to the lower levels.
There exist a Bearish Divergence of Price and MACD where Price has made higher high levels but MACD made lower Highs which is the most significant and strong Bullish Trend Reversal and start of Market fall and Price retracement and Value corrections.
there are total of 3 Targets defined which have a very strong Support tendencies which can be interpreted as the maximum retracements points.
there are few Resistance levels are also defined to have a better vision incase of Current Rally Continuation which eventually can be counted as the Trend reversal points

S&P500: Small pullback will provide the new buy entry.S&P500 reached the top of the four month Channel Up, remaining on heavily overbought technical indicators on the 1D timeframe (RSI = 75.225, MACD = 61.680, ADX = 45.310). As the 1D RSI is close to hitting the HH trendline that goes as back as November 2022, we expect a pullback, at least on the short term inside the Channel Up, first to drop the overbought indicators back to a balanced stated and secondly to form a HL on the Channel Up.
We are opening a sell on closing, aiming at a -2.60% (TP = 4,460) pull back which was the decline of the last correction. That will be a low risk buy opportunity (as long as the 1D MA50 holds) to target R1 (TP = 4,640).
If the candle closes under the 1D MA50 and S1, we will short and target the 1D MA200 on S3 (TP = 4,165), a potential correction that will neutralize finally the overbought 1D RSI.
Prior idea:
## If you like our free content follow our profile to get more daily ideas. ##
## Comments and likes are greatly appreciated. ##

SPECIFIC analyze for us500hello guys
it is late in my country and i should be sleep until now but prefer publish this lazy analyze i hope you enjoy
i think it is time for short position because of bearish trendline also i draw my forcastin that consider both important level, QML and FRESH FLAG
always do your own research.
If you have any questions, you can write it in comments below, and I will answer them.
And please don't forget to support this idea with your like and comment.
BE PROFITABLE

SPX 500 (ES) Bearish and Bullish OpportunitiesThis expectation is a framework to look for a potential trading setup; I don't just execute based on these levels, I always wait for confirmations on lower timeframes
This Analysis was done using my complete Strategy which includes:
- Smart Money Concepts
- Multi Timeframe Liquidity and Market Structure
- Supply And Demand
- Auction Theory
- Volume Analysis
- Footprint
- Market Profile
- Volume Profile
- WYCKOFF
- ETC

S&P500 Last push before a 10 day correctionS&P500 / US500 is trading inside multiple Channel Up patterns, the shortest of them started on June 08.
Based on the first bullish wave of this pattern, the current leg is on the last spike before a correction.
You may buy now and target 4560, before the next short term buy opportunity emerges again in around 10 days on the 4hour MA100.
Follow us, like the idea and leave a comment below!!

US500: Long Trading Opportunity
US500
- Classic bullish setup
- Our team expects growth
SUGGESTED TRADE:
Swing Trade
Buy US500
Entry - 4499.7
Stop - 4473.1
Take - 4539.8
Our Risk - 1%
❤️ Please, support our work with like & comment! ❤️

S&P500 Potential UpsidesHey Traders, in today's trading session we are monitoring US500 for a buying opportunity around 4440 zone, US500 is trading in an uptrend and currently is in a correction phase in which it is approaching the trend at 4440 support and resistance zone.
Trade safe, Joe.

A trader’s playbook: can a USD in motion remain in motion?It was a huge week for USD traders and the USD remains the central focus of clients and wider market participants this week. US data is lighter on the ground and with the Fed in its blackout period, we are in cruise control into next week’s FOMC meeting, where a 25bp hike is an almost done deal.
Will this hike prove to be the last in the cycle?
The market is certainly feeling higher conviction that US inflation is trending in the right direction, and the moves in forward interest rates markets, to revisit price cuts in 2024, were the key reasoning why the USD has been so heavily sold. We can look at the SOFR interest rate market and see on Thursday that an aggressive -160bp of cuts were priced for 2024, although this has come back on Friday closing at -148bp. The USD and gold are moving closely to these expectations and the degree of easing from the Fed from March 2024.
The FX market is front running possible normalisation of Fed policy in 2024, and this is lifting risky assets and high beta FX (NOK and SEK especially). The question then is whether the USD sell-off has gone too far and we are at risk of mean reversion early this week – the upside in the USD will likely see equity markets finding better sellers, which all saw big gains last week.
US and Asia corporate earnings roll in this week, with SAP also getting a focus for GER40 traders, and in a quiet data week earnings may play an influence. There is also a focus on the special rebalance of the NASDAQ, which aims to reduce concentration risks (www.axios.com)
We start the week on a quiet tone with Japan offline for Marine Day and the potential for HK markets to close as tropical storm Talim is upgraded to a no. 8 typhoon signal.
As the week rolls on though one of the key topics of conversation is whether the BoJ alter its YCC policy at the BoJ meeting on 28 July – recent press suggests moving the 10yr JGB (Japan govt bond) cap (currently set at -/+0.50%) set by its YCC program is a real possibility. Should they move it to 0.75% or even 1% it could have big implications for the JGB market and by extension the JPY.
We’re coming off a big week for the US rates market and the USD is moving very closely in alignment to this pricing – the market sees the Fed cutting before other DM central banks and by a greater degree. This is something the market is very keen to explore and could have far-reaching implications for the USD into Q3 and certainly Q423.
Rearview alpha plays - what worked best last week:
• G10 and EM FX play of last week: Short USDSEK (-5.4% WoW), short USDHUF (-4.9% WoW)
• Equity index plays - long FRA40 (+3.6% WoW), long AUS200 (+3.4% WoW), long NAS100 (+3.4% WoW)
• Commodity plays – Long Copper (+3.9% WoW), Long XAGUSD (+8% WoW)
• Equity plays for the radar – Tesla (report earnings after market Wednesday) – the implied move (on the day of earnings) is 3.5%. The stock is looking for direction with the bias defined by a break of $284.25 or $265.10. Netflix report earnings at 6 am AEST on Thursday, with the market seeing an implied move of 4%.
• Crypto plays: Long XRP (+53.4% WoW)
Marquee event risk for the week ahead:
• US 2Q earnings – in the week ahead we receive earnings from 11% of the S&P500 market cap. Trader favourites include Bank of America, IBM, Morgan Stanley, Goldman Sachs, Netflix, Tesla, and AMEX.
• For GER40 traders, do consider that SAP SE report Q2 23 earnings on 21 July (aftermarket) – SAP holds a 9.4% weighting on the GER40, making it the biggest index weight, and therefore any outsized moves in SAP could influence the index - Can we see SAP break above E130 and to the highest levels since Oct 2020?
• UK CPI inflation (Wed 16:00 AEST) – The market expects UK core CPI to remain at 7.1%, while headline inflation is expected to fall to 8.2% (from 8.7%). The last 4 UK core CPI prints have come in well above expectations. With the market pricing 45bp of hikes from the BoE at the 3 Aug meeting, we’d need to see a huge downside surprise (in core CPI) to lower expectations that the BoE will hike by a further 50bp.
• Australia (June) employment report- (Thurs 11:30 AEST) – the median expectation is that 15k net jobs were created in June, with the unemployment rate remaining at 3.6%. While we look ahead at next week’s Aus Q2 CPI, the jobs report could influence expectations of RBA action on 1 August, which is priced at a 36% chance of a 25bp hike.
• Japan CPI inflation – the market sees JP headline inflation rising to 3.3% (from 3.2%), while core is eyed at 4.2% (4.3%) – with the market debating whether the BoJ alters its Yield Curve Control (YCC) program at the 28 July BoJ meeting, this data could influence that debate and potentially result in further pronounced moves in the JPY.
• China Q2 GDP (Mon 12:00 AEST) – expectations are for a rebound in GDP to 7.1% YoY (from 4.5% YoY). At the same time, we also get China’s industrial production (consensus at 2.5%), retail sales (3.3%) and fixed asset investment (3.4% YoY). Watch price action in CHINAH, copper, USDCNH and the AUD over this data.
• US retail sales (Tue 22:30 AEST) – it’s a quiet week for US economic data with US retail sales and various housing data points among the highlights – the market eyes 0.5% MoM retail sales growth.
• EU CPI (Wed 19:00 AEST) – the central case is for core inflation to remain at 5.4%, while headline CPI is expected to fall to 5.5% (from 6.1%). A 25bp hike at the next ECB meeting is a near certainty, but a lower inflation print may see longer-term expectations fall.
• Canada CPI inflation (Tues 22:30 AEST) – the market sees headline CPI at 3% (from 3.4%), and the core median at 3.7% (3.9%). The next BoC meeting isn’t until 6 September, so this CPI print may fail to move the CAD too intently.
• NZ CPI inflation (Wed 08:45 AEST) – The market sees NZ inflation running at 5.9% YoY (from 6.7%), and 0.9% QoQ – One for the NZD traders, but unless we get a blowout number the RBNZ should hold rates steady at the next meeting on 16 Aug.
• South Africa central bank (SARB) meeting (Thurs - no set time) – One for those running USDZAR exposures, but the prospect of a 25bp hike to 8.5% seems likely.
• Turkey central bank (CBT) meeting (Thurs 21:30 AEST) – the market expects the CBT to hike the one-week repo rate to 18.25% (from 15%) – eyes on your USDTRY exposures.
Fed speakers – With the Fed entering its blackout period, we see no Fed speakers until the FOMC next week.
ECB speakers – Lagarde, Lane, Vasle, Elderson, Vujcic, Villeroy
BoE speakers – Ramsden
RBA speakers – no individual speakers – RBA July meeting minutes (Tues 11:30 AEST)

SP500 Black Swan Event Incoming!Following on from our alternative account which has now become our primary count we have cleaned up the chart and think we are very close to the top of this B wave, as retail traders and the media are turning bullish on the stock markets we think it's a matter of time before the rug is swept out from under the bulls feet and we come crashing down to our target of 3200. A 1300 point move from current prices! What could spark such a sharp move? China invading Taiwan? Inflation staying stickier than analysts expect? Moving into a negative growth environment? There are plenty of things that could spark this move, what it will be is anyones guess. All we know is if our analysis is correct this move will be very sharp and catch a lot of people off guard.

US100 and US500 Possible Counter Trend Trade OpportunityIn this video, we examine the stock indices and observe that they are approaching key resistance levels on the higher time frames (1M, 1W, 1D etc). We can observe weakness in the GE40 and FTSE, raising the question of whether the US100 and US500 will follow suit. Considering it's the end of the week, a correction is a possibility. As always, please note that everything discussed in the video is for informational purposes only and should not be interpreted as financial advice.

Earnings season beginsMany of you know that we have been skeptical about the rally in the stock market over the past year. In fact, we called it a bear market rally and touted a decline toward $3,400 once it ran out of steam. Our thesis for this thinking was that unemployment would start picking up, corporate earnings would decline, and interest rates would lead to cracks in the economy. While we began to see cracks in the banking sector at the end of 1Q23, we did not see much follow-through with the rising unemployment and falling corporate profits. After the FED pumped liquidity into the market as a response to the regional bank crisis, we noted that these developments would likely get postponed further into the future.
Now, with another earnings season looming over us, we can finally get more insight into what is going on in the underlying economy. If there is an improvement in earnings and future outlook, it will increase the odds of a shallow recession, likely proving our thesis about a heavy correction toward $3,400 wrong (especially if the market continues higher from the current level). As a result, we will pay close attention to the banking sector, which is reporting its earnings first. Among some of the important subjects of our interest will be credit issuance, delinquencies on debt, and deposits.
Regarding most recent developments, SPX broke above the resistance near $4,456 yesterday, which is bullish. If SPX breaks above $4,500, it will further bolster the bullish case in the short-term. The same applies to the rising RSI if it breaks above 70 points. In such a scenario, we would expect SPX to rise somewhere between $4,550 and $4,600.
Illustration 1.01
Illustration 1.01 displays the daily chart of SPX and simple support/resistance levels.
Technical analysis gauge
Daily time frame = Bullish (with RSI and MACD showing divergence with the price)
Weekly time frame = Bullish
*The gauge does not necessarily indicate where the market will head. Instead, it reflects the constellation of RSI, MACD, Stochastic, DM+-, ADX, and moving averages.
Please feel free to express your ideas and thoughts in the comment section.
DISCLAIMER: This analysis is not intended to encourage any buying or selling of any particular securities. Furthermore, it should not be a basis for taking any trade action by an individual investor. Therefore, your own due diligence is highly advised before entering a trade.

S&P500: Targeting 4,570 but may take a while.S&P500 made a new yearly High today after the U.S. CPI report and solidified the 1D bullish technicals (RSI = 66.131, MACD = 48.400, ADX = 25.681). The MACD indicator if it makes a bearish cross, it will form a similar pattern to the start of May where it turned the index into a 2 week consolidation before making a new High.
We will wait for a pullback near the 1D MA100 before buying or will make a breakout buy if the price crosses over the R1. In either occassion, we will target near the top of the four month Channel Up (TP = 4,570).
Prior idea:
## If you like our free content follow our profile to get more daily ideas. ##
## Comments and likes are greatly appreciated. ##

Double-top on SPX?The previous week was filled with numerous data disclosures that provided deeper insights into the U.S. economy. Most notably, we saw the first month-over-month decline of the S&P Global Services PMI in 2023 (negatively affecting the S&P Global Composite PMI), a continuation of contraction in the manufacturing sector, and a slight decrease in the unemployment rate (from 3.7% in May 2023 to 3.6% in June 2023). Overall, the data has not proved recessionary yet. But with services slowing down, it would be appropriate to stay cautious and wait for more data to reveal underlying trends in the economy.
In our opinion, the current valuations for stocks seem overstretched (especially in the tech sector), and the replacement of fear and calls for a recession by the narrative dismissive of any danger to the U.S. economy could lead to a volatile concoction in the stock market. As a result, we are monitoring multiple technical indicators on a daily time frame, including RSI, MACD, and Stochastic. All three of these indicators show divergence with the price and point to the downside, which is not particularly bullish. In addition to that, SPX appears to be forming a double top, giving rise to an interesting setup if the pattern becomes valid.
Illustration 1.01
The picture above shows the mentioned setup. The bearish trigger becomes activated once the price breaks below Support 1.
Illustration 1.02
Illustration 1.02 shows nearly the perfect harmony between the decline from January 2022 until October 2022 and the rise from October 2022 until July 2022.
Technical analysis gauge
Daily time frame = Bullish (with signs of weakness)
Weekly time frame = Bullish
*The gauge does not necessarily indicate where the market will head. Instead, it reflects the constellation of RSI, MACD, Stochastic, DM+-, ADX, and moving averages.
Please feel free to express your ideas and thoughts in the comment section.
DISCLAIMER: This analysis is not intended to encourage any buying or selling of any particular securities. Furthermore, it should not be a basis for taking any trade action by an individual investor. Therefore, your own due diligence is highly advised before entering a trade.

SP-500 update 14.06.2023SP500
We have one downward channel that we broke and went up and formed a new upward channel.
We are near the resistance line of this channel, we also have a liquidity zone (red box), which we have partially collected, I would expect that we can collect more liquidity up to 4465 and after that I expect a corrective move down to the first target 4100.
The same picture we see in horizontal volumes
RSI on D1 is overbought
Best regards EXCAVO
