S&P500 - Long active ✅Hello traders!
‼️ This is my perspective on US500.
Technical analysis: Here we are in a bullish market structure from 1H timeframe perspective, so I am looking for longs. I expect bullish price action from here as we can see that price filled perfectly the imbalance and rejected from bullish order block.
Like, comment and subscribe to be in touch with my content!
Us500

Daily Market Analysis - WEDNESDAY JUNE 21, 2023As US stocks decline, the market retreats while investors eagerly await Powell's testimony.
Key events:
UK - CPI (YoY) (May)
USA - Fed Chair Powell Testifies
The trading session on Tuesday witnessed a decline in US stocks, marking a shift from the previous sustained rally as investors opted to secure their profits. This decision was influenced by concerns over weakening global demand, which contributed to a cautious sentiment prevailing at the beginning of the holiday-shortened week.
One of the key events that investors are eagerly anticipating is Federal Reserve Chairman Jerome Powell's scheduled testimony before Congress on Wednesday. The outcome of this testimony has the potential to significantly impact market dynamics and serve as a major catalyst for market movement.
All three major US equity indices concluded the session with negative results, although they did manage to recover slightly from the lows reached earlier in the day. Notably, the decline was influenced by the performance of oil super-majors such as Exxon Mobil Corp and Chevron Corp, which exerted downward pressure on both the S&P 500 and the Dow.
The broader sell-off that occurred follows the Nasdaq's impressive winning streak, which had been the longest since March 2019, and the S&P 500's longest winning streak since November 2021.
Despite the setback experienced on Tuesday, it is important to note that the benchmark S&P 500 has still achieved a notable gain of 14.3% year-to-date. This highlights the overall positive performance of the market thus far in the year, even with the temporary downturn observed in the recent trading session.
S&P 500 daily chart
Federal Reserve Chair Jerome Powell's upcoming congressional testimony presents a platform for him to expand on the discussions surrounding monetary policy that took place during the recent Fed meeting. However, given the relatively short timeframe between these two events, it is improbable that Powell will introduce substantial new insights during this testimony. It is important to note that the Federal Reserve follows a data-dependent approach, making decisions on a meeting-by-meeting basis. Therefore, their next decision, slated for July 26, will likely be influenced by a range of factors, including the release of the Consumer Price Index (CPI) on July 12 and the employment report on July 7. These upcoming economic indicators will play a significant role in shaping the Fed's decisions regarding monetary policy moving forward.
GBP/USD daily chart
The GBP/USD currency pair witnessed a substantial surge of 60 pips, propelling it above the key level of 1.2800. However, the pair later retraced to 1.2760. This price movement unfolded as market participants engaged in reassessment of the UK inflation data ahead of the London open on Wednesday.
In May, the Consumer Price Index (CPI) in the UK surpassed market expectations by reaching a year-on-year figure of 8.7%, surpassing the anticipated 8.4%. This strong inflationary reading garnered attention and influenced the initial upward momentum in the GBP/USD pair.
On the other hand, the Core CPI, which factors out the impact of volatile food and energy prices, aligned with analysts' predictions. It indicated a more modest inflation increase of 6.8% year-on-year, in line with market forecasts.
The contrasting figures between the headline CPI and Core CPI may have contributed to the subsequent retreat in the GBP/USD pair, as market participants carefully considered the implications of these inflation data points. Such evaluations and reevaluations are common as traders and investors digest the latest economic indicators to adjust their positions in the market.
As the trading session progresses, market participants will continue to monitor developments and additional economic data releases to gauge the potential impact on the GBP/USD currency pair.
UK CPI
The GBP/USD buyers are currently facing challenges as the US Dollar continues to exhibit strength, extending its upward trend for the fourth consecutive day, despite recent lack of significant action. This poses a hurdle to the bullish outlook on the GBP/USD pair, even with the positive UK inflation data that supports the Bank of England (BoE) hawks.
At the same time, the US Dollar Index (DXY) remains relatively stable around the 102.60 level, maintaining its four-day uptrend without displaying a strong inclination to advance further. The recent resilience of the US Dollar can be attributed to the hawkish remarks made by Federal Reserve policymakers, particularly the nominees, as well as robust housing data from the United States. Additionally, concerns regarding geopolitical tensions between the US and China are weighing on market sentiment, further bolstering the safe-haven appeal of the US Dollar.
In light of these factors, the GBP/USD buyers are encountering resistance in their efforts to drive the pair higher. The prevailing strength of the US Dollar, supported by hawkish comments and positive economic data, poses a challenge to the bullish sentiment on the GBP/USD pair. Traders and investors will closely monitor further developments, including central bank communications and geopolitical developments, to assess the potential impact on the GBP/USD pair moving forward.
US Dollar Currency Index
Furthermore, during the course of the night, the Australian dollar experienced notable and noteworthy fluctuations, which consequently led to a substantial decrease in the AUD/USD exchange rate, edging closer to the critical level of 0.6800. The downward trajectory of the Australian dollar was triggered by the release of the minutes from the Reserve Bank of Australia's (RBA) most recent policy meeting held on June 6th. To the surprise of market participants, the RBA opted to implement an additional 25 basis points hike, thereby elevating the policy rate to 4.10%. This updated guidance on the likelihood of future rate hikes was specifically aimed at attaining the desired inflation target.
AUD/USD daily chart
Nevertheless, the recently disseminated minutes of the meeting have given rise to an array of uncertainties with respect to the Reserve Bank of Australia's (RBA) forthcoming stance on augmenting interest rates. Within the aforementioned minutes, it was brought to light that the RBA extensively deliberated on the prospect of temporarily halting any rate increases during their most recent policy meeting. However, after careful consideration, the RBA concluded that the arguments presented were intricately poised, yet slightly inclined towards implementing a rate hike.

S&P500 On the 4hour MA50. Sell if this breaks.S&P500 / US500 almost touched today the 4hour MA50 for the first time since June 1st.
This is a Support and as long as it holds (along with the Channel Up), buy and target Resistance A at 4500.
If the price crosses under the Channel Up, sell and target the 1day MA50 at 4235.
If the 4hour RSI makes a Bullish Cross before 4235 gets hit, then book the profit on the short earlier and switch to buying again.
Previous chart:
Follow us, like the idea and leave a comment below!!

US equity traders playbook – all-time highs or a 10% drawdown?The pain trade in US equity markets remains to the upside, and with the US500 only 9% from the all-time highs, if we are to get test 4800 it will be because the bears fully capitulate.
That is certainly a possibility, especially if the market strongly believes the Fed pause again in the July FOMC meeting. Subsequently, if the S&P500 breaks 4450/4500, it will be call options buyers and momentum (some FOMO) players that lead us further higher, as funds aggressively chase the market higher.
We can scratch around for positive catalysts, and there are many we can point to; volatility remaining low, a mountain of cash still on the sidelines, the Fed potentially at peak rates, and China ramping up stimulus. However, the list of upside catalysts seems scarce relative to the list of tier 1 triggers that could feasibly lead to a 10% move lower.
As we’ve learnt throughout 2022, an open mind will always serve you well, and a momentum-driven market is one not worth fighting, and positioning and flow mean everything.
A checklist to assess the risk-to-reward trade-off
When assessing the risk-to-reward trade-off, we can go into huge depth drawing up a varied checklist that can often lead to significant complications. These will include any or all, of the following:
Liquidity, positioning, valuation, sentiment, technical indicators, options hedging activity, gamma exposure and breadth.
They can all have a place in our understanding of where the skew of risk sits – price is, however, always the arbiter of truth.
We can be early to a trade, but we must be able to handle drawdown, and in all cases, just knowing when to take a loss is key. Timing the market is key when trading with leverage, but so is knowing how to take a loss.
At this juncture, positioning in US equity futures is rich, especially when we see the net long position of the highly influential CTAs (trend-following funds) and volatility-dynamic funds.
We can see the market has cut portfolio hedges dramatically, with S&P 1-month ‘skew’ at the lowest levels since 2018 and the CBoE equity put/call ratio at 0.46x – the lowest since April 2022. Hedges cost money in a bull market. But when volatility ramps up, aggressive re-hedging can send risk lower.
Valuation is rich, with the S&P500 trading on 20.2x forward earnings, and the Equity Risk Premium (ERP) at the lowest since 2002. This shows how little compensation investors get for taking on equity risk, so again this reduces the attractiveness of equity.
Sentiment is near extremes – one can look at the CNN Fear and Greed index and see this moving to 79 – extreme levels, but again, one wouldn’t take a short position in the US500 or NAS100 on extreme sentiment in isolation, but it is a big consideration.
Central bank balance sheets about to turn sharply lower
Perhaps the biggest factor the bears have at the centre of their thesis is the expected turn lower in liquidity, and specifically an impending decline in the major central bank's balance sheets.
The US is at the heart of this concern, where we know the Fed’s FWB:95B per month QT (Quantitative Tightening) is coming in late June. At the same time, the US Treasury’s massive net T-bill issuance to rebuild its depleted cash levels is about to ramp up. So far, the USTs bill issuance has been funded by capital from the Fed’s RRP facility, which is seen as a positive for US equity markets. However, the risk is now skewed that the TGA rebuild is to be funded by bank reserves - where falling reserves would be seen as a liquidity drain.
EU banks are due to repay E470B in TLTRO loans at the end of June, and with QT playing out in Europe and the UK, the prospect of the aggregated global central bank balance sheets about to turn lower is a major risk - with well over $1t of liquidity due to come out of the market in the coming weeks.
China is also a growing consideration, and we watch the price action in the HK50, CHINAH and USDCNH. China has started to ramp up its policy easing and support and has been increasing liquidity - but it has been underwhelming. Recall, Shanghai came out of lockdown in June, so the Chinese reopening data impulse is about to face serious headwinds – will the PBoC and govt be able to put the right mix in place to counter this weakness?
Core inflation is an ongoing concern
Another key risk markets are focused on is inflation. Central banks have made it clear their concern lies in targeting core (sticky) inflation and they are incredibly worried that inflation has become entrenched. We can look at the UK, NZ and Australia and see rising risks that the central banks may have to keep lifting rates and actually cause a recession to bring core inflation down to target. If we see core inflation readings stay firm, then this will be a big headwind for equity markets.
An inflexion point
The bottom line is we may be at a clear inflexion point for equity markets – either the central bank balance sheet rolls off and heads sharply lower in the coming weeks, and equity reacts with the US500 falling 5-10%, as per the bear's thesis. Or, prices remain firm despite the central bank balance sheet contraction. In which case, rising prices may see a capitulation from the bears, resulting in new highs playing out as momentum kicks in once more and funds chase into Q3.
Which way do you see it playing out?

S&P500: 1D RSI hit the 7 month Resistance. Sell signal.The S&P500 is trading inside a Channel Up since the March 13th low with 1D technicals heavily overbought (RSI = 72.465, MACD = 71.880, ADX = 42.303). That is a first bearish flag, with the second alert coming from the 1D RSI which hit on Thursday the HH trendline that started back in November. That is a major sell signal, calling for a pull back near the 1D MA50 (TP = 4,270). If the candle closes under S1, we will extend selling to S1 (TP = 4,105). If not, we will buy the first pull back and target the R1 (TP = 4,500).
Prior idea:
## If you like our free content follow our profile to get more daily ideas. ##
## Comments and likes are greatly appreciated. ##

Nasdaq100 Big Picture Short Monthly ResistanceNasdaq100 Big Picture Short Monthly Resistance:
First, there is now big and strong Resistance and I expect the price imminently to drop under 14,500, if you look at the highs of months 2-3-4 of 2022, we are there now + the trend line of the 2 must-high prices at top.
Second, the price structure of the last Rally that we see now should make a down movement now according to the history of this symbol and how he acts.
Even if he gonna do a new high first and from here a down movement should come.
Also dont forget the Fed says that by the end of the year, he expected a recession.
There are few options to out in a profit, see photo.
the less risky one is to close 90% on take profit 1 and move stop loss to zero.

Here Are Your Key Items to Watch Through Next WeekTraders,
I am not worried yet. In fact, if anything, I have become more bullish. But there are some key items we have to watch on these charts tomorrow, through the weekend, and into next. I'm going to show you what they are.
Stew
-----
Content
-----
00:10 - Intro
01:15 - Bitcoin Chart
03:00 - The Dollar
04:27 - The VIX
04:40 - US500
08:15 - Bitcoin
10:50 - Bitcoin Futures
11:00 - Back to BTC Daily

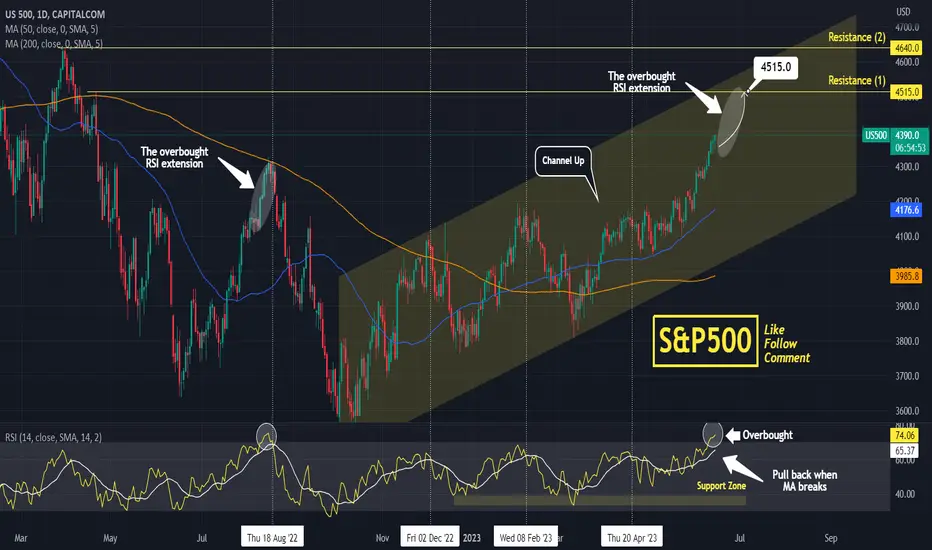
S&P500 RSI overbought but can give one last pushThe S&P500 is extending the rally inside the long term Channel Up.
The MA50 (1d) has been supporting and is untested since March 30th.
Such a strong rally undeniably created an overbought RSI (1d).
Last time the index gave a similar RSI pattern (August 10th 2022), the price gave a few more days of upside and one last push before a correction.
Trading Plan:
1. Buy on the current market price and as long as the RSI (1d) remains above its MA level.
Targets:
1. 4515 (Resistance 1 and April 21st 2022 top, near the top of the long term Channel Up).
Tips:
1. The RSI (1d) technically gives a signal that the uptrend is coming to a stop and a correction is starting, when it crosses under its MA level. Use this to your advantage in order to book the profit earlier if needed.
Please like, follow and comment!!
Notes:
Past trading plan:
Big Short On US500According to the update of us30 analysis that we provided, this analysis is also completely logical and practical for us500
First , it may go up with more pressure and start to collapse in the big drop zone .

Climbing a wall of worryAfter breaking above the resistance near $4,200, SPX continued to grind higher for nearly two weeks. Currently, it trades close to the $4,350 price tag. Despite tomorrow’s Federal Open Market Committee (FOMC) meeting, the market is exceptionally complacent. That is reflected in the low value of the VIX that returned to levels unseen since February 2020. Technicals like MACD and RSI continue to support the rally on the daily time frame, with RSI being just slightly away from breaking above 70 points; if RSI manages to break above this level, it will be very bullish for the short term. We expect this occurrence to be accompanied by a test of resistance at $4,400. However, if RSI fails to perform a crossover and MACD starts to flatten, it will raise our suspicion about the potential trend reversal. In addition to that, we are paying close attention to the support near $4,325. If the price drops below this level, it will be slightly bearish.
As for tomorrow’s FOMC meeting, general expectations are that the Federal Reserve will pause a hiking cycle and wait for more economic data to determine a further path for the monetary policy. That is because of the lagging effect of interest rates, which still have not hit the economy at full power. This decision might be viewed as an initial phase of pivoting and could act as another catalyst for the rally in the short term. The same positive effect can have today’s release of inflation data if it comes in cooler than expected. Overall, we think the short-term direction continues to favor bulls. In defiance of that, our view beyond the short-term/medium-term remains still inclined toward the notion that the U.S. economy is likely headed for a recession in the second half of 2023.
Illustration 1.01
Illustration 1.01 shows the daily chart of the VIX index. Interestingly, despite SPX hitting new 52-week highs, the volatility index rose in the past two trading sessions.
Illustration 1.02
Illustration 1.02 portrays the daily chart of RSI.
Technical analysis gauge
Daily time frame = Bullish
Weekly time frame = Slightly bullish
*The gauge does not necessarily indicate where the market will head. Instead, it reflects the constellation of RSI, MACD, Stochastic, DM+-, ADX, and moving averages.
Please feel free to express your ideas and thoughts in the comment section.
DISCLAIMER: This analysis is not intended to encourage any buying or selling of any particular securities. Furthermore, it should not be a basis for taking any trade action by an individual investor. Therefore, your own due diligence is highly advised before entering a trade.

US500: Short Trade Explained
US500
- Classic bearish setup
- Our team expects retracement
SUGGESTED TRADE:
Swing Trade
Sell US500
Entry - 4370.9
Stop - 4411.3
Take - 4310.2
Our Risk - 1%
Start protection of your profits from higher levels.
❤️ Please, support our work with like & comment! ❤️

Charts Show Market Expects Fed to Pause but Big Resistance AheadTraders,
Over 90% of the market is currently pricing in a FED rate pause tomorrow, but beware, the market often moves towards the point of maximum pain. My charts are showing we are at a critical point of resistance as I type this post. The bulls are going to have to conquer 4,370 and confirm it on the daily to convince me that the they are not out of steam just yet. From my perspective and the way I am reading this chart, is that the market may be in for a bit of a surprise pullback here. The blow-off top that I predicted well over a year ago is still currently underway and, IMO, will continue. But the market never goes to any future price point in a straight line. We are due for a pullback. I am not saying this will occur. I am only suggesting that a bit of caution is still very much warranted for the remainder of this week.
Here's a look at a schedule of significant events that have or will yet occur and may cause volatility:
Tuesday:
• US CPI Data
• Hinman Docs Become Public
• SEC's Coinbase Rulemaking Response
• Binance US Hearing
Wednesday:
• US PPI Data
• FOMC Meeting
Thursday:
• US Jobless Claims
• US Retail Sales Data
Take care,
Stew

S&P500 extending the Channel Up to 4390.The S&P500 index / US500 is extending the uptrend after crossing today over the 4330 Resistance of August 16th 2022.
The May Channel Up pattern may be transitioning to a more aggressive June Channel Up pattern supported by the 4hour MA50.
Our long term target is still a +8.90% rise from the last bottom on March 13th but are slightly downgrading it to 4390.
The 4hour RSI is also inside a Channel Up, with the current rise being similar to May 24th/28th.
Previous chart:
Follow us, like the idea and leave a comment below!!

S&P500: Closing over 4,330 can extend this relentless rally.The S&P500 index broke over Channel Up 1, which was the primary pattern since November 3rd 2022, and is only a few point away before testing R1 (4,330) for the first time since August 16th. The 1D technicals are on excellent bullish levels (RSI = 66.947, MACD = 39.580, ADX = 22.834) and a candle close over R1, can be enough to extend this relentless rally of the last 3 months. We will take the breakout and aim at R2 (TP = 4,500).
If rejected on R1 though, we will sell on the short term and buy near the 1D MA50 again (same bullish target). A closing under the 1D MA50, will be a sell trigger and we will target the S1 (TP = 4,045).
Prior idea:
## If you like our free content follow our profile to get more daily ideas. ##
## Comments and likes are greatly appreciated. ##

ES1! SPX500USD 2023 JUNE 12 WEEKES1! SPX500USD 2023 JUNE 12 WEEK
Price broke 4303. If this becomes support,
next target level will likely be 4584.
Scenario Planning:
1) Long on support at 4303
2) If false break, short on rejection at recent high / lower
high.
Note:
Longer Term: 4150 need to hold as support in order for
long trend to remain intact.
Volume Analysis:
Weekly: Ave vol up bar close off high = NTC weakness
Daily: Low(er) vol up bar S>D close off high = NTC weakness
*NTC = Non Trend Changing
Price reaction levels:
Short = Test and Reject | Long = Test and Accept
4584-4525 4303 4150
Remember to like and follow if you find this useful.
Have a profitable trading week.
*For educational purpose only.

US500 11June2023S&P500 is going according to the analysis of a few weeks ago. it is likely that it is currently in the period of wave 5, there is no visible weakening of the trend in the short term.
