S&P500: Bottomed on an Inverse Head and Shoulders.The S&P500 index is bearish on its 1D technical outlook (RSI = 36.973, MACD = -126.240, ADX = 31.007) but long term appears to have bottomed on an Inverse Head and Shoulders pattern. In fact, the Head made a low on the Double Bottom and the bearish outlook is currently due to the Right Shoulder formation. A crossing over the dashed LH trendline and even better the 4H MA200, would aim for the 2.0 Fibonacci extension (TP = 6,280).
## If you like our free content follow our profile to get more daily ideas. ##
## Comments and likes are greatly appreciated. ##
Us500

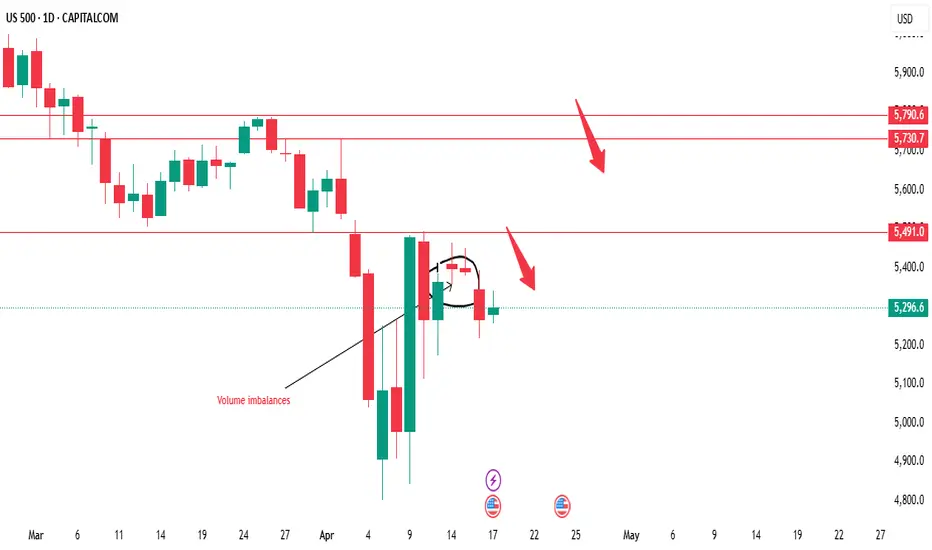
US500's performance this week will be crucial in determiningUS500 Weekly Analysis
The US500 index is currently exhibiting bearish tendencies, but a crucial level to monitor is $5491. This level has the potential to act as a resistance point, and we're looking for a possible selling opportunity around this area. However, if the market breaks above $5491, it could signal a shift in bias towards bullish territory, potentially leading to a significant upward move.
Key Levels to Watch:
1. Sell Zone: $5491 - This level is critical in determining the next move. We'll be watching for confirmation to sell, such as bearish candlestick patterns or trend indicators.
2. Resistance Area: $5730 - $5790 - A strong resistance zone that could potentially cap upward movements.
Trading Strategy:
1. Wait for Confirmation: We'll wait for the market to reach the $5491 level and look for confirmation to sell. This could include bearish candlestick patterns, trend indicators, or other technical signals.
2. Breakout Scenario: If the market breaks above $5491, we'll reassess the bullish potential and look for opportunities to buy.
3. Risk Management: It's essential to manage risk effectively, setting stop-losses and take-profits according to our trading plan.
Market Outlook:
The US500's performance this week will be crucial in determining the next direction. We'll be monitoring the market closely, analyzing price action, and providing updates on any developments. Stay tuned for our analysis and guidance on potential trading opportunities.
By keeping a close eye on these key levels and waiting for confirmation, we can make more informed trading decisions and navigate the markets effectively.
US500 BULLISH SYMMETRICAL TRIANGLEhi
Fundamental view
The **US500 index** dropped due to several key factors affecting the U.S. stock market:
📉 **Tech Stock Decline** – Technology stocks faced heavy pressure, especially after **Nvidia** plunged **6.9%** due to U.S. restrictions on AI chip exports to China. Other stocks like **AMD (-7.3%)** and **Micron Technology (-2.4%)** also fell.
💰 **Federal Reserve Uncertainty** – Remarks from **Fed Chair Jerome Powell** raised concerns in the market. Powell warned that new tariffs could trigger higher inflation and slow economic growth, making investors uncertain about interest rate policies.
🛍️ **Surge in Retail Sales** – Retail sales jumped **1.4%** in March as consumers rushed to buy before new tariffs took effect. This highlights economic uncertainty, pushing investors to sell their stocks.
Overall, a mix of trade tensions, uncertain monetary policy, and a tech stock sell-off caused the **US500 index to drop 120.93 points (-2.24%)** on **April 16, 2025**.
Technical view
Yes, the **bullish symmetrical triangle** pattern is often a strong signal for upward price movement. When the price moves within this pattern, it usually indicates a **tightening volatility** before a **breakout**, which can present a good market entry opportunity.
🔍 **Breakout Confirmation**
1️⃣ Increased trading volume when price breaks above the **upper trendline**.
2️⃣ A closing candle above the **triangle resistance** for a valid signal.
3️⃣ Price targets can be measured using the pattern’s initial height as a projection.
📈 **Potential Price Movement**
If the breakout happens, the price could surge toward the next **resistance level**. However, if the breakout fails and price moves below support, the pattern could turn **bearish**.
Warren Buffett famously said, “Be greedy when others are fearful.”
good luck
**My trading strategy is not intended to be a signal. It's a process of learning about market structure and sharpening my trading my skills also for my trade journal**
Thanks a lot for your support

S&P500 Should the FED LEAVE POLITICS aside and finally cut??The S&P500 index (SPX, illustrated by the blue trend-line) has been under heavy selling pressure in the past 3 months, basically the start of the year, but Fed Chair Jerome Powell insisted once again yesterday that the Fed is on a wait-and-see mode, without the urge to cut rates. But can it afford not to do so?
A detailed look into the past 35 years of recorded Yield Curve (US10Y-US02Y) price action, shows that when it flattens and rebounds, the Fed steps in and cuts the interest rates (orange trend-line). It did so last year but paused/ stopped the process in an attempt to get Inflation (black trend-line) under control to the desired 2% target.
As you see on that 1M chart though, this hasn't always been beneficial for stocks as especially for September 2007 and January 2001, it took place parallel to the Housing and Dotcom Crises. This however happened both times when Inflation and Rates were both high.
The Inflation Rate now seems to be at a low level (and dropping) that has been consistent with market bottoms and not tops. As a result, it appears that it is more likely we are in a curve reversal that is consistent with bull trend continuation for the stock market, after short-term corrections, in our opinion either post March 2020 (COVID crash) or pre-2000, which is consistent to previous studies we've made that the current A.I. Bubble market is in similar early mania stages like the Dotcom Bubble in the early-mid 1990s.
So to answer the original question, we believe that the Fed can afford to cut the Interest Rates now and offset some of the medium-term slow in growth that the trade tariffs may inflict and as there are more probabilities it will do more good to the stock market than harm.
Your thoughts?
-------------------------------------------------------------------------------
** Please LIKE 👍, FOLLOW ✅, SHARE 🙌 and COMMENT ✍ if you enjoy this idea! Also share your ideas and charts in the comments section below! This is best way to keep it relevant, support us, keep the content here free and allow the idea to reach as many people as possible. **
-------------------------------------------------------------------------------
💸💸💸💸💸💸
👇 👇 👇 👇 👇 👇

S&P INTRADAY key resistance at 5509
Donald Trump said there was “big progress” in trade talks with Japan, easing fears of higher tariffs. This boosted the Nikkei 225, as traders grew less concerned about U.S. pressure for a stronger yen.
Meanwhile, U.S. stock futures pointed to a rebound after Wednesday’s selloff. The drop was sparked by Fed Chair Jerome Powell, who struck a cautious tone on tariffs and signaled no rush to cut rates, disappointing markets looking for quicker support.
Key Support and Resistance Levels
Resistance Level 1: 5509
Resistance Level 2: 5660
Resistance Level 3: 5787
Support Level 1: 5110
Support Level 2: 4947
Support Level 3: 4816
This communication is for informational purposes only and should not be viewed as any form of recommendation as to a particular course of action or as investment advice. It is not intended as an offer or solicitation for the purchase or sale of any financial instrument or as an official confirmation of any transaction. Opinions, estimates and assumptions expressed herein are made as of the date of this communication and are subject to change without notice. This communication has been prepared based upon information, including market prices, data and other information, believed to be reliable; however, Trade Nation does not warrant its completeness or accuracy. All market prices and market data contained in or attached to this communication are indicative and subject to change without notice.

S&P500 INTRADAY sideways consolidationThe Trump administration is moving ahead with tariff plans on semiconductor and pharmaceutical imports, launching Commerce Department probes. In response, China has ordered its airlines to halt new Boeing jet deliveries, escalating trade tensions.
Despite the trade war, markets are getting a lift after Trump suggested a possible pause on auto tariffs and suspended some consumer electronics tariffs.
Japan will meet with the U.S. this week to discuss trade. The talks will test whether close allies like Japan get more favourable treatment.
Earnings in Focus:
Citigroup and Bank of America report today, following a strong quarter for equity trading across the sector.
Johnson & Johnson and United Airlines are also set to report.
Oil Market:
The International Energy Agency has cut its 2024 oil demand forecast due to trade-related slowdowns and sees a potential supply surplus through 2026.
Key Support and Resistance Levels
Resistance Level 1: 5509
Resistance Level 2: 5660
Resistance Level 3: 5787
Support Level 1: 5110
Support Level 2: 4947
Support Level 3: 4816
This communication is for informational purposes only and should not be viewed as any form of recommendation as to a particular course of action or as investment advice. It is not intended as an offer or solicitation for the purchase or sale of any financial instrument or as an official confirmation of any transaction. Opinions, estimates and assumptions expressed herein are made as of the date of this communication and are subject to change without notice. This communication has been prepared based upon information, including market prices, data and other information, believed to be reliable; however, Trade Nation does not warrant its completeness or accuracy. All market prices and market data contained in or attached to this communication are indicative and subject to change without notice.

S&P500 1D Death Cross formed! Market COLLAPSE or Bear TRAP? The S&P500 index (SPX) is attempting to recover from the April 07 2025 market low, following the 90-day Tariff pause.
Last Thursday however it formed a Death Cross on the 1D time-frame, he first since May 11 2022, which was during the last Inflation Crisis correction. That was nothing like the current crash though as it was a technical 1-year Bear Cycle in contrast to today which is a flash crash inflicted by Trump's tariffs.
What looks though most similar to today is the 2020 COVID crash. Equally fast and brutal, that sell-off also took place under an extreme pressure environment of uncertainty (economic lockdowns) which the world has never seen, similar to today's tariffs that admittedly have put (for the moment) an end to the U.S. - China trade.
The COVID crash phase also formed a 1D Death Cross just 4 days after the March 23 2020 bottom. Last Thursday's 1D Death Cross came also just 3 days after the April 07 2025 Low. If this pattern of extreme market shock is a repetitive model under such fundamental events, then the stock market has bottomed. And if it follows the exact same recovery pattern as post-COVID, then it may reach the 1.1 Fibonacci extension at 6300 in a little over 5 months (162 days).
-------------------------------------------------------------------------------
** Please LIKE 👍, FOLLOW ✅, SHARE 🙌 and COMMENT ✍ if you enjoy this idea! Also share your ideas and charts in the comments section below! This is best way to keep it relevant, support us, keep the content here free and allow the idea to reach as many people as possible. **
-------------------------------------------------------------------------------
Disclosure: I am part of Trade Nation's Influencer program and receive a monthly fee for using their TradingView charts in my analysis.
💸💸💸💸💸💸
👇 👇 👇 👇 👇 👇

S&P500: Bottom is in. 5,800 Target imminent.S&P500 is almost neutral on its 1D technical outlook (RSI = 44.927, MACD = -131.940, ADX = 29.116) as it has recovered from the tariff selloff, finding support a little over the 1W MA200. The 1D RSI made a double bottom and is much like the October 27th 2023 bottom. Both DB bullish divergences in contrast to the LL of the price. The immediate target on the rebound that followed in 2023 was the R1 level. Trade: long, TP = 5,800.
## If you like our free content follow our profile to get more daily ideas. ##
## Comments and likes are greatly appreciated. ##

S&P 500 off earlier highsThe major US indices have come noticeably off their earlier highs, following the positive start on the back of the weekend news of temporary tariff relief on technology sector.
The fact the indices could break out to test waters above last week's highs, suggests traders have not been convinced that they have had the all-clear just yet. Perhaps volatility will ease a little this week, but with earnings from tech giants to come in the next couple of weeks, on top of all the trade war saga, anything is possible. Traders must remain nimble.
It is all about the 5380 level now on the S&P 500. This is where it found resistance on Friday and now this level could turn into support. But if we break decisively below it again, then this could trigger a big of selling towards the next support at 5272.
However, the near-term trend has turned bullish following the big recovery last week. So, dip-buyers will be lurking. Let's see where we go from here.
In any case, more bullish price action is needed to completely nullify the bearish control. Specifically, the key resistance zone between 5490 to 5550 must give way before the bulls can be confident that we have see a major low last week.
By Fawad Razaqzada, market analyst with FOREX.com

S&P500 INTRADAY oversold bounce backMarkets Overview – Monday US Open
Trump Tariffs: Trump says tariffs on phones, computers, and other consumer tech are still on the table, calling the weekend exemption just a "procedural step."
Tech Rally: Despite that, tech stocks are up Apple and Nvidia leading on hopes the delay gives room for a better long-term trade deal.
Futures & Gold: US equity futures are pointing higher. Gold hit a new record as investors seek safe-haven assets.
FX Moves: The dollar is down for a fifth straight day, with the euro is surging, it is thefastest rally vs USD in 15 yearsas, traders eye a move toward $1.20.
Earnings Outlook:
Q1 earnings season kicks into gear this week.
Citigroup and Morgan Stanley lowered their S&P 500 earnings forecasts, citing tariff concerns and broader economic headwinds.
Key Support and Resistance Levels
Resistance Level 1: 5509
Resistance Level 2: 5660
Resistance Level 3: 5787
Support Level 1: 5110
Support Level 2: 4947
Support Level 3: 4816
This communication is for informational purposes only and should not be viewed as any form of recommendation as to a particular course of action or as investment advice. It is not intended as an offer or solicitation for the purchase or sale of any financial instrument or as an official confirmation of any transaction. Opinions, estimates and assumptions expressed herein are made as of the date of this communication and are subject to change without notice. This communication has been prepared based upon information, including market prices, data and other information, believed to be reliable; however, Trade Nation does not warrant its completeness or accuracy. All market prices and market data contained in or attached to this communication are indicative and subject to change without notice.

SPY, More pain to come? SPY / 1D
Hello Traders, welcome back to another market breakdown.
SPY is showing strong bearish momentum, breaking below resistance. However, the price is in the oversold zone for now. Hence, instead of jumping in at current levels, I recommend waiting for a pullback into the middle of the range zone for a more strategic entry.
If the pullback holds and sell mode confirms, the third leg lower could target new lows.
Stay disciplined, wait for the market to come to you, and trade with confidence!
Trade safely,
Trader Leo.

Gold TA 25.4.5Hello everyone, I hope you're doing well. In the 1-hour timeframe, the price of gold has taken a downward trend and has formed two lower lows. There is a very strong order block visible on the chart, and I expect that after the price retraces to this order block, it will react and continue to move down. We will wait for the price to reach this order block, then in the 5-minute timeframe, we will take the right trades and enter a short position. Keep in mind that in higher timeframes, the market is moving upwards, so short positions carry higher risk.
⚠️ This Analysis will be updated ...
👤 Sadegh Ahmadi: GPTradersHub
📅 25.Apr.5
⚠️(DYOR)
❤️ If you apperciate my work , Please like and comment , It Keeps me motivated to do better

Bitcoin TA 25.4.12Bitcoin is currently correcting towards the range of 87 to 90 thousand dollars, and after that, we will enter a short position if we see a valid setup. The target levels are 74 thousand dollars, 70 thousand dollars, and lower targets can also be observed in this view. We will wait for the valid setup before entering the short position.
⚠️ This Analysis will be updated ...
👤 Sadegh Ahmadi: @GPTradersHub
📅 25.Apr.12
⚠️(DYOR)
❤️ If you apperciate my work , Please like and comment , It Keeps me motivated to do better

"SPX500/US500" Index Market Money Heist Plan (Day / Scalping)🌟Hi! Hola! Ola! Bonjour! Hallo! Marhaba!🌟
Dear Money Makers & Robbers, 🤑 💰💸✈️
Based on 🔥Thief Trading style technical and fundamental analysis🔥, here is our master plan to heist the "SPX500/US500" Index Market. Please adhere to the strategy I've outlined in the chart, which emphasizes long entry. Our aim is to escape near the high-risk Blue MA Zone. Risky level, overbought market, consolidation, trend reversal, trap at the level where traders and bearish robbers are stronger. 🏆💸"Take profit and treat yourself, traders. You deserve it!💪🏆🎉
Entry 📈 : "The heist is on! Wait for the MA breakout (5400) then make your move - Bullish profits await!"
however I advise to Place Buy stop orders above the Moving average (or) Place buy limit orders within a 15 or 30 minute timeframe most recent or swing, low or high level for Pullback entries.
📌I strongly advise you to set an "alert (Alarm)" on your chart so you can see when the breakout entry occurs.
Stop Loss 🛑: "🔊 Yo, listen up! 🗣️ If you're lookin' to get in on a buy stop order, don't even think about settin' that stop loss till after the breakout 🚀. You feel me? Now, if you're smart, you'll place that stop loss where I told you to 📍, but if you're a rebel, you can put it wherever you like 🤪 - just don't say I didn't warn you ⚠️. You're playin' with fire 🔥, and it's your risk, not mine 👊."
📍 Thief SL placed at the recent/swing low level Using the 1H timeframe (5100) Day trade basis.
📍 SL is based on your risk of the trade, lot size and how many multiple orders you have to take.
🏴☠️Target 🎯: 5800 (or) Escape Before the Target
🧲Scalpers, take note 👀 : only scalp on the Long side. If you have a lot of money, you can go straight away; if not, you can join swing traders and carry out the robbery plan. Use trailing SL to safeguard your money 💰.
💰💵💸"SPX500/US500" Index Market Heist Plan (Scalping/Day) is currently experiencing a bullishness,., driven by several key factors. 👇👇👇
📰🗞️Get & Read the Fundamental, Macro, COT Report, Geopolitical and News Analysis, Sentimental Outlook, Intermarket Analysis, Index-Specific Analysis, Positioning and future trend targets & Overall outlook score... go ahead to check 👉👉👉🔗🔗
⚠️Trading Alert : News Releases and Position Management 📰 🗞️ 🚫🚏
As a reminder, news releases can have a significant impact on market prices and volatility. To minimize potential losses and protect your running positions,
we recommend the following:
Avoid taking new trades during news releases
Use trailing stop-loss orders to protect your running positions and lock in profits
💖Supporting our robbery plan 💥Hit the Boost Button💥 will enable us to effortlessly make and steal money 💰💵. Boost the strength of our robbery team. Every day in this market make money with ease by using the Thief Trading Style.🏆💪🤝❤️🎉🚀
I'll see you soon with another heist plan, so stay tuned 🤑🐱👤🤗🤩

VIX Hits 27-Year Extreme. Is the Market About to CRASH or SOAR?The Volatility Index (VIX displayed by the blue trend-line) has entered a level that has visited only another 5 times in the last 27 years (since August 1998)! That is what we've called the 'VIX Max Panic Resistance Zone'. As the name suggests that indicates ultimate panic for the stock markets, which was fueled by massive sell-offs, leading to extreme volatility and uncertainty.
So the obvious question arises: 'Is this Good or Bad for the market??'
The answer is pretty clear if you look at the chart objectively and with a clear perspective. In 4 out of those 5 times, the S&P500 (SPX) bottomed exactly on the month of the VIX Max Panic signal. It was only during the 2008 U.S. Housing Crisis that VIX hit the Max Panic Zone in October 2008 but bottomed 5 months late in March 2009.
As a result, this is historically a very strong opportunity for a multi-year buy position. If anything, today's VIX situation looks more similar to September 2011 or even the bottom of the previous U.S. - China Trade war in March 2020.
-------------------------------------------------------------------------------
** Please LIKE 👍, FOLLOW ✅, SHARE 🙌 and COMMENT ✍ if you enjoy this idea! Also share your ideas and charts in the comments section below! This is best way to keep it relevant, support us, keep the content here free and allow the idea to reach as many people as possible. **
-------------------------------------------------------------------------------
💸💸💸💸💸💸
👇 👇 👇 👇 👇 👇

S&P500 Vast Support from previous High. New 2 year Bull started.The S&P500 / US500 has reached a bottom and is rebounding.
The rebound is taking place just over the 1week MA200 but also the key pivot line that was previously a Cycle High and now turned Support.
We have seen this another 2 times in the last 10 years and both time caused a massive rally.
This puts an end to the tariff war correction and based on the chart starts a new 2 year Bull Cycle.
Minimum rise before was +58%. Target 7600.
Follow us, like the idea and leave a comment below!!

S&P INTRADAY oversold bounce backUS stock futures dropped and the dollar weakened as concerns grew that the trade war could cause lasting economic damage. This came despite a surge in European and Asian equities, which followed a major rally on Wall Street after President Trump unexpectedly paused most of his tariffs. The move lifted global risk sentiment temporarily, but also isolated China as the primary target of Trump’s trade offensive, limiting Beijing’s options for near-term de-escalation. In response, Chinese leaders are meeting today to consider additional economic stimulus.
Meanwhile, U.S. Treasuries gained as investors sought safety following a volatile session. The Federal Reserve, for its part, signalled it plans to keep interest rates steady, aiming to prevent tariff-driven inflation even if the labour market weakens. Officials have publicly downplayed the need for rate cuts, choosing to prioritize stability over pre-emptive easing.
Key Support and Resistance Levels
Resistance Level 1: 5509
Resistance Level 2: 5660
Resistance Level 3: 5787
Support Level 1: 4815
Support Level 2: 4700
Support Level 3: 4585
This communication is for informational purposes only and should not be viewed as any form of recommendation as to a particular course of action or as investment advice. It is not intended as an offer or solicitation for the purchase or sale of any financial instrument or as an official confirmation of any transaction. Opinions, estimates and assumptions expressed herein are made as of the date of this communication and are subject to change without notice. This communication has been prepared based upon information, including market prices, data and other information, believed to be reliable; however, Trade Nation does not warrant its completeness or accuracy. All market prices and market data contained in or attached to this communication are indicative and subject to change without notice.

US500 Historical Rallies & Pullbacks with a Potential ProjectionI’ve observed the US500’s performance over the years, marking rallies with a blue line and pullbacks with a yellow line. Looking at the chart, a systematic repetition of these movements emerges, which, at first glance, seems to follow a recognizable pattern.
Specifically, I’ve cloned the blue line from the rally that started on 03/23/2020 and ended on 12/20/2021, now represented by a green line, to hypothesize a potential future rally. This clone is based on the duration of previous pullbacks:
The first pullback, before the 2020 rally, began on 02/20/2020 and ended on 03/23/2020.
The second pullback, the current one, started on 02/17/2025 and might conclude around 04/07/2025, potentially paving the way for a new rally.
the angle of those pullbacks is almost identic
This "snapshot" observation suggests we could be nearing a turning point. Of course, this is just a hypothesis based on historical patterns, and I encourage cross-referencing it with other indicators or analyses. What are your thoughts?

DOW JONES INDEX (US30): Bearish More From Resistance
It looks like US30 is returning to a bearish trend again.
I see a strong bearish sentiment after a test of a key daily resistance.
The price formed an inverted cup and handle pattern and we see
a strong bearish imbalance with London session opening.
Goal - 39.685
❤️Please, support my work with like, thank you!❤️
I am part of Trade Nation's Influencer program and receive a monthly fee for using their TradingView charts in my analysis.

S&P500: Trump's 90-day tariff pause just saved the day??S&P500 is having so far a +9.50% rise from today's low as even though Trump announced a 125% raise to China tariffs, he lowered and paused tariffs for 90 days to all countries that contacted the U.S. for negotiation. The 1D technical outlook is about to get neutral (RSI = 42.537, MACD = -181.510, ADX = 39.036) as the rebound is taking place at the HL bottom of the Bullish Megaphone, while the 1W MA200 stayed intact.
A similar Megaphone was last seen during the previous 2018 Trade War and was completed with the COVID crash that started an abnormal rally to new ATH to correct the equally abnormal crash. Needless to say, it was based on quick rate cuts but the situation isn't all that different today. Trump's stance towards negotiating, coupled with highly anticipated rate cuts, can deliver an equally abnormal rally now.
The previous HH of the Bullish Megaphone hit the 2.0 Fibonacci extension. This time if the rally extends to the end of the year, targeting the 1.5 - 1.618 Fibonacci Zone would be considered fair (TP = 6,900).
## If you like our free content follow our profile to get more daily ideas. ##
## Comments and likes are greatly appreciated. ##

Has SPX formed a bottom?SPX500USD - 24h expiry
Price action looks to be forming a bottom.
A Doji style candle has been posted from the base.
Setbacks should be limited to yesterday's low.
We look to buy dips.
Risk/Reward would be poor to call a buy from current levels.
We look to Buy at 4900.5 (stop at 4767.5)
Our profit targets will be 5295.5 and 5365.5
Resistance: 5219.6 / 5350.0 / 5500.0
Support: 5100.0 / 5000.0 / 4812.2
Risk Disclaimer
The trade ideas beyond this page are for informational purposes only and do not constitute investment advice or a solicitation to trade. This information is provided by Signal Centre, a third-party unaffiliated with OANDA, and is intended for general circulation only. OANDA does not guarantee the accuracy of this information and assumes no responsibilities for the information provided by the third party. The information does not take into account the specific investment objectives, financial situation, or particular needs of any particular person. You should take into account your specific investment objectives, financial situation, and particular needs before making a commitment to trade, including seeking advice from an independent financial adviser regarding the suitability of the investment, under a separate engagement, as you deem fit.
You accept that you assume all risks in independently viewing the contents and selecting a chosen strategy.
Where the research is distributed in Singapore to a person who is not an Accredited Investor, Expert Investor or an Institutional Investor, Oanda Asia Pacific Pte Ltd (“OAP“) accepts legal responsibility for the contents of the report to such persons only to the extent required by law. Singapore customers should contact OAP at 6579 8289 for matters arising from, or in connection with, the information/research distributed.

S&P INTRADAY oversold bounce backTrump threatened a 50% import tax on China, adding confusion over his global tariffs. China promised to hit back and moved to support its markets.
Stocks bounced slightly as investors looked for bargains, but uncertainty around U.S. trade policy remains. U.S. Treasuries rose after falling on Monday.
Wall Street is getting more cautious. BlackRock downgraded U.S. stocks, and Goldman Sachs warned the selloff could turn into a longer bear market.
Key Support and Resistance Levels
Resistance Level 1: 5273
Resistance Level 2: 5379
Resistance Level 3: 5510
Support Level 1: 4815
Support Level 2: 4700
Support Level 3: 4585
This communication is for informational purposes only and should not be viewed as any form of recommendation as to a particular course of action or as investment advice. It is not intended as an offer or solicitation for the purchase or sale of any financial instrument or as an official confirmation of any transaction. Opinions, estimates and assumptions expressed herein are made as of the date of this communication and are subject to change without notice. This communication has been prepared based upon information, including market prices, data and other information, believed to be reliable; however, Trade Nation does not warrant its completeness or accuracy. All market prices and market data contained in or attached to this communication are indicative and subject to change without notice.

S&P500 Dead Cat Bounce or V-shaped Recovery?The S&P500 index (SPX) saw a remarkable turnaround yesterday after the Wall Street opening. The early futures sell-off came very close to the 1W MA200 (orange trend-line), which has been the ultimate Support level since the March 2009 Housing Crisis bottom (the last major Bear Cycle).
It supported the 2022 Inflation Crisis, the 2018 U.S. - China Trade War, the 2015 E.U./ Oil Crisis and 2011 correction. It only broke during the irregularity of the March 2020 COVID flash crash.
Note that the 1W RSI hitting 27.30 has only happened during the COVID crash and the actual March 2009 Housing Crisis Bottom. At the same time, the index reached the All Time High (ATH) trend-line (dashed0 of the High before the 2022 Inflation Crisis (previous correction phase). As this chart shows, previous ATH trend-lines have never been broken during the correction phases that followed them.
In any case, the million dollar question is of course this: Was yesterday a Dead Cat Bounce inside the new Bear Cycle or we are ahead of a V-shaped recovery? Well technically it depends on the 1W MA200 (the market needs 1W candles to close above it) while fundamentally if depends on potential trade deals and of course the Fed (the market needs rate cut assurances).
If this is a V-shaped Recovery indeed, there is no reason not to expect the market to follow all previous rebounds of 1W MA200 corrections that weren't Bear Cycles (Bear Cycles on this chart are 2008 and 2022).
As you can see, all rebounds have been sharp, indeed V-shaped recoveries, ranging from 20 to 27 weeks (140 - 189 days) until they broke their previous High. So this indicates that technically, SPX should make new ATH by October 13 2025 the latest (and September 02 earliest). Of course this is just a projection, this time we have no COVID shutdowns, no Grexits or Brexits, no Oil crises, it is all due to one fact, the tariffs and if deals are reached and the Fed delivers the much needed rat cuts, the recovery may be even faster, as sharp as the correction has been.
The facts are on the historic data on the chart. The conclusions are yours.
-------------------------------------------------------------------------------
** Please LIKE 👍, FOLLOW ✅, SHARE 🙌 and COMMENT ✍ if you enjoy this idea! Also share your ideas and charts in the comments section below! This is best way to keep it relevant, support us, keep the content here free and allow the idea to reach as many people as possible. **
-------------------------------------------------------------------------------
💸💸💸💸💸💸
👇 👇 👇 👇 👇 👇
