US500 Need to break current 5500 rangeUS500 is currently ranging between 5500 & 5485. It need to break current 5500 range to break upside resistance at PDL 5522.70 and next will test PWL 5556.90 which coincide with Tuesday low of 5555.80 before heading upwards.
Us500

S&P500: Recovery has started and the next stop is the 1D MA50.S&P500 is marginally neutral on its 1D technical outlook (RSI = 45.213, MACD = -61.280, ADX = 30.163) as it's recovered from Friday's bearish sentiment and already crossed above the 0.236 Fibonacci level. This rebound made Monday's low a Double Bottom and since the 1D RSI is on a HL bullish divergence, we expect a strong 1 month rally to start. The first target is the 1D MA50 slightly over the 0.5 Fib mark (TP1 = 5,835) and after a small correction, the 0.786 Fib (TP2 = 6,000), which is also the top of the 5 month Bull Flag.
## If you like our free content follow our profile to get more daily ideas. ##
## Comments and likes are greatly appreciated. ##

SPX to find sellers at previous resistance?SPX500USD - 24h expiry
Daily signals are bearish.
Short term bias has turned negative.
Previous resistance located at 5700.
20 1day EMA is at 5699.8.
5705.4 has been pivotal.
We look to Sell at 5699.5 (stop at 5743.5)
Our profit targets will be 5585.5 and 5565.5
Resistance: 5630.0 / 5658.9 / 5700.0
Support: 5602.4 / 5564.3 / 5495.3
Risk Disclaimer
The trade ideas beyond this page are for informational purposes only and do not constitute investment advice or a solicitation to trade. This information is provided by Signal Centre, a third-party unaffiliated with OANDA, and is intended for general circulation only. OANDA does not guarantee the accuracy of this information and assumes no responsibilities for the information provided by the third party. The information does not take into account the specific investment objectives, financial situation, or particular needs of any particular person. You should take into account your specific investment objectives, financial situation, and particular needs before making a commitment to trade, including seeking advice from an independent financial adviser regarding the suitability of the investment, under a separate engagement, as you deem fit.
You accept that you assume all risks in independently viewing the contents and selecting a chosen strategy.
Where the research is distributed in Singapore to a person who is not an Accredited Investor, Expert Investor or an Institutional Investor, Oanda Asia Pacific Pte Ltd (“OAP“) accepts legal responsibility for the contents of the report to such persons only to the extent required by law. Singapore customers should contact OAP at 6579 8289 for matters arising from, or in connection with, the information/research distributed.

Bearish reversal?S&P500 (US500) is rising towards the pivot which is a pullback resistance and could reverse to the pullback support.
Pivot: 5,684.31
1st Support: 5,508.29
1st Resistance: 5,768.80
Risk Warning:
Trading Forex and CFDs carries a high level of risk to your capital and you should only trade with money you can afford to lose. Trading Forex and CFDs may not be suitable for all investors, so please ensure that you fully understand the risks involved and seek independent advice if necessary.
Disclaimer:
The above opinions given constitute general market commentary, and do not constitute the opinion or advice of IC Markets or any form of personal or investment advice.
Any opinions, news, research, analyses, prices, other information, or links to third-party sites contained on this website are provided on an "as-is" basis, are intended only to be informative, is not an advice nor a recommendation, nor research, or a record of our trading prices, or an offer of, or solicitation for a transaction in any financial instrument and thus should not be treated as such. The information provided does not involve any specific investment objectives, financial situation and needs of any specific person who may receive it. Please be aware, that past performance is not a reliable indicator of future performance and/or results. Past Performance or Forward-looking scenarios based upon the reasonable beliefs of the third-party provider are not a guarantee of future performance. Actual results may differ materially from those anticipated in forward-looking or past performance statements. IC Markets makes no representation or warranty and assumes no liability as to the accuracy or completeness of the information provided, nor any loss arising from any investment based on a recommendation, forecast or any information supplied by any third-party.

S&P500 Last time it made that bottom was 18 months ago.S&P500 / US500 is trading inside a multi year Channel Up that goes back to October 2022.
The index almost hit the Channel bottom this week and immediately we see a rebound attempt.
It may be under the 1week MA50 but this is not disastrous as the patterns last bottom was formed exactly under it on October 23rd 2023, 18 months ago.
On top of that, the 1week RSI was exactly where it is now, on the 40.00 Support, bearish enough to call for a long term buy.
In addition, the both bearish waved leading to both bottoms were almost -11%. This high symmetry potential suggests that the bullish wave that will follow may be of a similar +28.34% rise.
This is a unique opportunity to buy and target 7000.
Follow us, like the idea and leave a comment below!!

S&P INTRADAY awaits tariffs clarity capped by 5711Resistance Level 1: 5711
Resistance Level 2: 5788
Resistance Level 3: 5863
Support Level 1: 5487
Support Level 2: 5412
Support Level 3: 5262
This communication is for informational purposes only and should not be viewed as any form of recommendation as to a particular course of action or as investment advice. It is not intended as an offer or solicitation for the purchase or sale of any financial instrument or as an official confirmation of any transaction. Opinions, estimates and assumptions expressed herein are made as of the date of this communication and are subject to change without notice. This communication has been prepared based upon information, including market prices, data and other information, believed to be reliable; however, Trade Nation does not warrant its completeness or accuracy. All market prices and market data contained in or attached to this communication are indicative and subject to change without notice.

DOW JONES (US30): Bullish Reversal Confirmed?!
Dow Jones finally looks strong.
I see a high momentum bullish candle after
a confirmed liquidity grab below the underlined demand zone.
I expect up move at least to 41750 resistance.
❤️Please, support my work with like, thank you!❤️
I am part of Trade Nation's Influencer program and receive a monthly fee for using their TradingView charts in my analysis.

US500 Price ActionHello Trader,
As you can see, the market is currently moving to the downside, approaching a clearly identified Demand Zone. Remember, as I always emphasize: no liquidity, no valid zone. Therefore, I've also marked liquidity levels located just above this Demand Zone, along with a suggested safe Stop Loss (SL) placement. However, please keep in mind that no level is truly "safe" in trading, which is precisely why we always use stop losses and actively manage risk on every trade.
Additionally, I've highlighted two potential Take Profit (TP) areas: one where you might consider closing your trade early for safety, and another where you could hold your position if price action continues to move favorably.
As always, avoid greed, prioritize risk management, and trade responsibly.
Wishing you all the best and happy trading!
Thank you.

S&P500 INTRADAY down 1% in pre market tradingS&P 500 futures are down 1%, with global markets falling on US tariff concerns and tech weakness (Nasdaq 100 -1.4%, Nvidia & Tesla -3% premarket). The S&P 500 is down 5.1% for Q1, its worst quarter since 2022, as uncertainty over Trump’s tariff plans (starting April 2) and a potential Russian oil ban weigh on sentiment.
Key Support and Resistance Levels
Resistance Level 1: 5711
Resistance Level 2: 5788
Resistance Level 3: 5863
Support Level 1: 5487
Support Level 2: 5412
Support Level 3: 5262
This communication is for informational purposes only and should not be viewed as any form of recommendation as to a particular course of action or as investment advice. It is not intended as an offer or solicitation for the purchase or sale of any financial instrument or as an official confirmation of any transaction. Opinions, estimates and assumptions expressed herein are made as of the date of this communication and are subject to change without notice. This communication has been prepared based upon information, including market prices, data and other information, believed to be reliable; however, Trade Nation does not warrant its completeness or accuracy. All market prices and market data contained in or attached to this communication are indicative and subject to change without notice.

S&P500 during TRUMP's 2018 vs 2025 TRADE WAR.The S&P500 index (SPX) has started off the year in disappointing fashion as since mid-February the market has corrected by over -10% and of course almost all of it is attributed to the trade tariffs imposed by President Trump. As you know, this is not the first time Trump goes into a Trade War. The 1st has started in January 2018 when the first tariff announcements were made against China.
We can say that Trump's 2nd Trade War officially started on March 03 2025, with tariff implementations against Mexico, Canada and China. As you can see, the build up to both Trade Wars has been identical both in structural price count and in 1W RSI terms.
By the week of February 05 2018, the index has dropped by a little over -11%, hit the 1W MA50 (blue trend-line) and the 0.236 Fibonacci retracement level and rebounded, while the 1W RSI formed a Lower Low. We can claim that this are roughly the levels we are now. That drop started a Megaphone pattern, which ran through all of 2018. The ultimate bottom for this Megaphone Trade War pattern came in December 24 2018 on the 1W MA200 (orange trend-line).
Right now, the 1W RSI is almost on Lower Lows while crossing below its 1W MA50 and what remains to be seen is if it will hit its 0.236 Fib to form the bottom of the Megaphone or will rebound now.
Do you think Trump's 2nd Trade War will keep the market highly volatile within a Megaphone or will plunge it even more?
-------------------------------------------------------------------------------
** Please LIKE 👍, FOLLOW ✅, SHARE 🙌 and COMMENT ✍ if you enjoy this idea! Also share your ideas and charts in the comments section below! This is best way to keep it relevant, support us, keep the content here free and allow the idea to reach as many people as possible. **
-------------------------------------------------------------------------------
💸💸💸💸💸💸
👇 👇 👇 👇 👇 👇

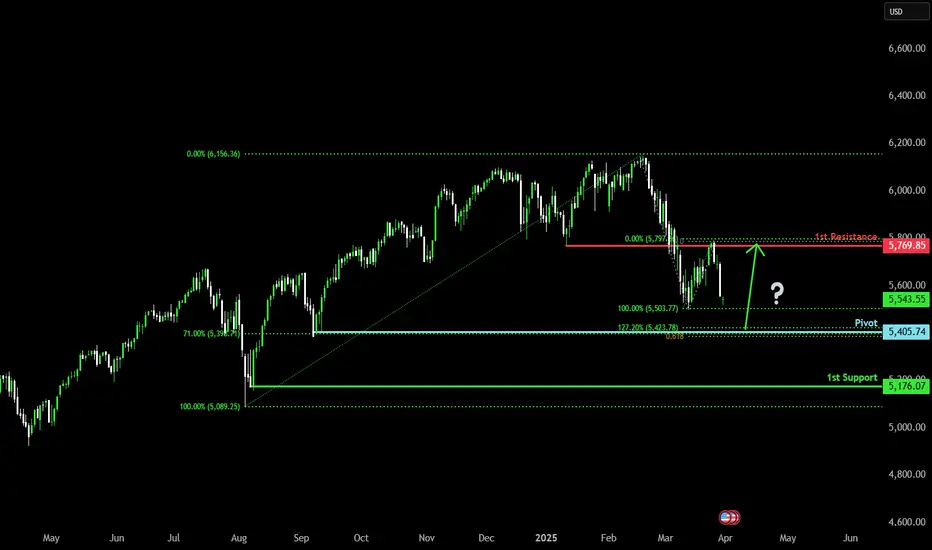
Falling towards pullback support?S&P500 (US500) is falling towards the pivot which acts as a pullback support and could bounce to the 1st resistance which is an overlap resistance.
Pivot: 5,405.74
1st Support: 5,176.07
1st Resistance: 5,769.85
Risk Warning:
Trading Forex and CFDs carries a high level of risk to your capital and you should only trade with money you can afford to lose. Trading Forex and CFDs may not be suitable for all investors, so please ensure that you fully understand the risks involved and seek independent advice if necessary.
Disclaimer:
The above opinions given constitute general market commentary, and do not constitute the opinion or advice of IC Markets or any form of personal or investment advice.
Any opinions, news, research, analyses, prices, other information, or links to third-party sites contained on this website are provided on an "as-is" basis, are intended only to be informative, is not an advice nor a recommendation, nor research, or a record of our trading prices, or an offer of, or solicitation for a transaction in any financial instrument and thus should not be treated as such. The information provided does not involve any specific investment objectives, financial situation and needs of any specific person who may receive it. Please be aware, that past performance is not a reliable indicator of future performance and/or results. Past Performance or Forward-looking scenarios based upon the reasonable beliefs of the third-party provider are not a guarantee of future performance. Actual results may differ materially from those anticipated in forward-looking or past performance statements. IC Markets makes no representation or warranty and assumes no liability as to the accuracy or completeness of the information provided, nor any loss arising from any investment based on a recommendation, forecast or any information supplied by any third-party.

S&P500 Huge retest of former Channel Down.S&P500 / US500 took a big hit today following the higher than expected PCE, causing a price rejection on the 4hour MA50.
So far however the drop stopped exactly at the top of the former Channel Down of February-March.
With the 4hour RSI on the same level as March 10th, if this level holds, it will be a huge retest buy signal and will start a new bullish wave.
Based on this, we'd expect the 1day MA50 to be targeted at 5,850.
Follow us, like the idea and leave a comment below!!

S&P to find buyers at current market price?US500 - Intraday
Closed the day little net changed.
An overnight negative theme in Equities has led to a lower open this morning.
Immediate signals are hard to interpret.
Bespoke resistance is located at 5853.
Bespoke support is located at 5536.
Dips continue to attract buyers.
We look to Buy at 5609 (stop at 5572)
Our profit targets will be 5719 and 5853
Resistance: 5719 / 5737 / 5853
Support: 5616 / 5607 / 5536
Risk Disclaimer
The trade ideas beyond this page are for informational purposes only and do not constitute investment advice or a solicitation to trade. This information is provided by Signal Centre, a third-party unaffiliated with OANDA, and is intended for general circulation only. OANDA does not guarantee the accuracy of this information and assumes no responsibilities for the information provided by the third party. The information does not take into account the specific investment objectives, financial situation, or particular needs of any particular person. You should take into account your specific investment objectives, financial situation, and particular needs before making a commitment to trade, including seeking advice from an independent financial adviser regarding the suitability of the investment, under a separate engagement, as you deem fit.
You accept that you assume all risks in independently viewing the contents and selecting a chosen strategy.
Where the research is distributed in Singapore to a person who is not an Accredited Investor, Expert Investor or an Institutional Investor, Oanda Asia Pacific Pte Ltd (“OAP“) accepts legal responsibility for the contents of the report to such persons only to the extent required by law. Singapore customers should contact OAP at 6579 8289 for matters arising from, or in connection with, the information/research distributed.

US500US500 Price Action Analysis and Trade Setups (March 28, 2025)
Price Action Summary:
Weekly Chart: Long-term uptrend intact, but recent rejection near 6,200 signals a medium-term correction.
Daily Chart: Price is consolidating near 5,600 after a sharp drop from highs. Bearish momentum persists.
4H Chart: Lower highs and lower lows confirm short-term bearish bias. Resistance at 5,750 is holding.
1H Chart: Intraday range between 5,550 and 5,750. Price struggling to break higher.
Trade of the Day (Day Trading Setup)
Short Setup:
Entry: 5,700 after rejection at resistance
Stop Loss: 5,770
Take Profit:
TP1: 5,620
TP2: 5,550
Reason: Short-term bearish structure with resistance holding at 5,750.
Swing Trading Setup
Short Setup:
Entry: Below 5,550 after daily close confirmation
Stop Loss: 5,650
Take Profit:
TP1: 5,300
TP2: 5,100

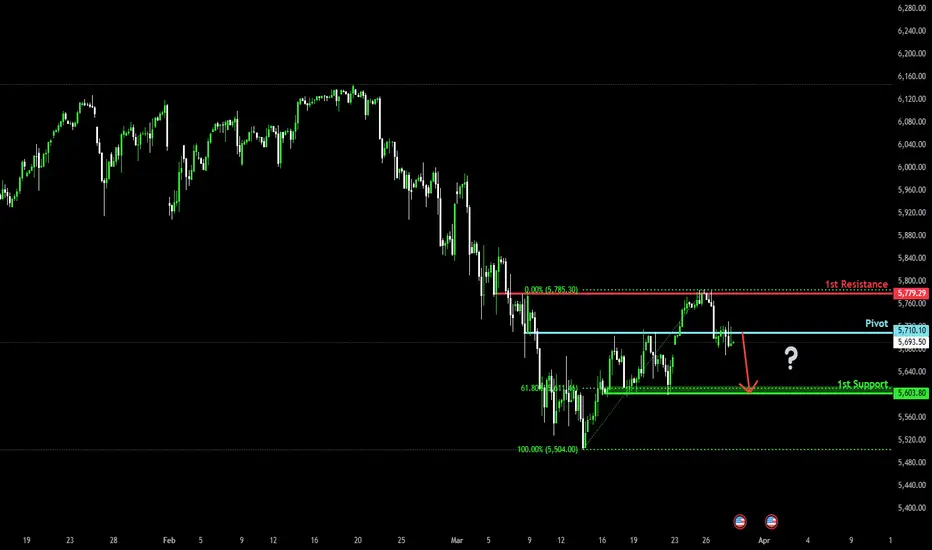
Bearish drop?S&P500 (US500) is reacting off the pivot which acts as a pullback resistance and could drop to the 1st support which has been identified as a pullback support.
Pivot: 5,710.10
1st Support: 5,603.80
1st Resistance: 5,778.29
Risk Warning:
Trading Forex and CFDs carries a high level of risk to your capital and you should only trade with money you can afford to lose. Trading Forex and CFDs may not be suitable for all investors, so please ensure that you fully understand the risks involved and seek independent advice if necessary.
Disclaimer:
The above opinions given constitute general market commentary, and do not constitute the opinion or advice of IC Markets or any form of personal or investment advice.
Any opinions, news, research, analyses, prices, other information, or links to third-party sites contained on this website are provided on an "as-is" basis, are intended only to be informative, is not an advice nor a recommendation, nor research, or a record of our trading prices, or an offer of, or solicitation for a transaction in any financial instrument and thus should not be treated as such. The information provided does not involve any specific investment objectives, financial situation and needs of any specific person who may receive it. Please be aware, that past performance is not a reliable indicator of future performance and/or results. Past Performance or Forward-looking scenarios based upon the reasonable beliefs of the third-party provider are not a guarantee of future performance. Actual results may differ materially from those anticipated in forward-looking or past performance statements. IC Markets makes no representation or warranty and assumes no liability as to the accuracy or completeness of the information provided, nor any loss arising from any investment based on a recommendation, forecast or any information supplied by any third-party.
NASDAQ INDEX (US100): Bullish Reversal Confirmed?!
I see 2 very strong bullish reversal confirmation on US100 on a daily.
First the market violated a resistance line of a falling channel.
Then, a neckline of a cup & handle pattern was broken.
Both breakouts indicate the strength of the buyers.
We can expect a growth at least to 20300 resistance.
❤️Please, support my work with like, thank you!❤️

S&P500 Do you really want to bet against the market??We have done a number of multi-decade analyses on both S&P500 (SPX) and Dow Jones over the years. Especially in times of high volatility, such as the current ones amidst the tariff wars, the long-term macro-economic analysis always helps to keep the most objective perspective.
And as you see in the wide picture of SPX's 35-year Cycles, the current 3-month correction is nothing but a technical pull-back that justifies the rule. The 1M MA50 (blue trend-line) tends to be the main Support during the Bull Phase and then it breaks, the Bear Cycle starts that drops even below the 1M MA200 (orange trend-line).
Right now, assuming the current Cycle that started after the early 2009 Housing Crisis bottom, will be as long as the previous one at least, we are headed for the 0.5 Time Fibonacci level (blue) and are marginally above the 0.382 Horizontal Fibonacci level (black). This is the exact kind of behavior we had on the previous Cycle with the 1990 pull-back, which as expected approached the 1M MA50 and rebounded. In 1954, the index was again headed for the 0.5 Time Fib and was on the 0.382 Horizontal Fib.
It is obvious that the degree of symmetry among the Cycles is remarkable and as long as the 1M MA50 holds, any pull-back should historically be bought. As we head towards the 0.786 Time Fib though, the danger of staying in the market gets extremely high but as mentioned, a break below the 1M MA50 is the confirmed sell signal.
This shows that despite the recent volatility, buying is still heavily favored. Are you willing to bet against the market at this stage?
-------------------------------------------------------------------------------
** Please LIKE 👍, FOLLOW ✅, SHARE 🙌 and COMMENT ✍ if you enjoy this idea! Also share your ideas and charts in the comments section below! This is best way to keep it relevant, support us, keep the content here free and allow the idea to reach as many people as possible. **
-------------------------------------------------------------------------------
💸💸💸💸💸💸
👇 👇 👇 👇 👇 👇

S&P INTRADAY - Stronger Growth, Labour Market ResilientUS Q4 GDP (Annualized) came in at 2.4%, beating forecasts of 2.3%, signalling resilient economic growth despite higher interest rates. A stronger-than-expected economy supports corporate earnings but may also reinforce the Fed’s cautious stance on rate cuts.
Initial Jobless Claims (4-week average) declined to 224K from 227K, pointing to continued labor market strength. A tight job market supports consumer spending, which is crucial for corporate revenue but may keep inflationary pressures elevated, influencing Fed policy expectations.
Market Impact:
S&P 500: The better-than-expected GDP and healthy labor market data suggest economic momentum remains intact, supporting corporate earnings and risk appetite. However, persistent strength may delay Fed rate cuts, potentially leading to market volatility.
Key Support and Resistance Levels
Resistance Level 1: 5780
Resistance Level 2: 5844
Resistance Level 3: 5920
Support Level 1: 5660
Support Level 2: 5604
Support Level 3: 5540
This communication is for informational purposes only and should not be viewed as any form of recommendation as to a particular course of action or as investment advice. It is not intended as an offer or solicitation for the purchase or sale of any financial instrument or as an official confirmation of any transaction. Opinions, estimates and assumptions expressed herein are made as of the date of this communication and are subject to change without notice. This communication has been prepared based upon information, including market prices, data and other information, believed to be reliable; however, Trade Nation does not warrant its completeness or accuracy. All market prices and market data contained in or attached to this communication are indicative and subject to change without notice.


S&P 500 Correction Channel Keeps Bulls in Control, for NowThe S&P 500 has formed an uptrend channel after breaking out of the "tariff panic" downtrend, which had dragged the index down more than 10%. But is this new short-term uptrend merely a correction, or has the real direction changed? That’s the key question, one that will likely be answered in early April when the new tariffs take effect.
February consumer confidence data didn’t look promising, but much of the negativity had already been priced in during the earlier 10% sell-off. However, this week’s PCE report, combined with next week’s tariffs and jobs report, could become a catalyst for determining the short- to medium-term direction.
The 200-hour SMA has now reached the upper line of the trend channel. Together, they may create a strong resistance level. To the downside, 5700 is a key horizontal support level. By the end of this week, it will converge with the lower boundary of the channel, right as both the GDP and PCE data are released. Including the time factor, this confluence could mark the main short-term support.
As long as the trend channel holds, bulls remain in control.

S&P500: Recovered the 1W MA50. Best buy opportunity of 2025.The S&P500 is marginally neutral on its 1D technical outlook (RSI = 47.606, MACD = -47.070, ADX = 35.637) as it is in the process of recovery from the previous oversold condition. What the index did recover however, and which is a massive buy signal, is the 1W MA50. Technically this trendline held two weeks ago, despite marginally crossing under it, and provided the basis for a new long term bottom. Basically it is the exact same pattern as the October 23rd 2023 bottom, which was also a HL on the 3 year Channel Up, declined also by -11% and the 1W RSI was almost on the same level as today's low (the S1 level).
Every bullish wave inside this 3 year pattern hit at least the 2.0 Fibonacci extension. Given that this bottom was made on the 0.618 Channel Fib level, like both of the last two HL (Aug 5th 2024, April 15th 2024), we expect a test of the Channel's top by the end of the year. A TP = 6,700 would still be under the 2.0 Fib extension and that's out long term target.
## If you like our free content follow our profile to get more daily ideas. ##
## Comments and likes are greatly appreciated. ##

Tesla Update 2 Plan the trade and be PreparedUpdate on the Monthly chart with revised level which is worth noting on your charts and being prepared for . Enjoy the update and thanks for watching
