US500: Rebound Setup After Sharp Pullback – Key Support HoldingUS500 has experienced a strong corrective move after an extended bullish run but is now showing signs of stabilizing near a key support area. This zone aligns with both technical retracement levels and the market's reaction to fundamental shifts—particularly the dovish repricing of the Fed following weak US jobs data.
Technical Analysis (4H Chart)
Pattern: After a strong uptrend, price faced a steep correction, forming a potential short-term reversal setup.
Current Level: 6,235, holding above the 6,217 support zone.
Key Support Levels:
6,217 (immediate support; key defense zone for bulls).
6,171 (38.2% retracement, secondary support if deeper pullback occurs).
Resistance Levels:
6,272 (23.6% retracement and initial resistance).
6,360 (upper resistance zone and retest of recent breakdown).
6,429/6,436 (recent high and target if bullish momentum resumes).
Projection: A rebound from current levels could push US500 back toward 6,360–6,430 if support holds.
Fundamental Analysis
Bias: Neutral-to-bullish as macro drivers favor a recovery from pullback.
Key Fundamentals:
Fed Policy: Weak US jobs (+73K) and downward revisions have solidified rate cut expectations (~75% probability in September), boosting equity sentiment.
Inflation: Market awaits US CPI; softer data would further support equities.
Tariffs: While Trump’s tariffs create a medium-term risk for earnings, immediate Fed easing bets outweigh these concerns.
Risk Sentiment: Global risk remains supported by lower yields and optimism about Fed easing.
Risks:
Hot US CPI could reverse cut expectations, pressuring equities.
Geopolitical risks or tariff escalation could trigger renewed selling.
Key Events:
US CPI and PPI.
Fed speeches and rate expectations.
Earnings reports from key US companies.
Leader/Lagger Dynamics
US500 is a leader, driving global risk sentiment and influencing risk-sensitive assets like AUD/USD, NZD/USD, and JPY crosses.
Summary: Bias and Watchpoints
US500 is neutral-to-bullish, stabilizing at key support (6,217) after a sharp correction. Fed cut expectations and risk-on sentiment support the upside scenario, targeting 6,360–6,430 if US CPI aligns with softer inflation. However, a hot CPI print could invalidate this rebound and trigger another leg lower.
US500SHORT

S&P 500 Counter-Trend Setup After Bullish Week US500Currently watching the S&P 500 (US500) closely 👀. The index has been in a strong bullish trend 📈, but I’m now evaluating a potential counter-trend opportunity.
Given the strength we’ve seen this week — possibly a “foolish rally” — there’s a chance we’ve either printed or are close to printing the high of the week 🧱. That opens the door for a retracement setup, particularly as we head into Monday’s open 🗓️.
🧠 Trade idea: If we get a bearish market structure break, I’ll be looking to enter short — targeting a 1R take profit initially, and holding a portion for a 2R–3R extension 🎯.
Friday sessions, especially after strong trends, often present clean intraday pullbacks — and when Monday’s low is set early, it can trap late buyers and fuel the move 📉.
⚠️ This is not financial advice — just sharing my thought process and trade plan.

Us500:What is going to happen?hello friends👋
This time we are here with the analysis of us500, an important and vital index in the market that is being talked about a lot these days.
Well, let's go to the analysis, you will see that with the drop we had, a lower floor was made and the price was quickly supported and pumped by buyers.
Now it is clear that an ascending pattern has been formed, which is a very strong support in the specified area and a good buying point that you can enter into a transaction with capital and risk management.
Note that if the floor is broken and the stop loss is placed, our bullish pattern becomes invalid and we have to wait for lower floors.
🔥Follow us for more signals🔥
*Trade safely with us*

up or down...Hello friends🙌
🔊As you can see, the US500 index has been identified with several resistance encounters and the good support that the price has been able to break the resistance and turn it into support. Now, according to today's news, it seems that the price is targeting higher targets that we have identified for you.
In case of correction, it has strong support ahead of it, which we have identified with a white line, but don't forget that buyers have entered...📈
🔥Join us for more signals🔥
Trade safely with us.

US500 bearish 12 May - 16 May 2025S&P 500 Bearish Outlook: Targeting $5,100 Amid Rising Uncertainty
As of May 12, 2025, the S&P 500 (US500) stands at 5,661, reflecting a robust recovery from its April lows. However, I anticipate a bearish shift, projecting a decline towards the $5,100 level in the near term. Several converging factors underpin this outlook:
1. Anticipated Weakness in Core CPI Data
The upcoming release of the April Core Consumer Price Index (CPI) on May 13 is poised to be a pivotal event. While the year-over-year Core CPI is forecasted at 2.8%, matching the previous month's figure, the month-over-month increase is expected to rise to 0.3%, up from 0.1% in March. This acceleration suggests persistent inflationary pressures, potentially prompting the Federal Reserve to maintain or even tighten monetary policy, thereby exerting downward pressure on equities.
2. Deteriorating Market Sentiment and Forecasts
A notable shift in market sentiment is evident, with key indicators turning bearish. A prominent S&P 500 model has signaled its first bearish outlook since February 2022, reflecting growing investor apprehension. Additionally, leading financial institutions have revised their S&P 500 targets downward:
Goldman Sachs: Reduced from 6,500 to 5,700
RBC Capital Markets: Lowered from 6,600 to 5,500
Oppenheimer: Cut from 7,100 to 5,950
Yardeni Research: Adjusted from 7,000 to 6,000
These revisions underscore the mounting concerns over economic headwinds and market volatility.
3. Sectoral Divergence: Opportunities Amidst the Downturn
While the broader market faces challenges, certain sectors may exhibit resilience or even bullish tendencies:
Healthcare: Continues to serve as a defensive sector, with companies demonstrating solid quarterly results and reaffirming full-year guidance despite tariff impacts.
Energy Infrastructure: Firms like Enbridge and TC Energy benefit from long-term structural tailwinds, including rising energy demand and global energy security priorities.
Financials and Technology: Sectors represented by ETFs such as XLK and XLF are highlighted for their strong fundamentals and growth prospects.
Conversely, consumer discretionary sectors are showing signs of strain, with negative revenue surprises and companies like Harley-Davidson withdrawing their 2025 outlooks amid tariff uncertainties.
4. Implications of the US-UK Trade Deal
Recent developments in the US-UK trade agreement further contribute to market uncertainty. While the deal includes exemptions for certain British goods, such as aerospace components and a quota of 100,000 UK-made cars annually, it also maintains a baseline 10% tariff on foreign goods. This policy introduces complexity and potential cost pressures for multinational companies operating across borders.
Moreover, the agreement has faced criticism for being one-sided, with concerns that it may not adequately protect domestic industries or address broader trade imbalances. Such apprehensions can dampen investor confidence and contribute to market volatility.
The convergence of persistent inflation, cautious monetary policy, revised market forecasts, and the complexities introduced by recent trade agreements suggest a bearish trajectory for the S&P 500, with a potential decline towards $5,100. Investors should remain vigilant, monitoring sector-specific developments and macroeconomic indicators to navigate the evolving market landscape.
Disclaimer: This analysis is for informational purposes only and does not constitute investment advice. Always conduct your own research before making investment decisions.

US500 Reversal Zone? My Thought Process Explained 🎯 📉 Earlier today I posted an analysis on the US500, highlighting how price has traded into a weekly bearish order block 🧱 — a key distribution zone where I believe smart money could look to unwind positions. The market is currently overextended and sitting at a premium, which raises the risk of a potential aggressive retrace 🔄, especially heading into the weekend. ⚠️
💭 Here's a video where I break down that exact setup and walk you through my full thought process, including why I’m exercising extreme caution at these levels and what I’m looking for in terms of confirmation.
📚 As always, this is for educational purposes only — not financial advice. 🚫💼

US500 LIVEHello friends
Given the price rise and correction we had, we can open a position with capital and risk management.
*Trade safely with us*

Potential bearish drop?S&P500 (US500) has reacted off the pivot and could drop to the 1st support.
Pivot: 5,480.90
1st Support: 5,099.50
1st Resistance: 5,778.60
Risk Warning:
Trading Forex and CFDs carries a high level of risk to your capital and you should only trade with money you can afford to lose. Trading Forex and CFDs may not be suitable for all investors, so please ensure that you fully understand the risks involved and seek independent advice if necessary.
Disclaimer:
The above opinions given constitute general market commentary, and do not constitute the opinion or advice of IC Markets or any form of personal or investment advice.
Any opinions, news, research, analyses, prices, other information, or links to third-party sites contained on this website are provided on an "as-is" basis, are intended only to be informative, is not an advice nor a recommendation, nor research, or a record of our trading prices, or an offer of, or solicitation for a transaction in any financial instrument and thus should not be treated as such. The information provided does not involve any specific investment objectives, financial situation and needs of any specific person who may receive it. Please be aware, that past performance is not a reliable indicator of future performance and/or results. Past Performance or Forward-looking scenarios based upon the reasonable beliefs of the third-party provider are not a guarantee of future performance. Actual results may differ materially from those anticipated in forward-looking or past performance statements. IC Markets makes no representation or warranty and assumes no liability as to the accuracy or completeness of the information provided, nor any loss arising from any investment based on a recommendation, forecast or any information supplied by any third-party.

US500 CHANNELHello friends
Given that the price is in an ascending channel, now that we have a strong wave to the channel ceiling, we have corrected the price by 50%, after which we can expect the price to succeed in hitting a higher ceiling again.
*Trade safely with us*

SPX to find sellers at previous resistance?SPX500USD - 24h expiry
Daily signals are bearish.
Short term bias has turned negative.
Previous resistance located at 5700.
20 1day EMA is at 5699.8.
5705.4 has been pivotal.
We look to Sell at 5699.5 (stop at 5743.5)
Our profit targets will be 5585.5 and 5565.5
Resistance: 5630.0 / 5658.9 / 5700.0
Support: 5602.4 / 5564.3 / 5495.3
Risk Disclaimer
The trade ideas beyond this page are for informational purposes only and do not constitute investment advice or a solicitation to trade. This information is provided by Signal Centre, a third-party unaffiliated with OANDA, and is intended for general circulation only. OANDA does not guarantee the accuracy of this information and assumes no responsibilities for the information provided by the third party. The information does not take into account the specific investment objectives, financial situation, or particular needs of any particular person. You should take into account your specific investment objectives, financial situation, and particular needs before making a commitment to trade, including seeking advice from an independent financial adviser regarding the suitability of the investment, under a separate engagement, as you deem fit.
You accept that you assume all risks in independently viewing the contents and selecting a chosen strategy.
Where the research is distributed in Singapore to a person who is not an Accredited Investor, Expert Investor or an Institutional Investor, Oanda Asia Pacific Pte Ltd (“OAP“) accepts legal responsibility for the contents of the report to such persons only to the extent required by law. Singapore customers should contact OAP at 6579 8289 for matters arising from, or in connection with, the information/research distributed.

Bearish reversal?S&P500 (US500) is rising towards the pivot which is a pullback resistance and could reverse to the pullback support.
Pivot: 5,684.31
1st Support: 5,508.29
1st Resistance: 5,768.80
Risk Warning:
Trading Forex and CFDs carries a high level of risk to your capital and you should only trade with money you can afford to lose. Trading Forex and CFDs may not be suitable for all investors, so please ensure that you fully understand the risks involved and seek independent advice if necessary.
Disclaimer:
The above opinions given constitute general market commentary, and do not constitute the opinion or advice of IC Markets or any form of personal or investment advice.
Any opinions, news, research, analyses, prices, other information, or links to third-party sites contained on this website are provided on an "as-is" basis, are intended only to be informative, is not an advice nor a recommendation, nor research, or a record of our trading prices, or an offer of, or solicitation for a transaction in any financial instrument and thus should not be treated as such. The information provided does not involve any specific investment objectives, financial situation and needs of any specific person who may receive it. Please be aware, that past performance is not a reliable indicator of future performance and/or results. Past Performance or Forward-looking scenarios based upon the reasonable beliefs of the third-party provider are not a guarantee of future performance. Actual results may differ materially from those anticipated in forward-looking or past performance statements. IC Markets makes no representation or warranty and assumes no liability as to the accuracy or completeness of the information provided, nor any loss arising from any investment based on a recommendation, forecast or any information supplied by any third-party.

US500US500 Price Action Analysis and Trade Setups (March 28, 2025)
Price Action Summary:
Weekly Chart: Long-term uptrend intact, but recent rejection near 6,200 signals a medium-term correction.
Daily Chart: Price is consolidating near 5,600 after a sharp drop from highs. Bearish momentum persists.
4H Chart: Lower highs and lower lows confirm short-term bearish bias. Resistance at 5,750 is holding.
1H Chart: Intraday range between 5,550 and 5,750. Price struggling to break higher.
Trade of the Day (Day Trading Setup)
Short Setup:
Entry: 5,700 after rejection at resistance
Stop Loss: 5,770
Take Profit:
TP1: 5,620
TP2: 5,550
Reason: Short-term bearish structure with resistance holding at 5,750.
Swing Trading Setup
Short Setup:
Entry: Below 5,550 after daily close confirmation
Stop Loss: 5,650
Take Profit:
TP1: 5,300
TP2: 5,100

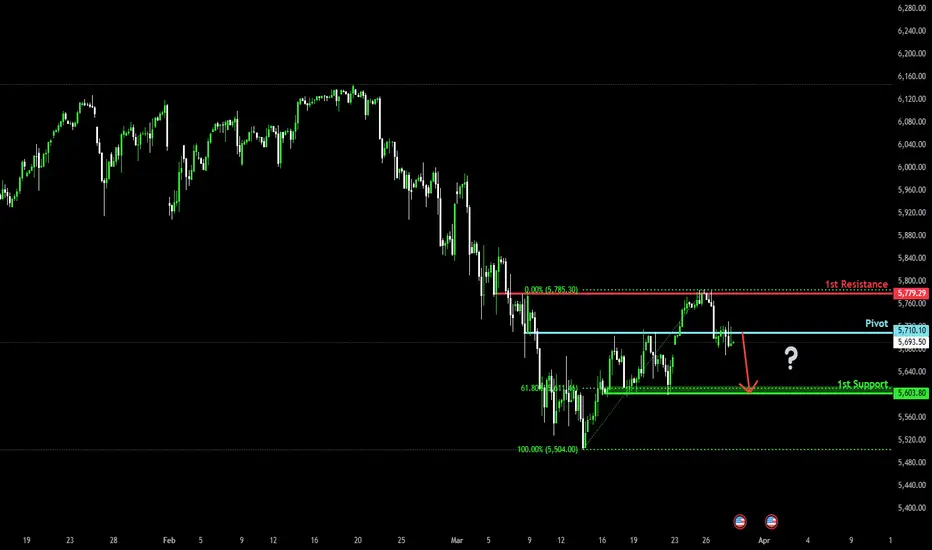
Bearish drop?S&P500 (US500) is reacting off the pivot which acts as a pullback resistance and could drop to the 1st support which has been identified as a pullback support.
Pivot: 5,710.10
1st Support: 5,603.80
1st Resistance: 5,778.29
Risk Warning:
Trading Forex and CFDs carries a high level of risk to your capital and you should only trade with money you can afford to lose. Trading Forex and CFDs may not be suitable for all investors, so please ensure that you fully understand the risks involved and seek independent advice if necessary.
Disclaimer:
The above opinions given constitute general market commentary, and do not constitute the opinion or advice of IC Markets or any form of personal or investment advice.
Any opinions, news, research, analyses, prices, other information, or links to third-party sites contained on this website are provided on an "as-is" basis, are intended only to be informative, is not an advice nor a recommendation, nor research, or a record of our trading prices, or an offer of, or solicitation for a transaction in any financial instrument and thus should not be treated as such. The information provided does not involve any specific investment objectives, financial situation and needs of any specific person who may receive it. Please be aware, that past performance is not a reliable indicator of future performance and/or results. Past Performance or Forward-looking scenarios based upon the reasonable beliefs of the third-party provider are not a guarantee of future performance. Actual results may differ materially from those anticipated in forward-looking or past performance statements. IC Markets makes no representation or warranty and assumes no liability as to the accuracy or completeness of the information provided, nor any loss arising from any investment based on a recommendation, forecast or any information supplied by any third-party.
Bearish drop?S&P500 (US500) is reacting off the pivot and could drop to the 1st support.
Pivot: 5,705.61
1st Support: 5,507.00
1st Resistance: 5,814.09
Risk Warning:
Trading Forex and CFDs carries a high level of risk to your capital and you should only trade with money you can afford to lose. Trading Forex and CFDs may not be suitable for all investors, so please ensure that you fully understand the risks involved and seek independent advice if necessary.
Disclaimer:
The above opinions given constitute general market commentary, and do not constitute the opinion or advice of IC Markets or any form of personal or investment advice.
Any opinions, news, research, analyses, prices, other information, or links to third-party sites contained on this website are provided on an "as-is" basis, are intended only to be informative, is not an advice nor a recommendation, nor research, or a record of our trading prices, or an offer of, or solicitation for a transaction in any financial instrument and thus should not be treated as such. The information provided does not involve any specific investment objectives, financial situation and needs of any specific person who may receive it. Please be aware, that past performance is not a reliable indicator of future performance and/or results. Past Performance or Forward-looking scenarios based upon the reasonable beliefs of the third-party provider are not a guarantee of future performance. Actual results may differ materially from those anticipated in forward-looking or past performance statements. IC Markets makes no representation or warranty and assumes no liability as to the accuracy or completeness of the information provided, nor any loss arising from any investment based on a recommendation, forecast or any information supplied by any third-party.

Heading into resistance?S&P500 (US500) is rising towards the pivot which has been identified as an overlap resistance and could reverse to the 1st support.
Pivot: 5,771.52
1st Support: 5,605.36
1st Resistance: 5,861.82
Risk Warning:
Trading Forex and CFDs carries a high level of risk to your capital and you should only trade with money you can afford to lose. Trading Forex and CFDs may not be suitable for all investors, so please ensure that you fully understand the risks involved and seek independent advice if necessary.
Disclaimer:
The above opinions given constitute general market commentary, and do not constitute the opinion or advice of IC Markets or any form of personal or investment advice.
Any opinions, news, research, analyses, prices, other information, or links to third-party sites contained on this website are provided on an "as-is" basis, are intended only to be informative, is not an advice nor a recommendation, nor research, or a record of our trading prices, or an offer of, or solicitation for a transaction in any financial instrument and thus should not be treated as such. The information provided does not involve any specific investment objectives, financial situation and needs of any specific person who may receive it. Please be aware, that past performance is not a reliable indicator of future performance and/or results. Past Performance or Forward-looking scenarios based upon the reasonable beliefs of the third-party provider are not a guarantee of future performance. Actual results may differ materially from those anticipated in forward-looking or past performance statements. IC Markets makes no representation or warranty and assumes no liability as to the accuracy or completeness of the information provided, nor any loss arising from any investment based on a recommendation, forecast or any information supplied by any third-party.

US500(UPDATE)Hello friends
Given the downward trend we had, the price has reached a good support area and if the area is maintained, you can enter a buy trade and move to the specified targets with it.
*Trade safely with us*

US500:UPDATEHello friends
We witnessed a price drop due to the price reaching an important resistance.
Now, buyers have entered an important support area and by maintaining the support area, we can see the specified price targets.
*Trade safely with us*

Bearish drop?S&P500 is rising towards the pivot and could drop to the 1st support.
Pivot: 44,428.26
1st Support: 43,846.79
1st Resistance: 44,809.04
Risk Warning:
Trading Forex and CFDs carries a high level of risk to your capital and you should only trade with money you can afford to lose. Trading Forex and CFDs may not be suitable for all investors, so please ensure that you fully understand the risks involved and seek independent advice if necessary.
Disclaimer:
The above opinions given constitute general market commentary, and do not constitute the opinion or advice of IC Markets or any form of personal or investment advice.
Any opinions, news, research, analyses, prices, other information, or links to third-party sites contained on this website are provided on an "as-is" basis, are intended only to be informative, is not an advice nor a recommendation, nor research, or a record of our trading prices, or an offer of, or solicitation for a transaction in any financial instrument and thus should not be treated as such. The information provided does not involve any specific investment objectives, financial situation and needs of any specific person who may receive it. Please be aware, that past performance is not a reliable indicator of future performance and/or results. Past Performance or Forward-looking scenarios based upon the reasonable beliefs of the third-party provider are not a guarantee of future performance. Actual results may differ materially from those anticipated in forward-looking or past performance statements. IC Markets makes no representation or warranty and assumes no liability as to the accuracy or completeness of the information provided, nor any loss arising from any investment based on a recommendation, forecast or any information supplied by any third-party.

US500 NEW PRICE !hello friends
As you can see, this index tried to break its ceiling 2 times, which faced correction, but in the third encounter, it succeeded in breaking the ceiling and was able to give this signal that the price can go up to 6200 or even higher.
*Trade safely with us*

S&P500 - Long from bullish OB !!Hello traders!
‼️ This is my perspective on US500.
Technical analysis: Here we are in a bullish market structure from 4H timeframe perspective, so I look for a long. My point of interest is imbalance filled + rejection from bullish OB.
Like, comment and subscribe to be in touch with my content!

US500 BUYhello friends
Considering that the price is in the ascending channel, we expect the price to move up to our target, which is the green line.
Or break the specified support and start moving from the bottom of the channel.
*Trade safely with us*

S&P500 - Short after BOS !!Hello traders!
‼️ This is my perspective on S&P500.
Technical analysis: Here we are in a bearish market structure from 4H timeframe perspective, so I look for a short. We have hidden divergence for sell on H4 and regular divergence on H1, so after BOS I will open a short.
Like, comment and subscribe to be in touch with my content!

Bearish drop?S&P500 (US500) is rising towards the pivot and could drop to the 1st support which acts as a pullback support.
Pivot: 5,979.20
1st Support: 5,818.18
1st Resistance: 6,113.40
Risk Warning:
Trading Forex and CFDs carries a high level of risk to your capital and you should only trade with money you can afford to lose. Trading Forex and CFDs may not be suitable for all investors, so please ensure that you fully understand the risks involved and seek independent advice if necessary.
Disclaimer:
The above opinions given constitute general market commentary, and do not constitute the opinion or advice of IC Markets or any form of personal or investment advice.
Any opinions, news, research, analyses, prices, other information, or links to third-party sites contained on this website are provided on an "as-is" basis, are intended only to be informative, is not an advice nor a recommendation, nor research, or a record of our trading prices, or an offer of, or solicitation for a transaction in any financial instrument and thus should not be treated as such. The information provided does not involve any specific investment objectives, financial situation and needs of any specific person who may receive it. Please be aware, that past performance is not a reliable indicator of future performance and/or results. Past Performance or Forward-looking scenarios based upon the reasonable beliefs of the third-party provider are not a guarantee of future performance. Actual results may differ materially from those anticipated in forward-looking or past performance statements. IC Markets makes no representation or warranty and assumes no liability as to the accuracy or completeness of the information provided, nor any loss arising from any investment based on a recommendation, forecast or any information supplied by any third-party.
