Volume Trading Indicator ✅✅✅✅ Volume is an important indicator in technical analysis because it is used to measure the relative significance of a market move. The higher the volume during a price move, the more significant the move and the lower the volume during a price move, the less significant the move.
✅ Volume indicators are technical tools to evaluate a security's bull and bear power. Most look specifically at buying vs. selling pressure to determine which side is in control of price action. Others attempt to identify emotions that are moving the security at a particular time.
✅ A high positive multiplier with high volume indicates strong buying pressure which pushes the indicator higher. On the other hand, a low negative number with high volume indicates strong selling pressure which pushes the indicator lower.
✅ Down volume indicates bearish trading, while up volume indicates bullish trading. If the price of a security falls, but only on low volume, there may be other factors at work aside from a true bear turn
Do you use Volume Trading Indicator ?
US500SHORT

VIX SHORTS ✅✅✅VIX shorts into 30.00 as i expect the flow of the markets into RISK ON assets meaning the volatility will go down.

S&P500: Selling On A Pullback 8-3-22 S&P 500 – Cash: Selling A Pullback Into The Range Of Bearish Fakey Setup
Price Action: There is no new price action signal to note at this time.
Price moved lower from the recent Bearish Fakey Setup that had formed, mid-last week.
Price broke and closed under the 4245 – 4270 prior key support area.
Price briefly moved higher from the prior Bullish Pin Bar signal that had formed, over a week ago (We did not consider trading this signal as it had formed just under the short-term resistance area and against the recent short-term Bearish trend).
Potential Trade Idea 1: For more aggressive traders, we are considering selling if price pulls back to within the range of the recent Bearish Fakey setup, with risk management above the Fakey Bar.
Potential Trade Idea 2: We are still considering selling on a retracement higher and only after clear price action signal, whilst price remains below the 4484 – 4494 resistance area.

US500 LONGS 📉📉📉📈 Expecting bullish price action on US500 as price takes out weekly lows, and has a lot of liquidity that has been build on the trendline. Looks to perfect to be true, a bullish closure above weekly low will be perfect for me to confirm the entry.
What do you think ?

EURAUD SHORTS 📉📉📉📉 I provide you in this example the market sentiment on EURAUD, during the last 2 weeks the RETAIL HEARD was LONG on this pair, i am sure they tried to catch the BOTTOM there.
A lesson for you never trade in the direction of the retail heard if you want to have a high probability trade.
If the retail heard is LONG on EURAUD you have to look only for shorts and avoid LONGS, very simple and good lesson to know.
Do you trade with market sentiment ?

Three White Soldiers Candlestick ✅✅✅Three white soldiers is a bullish candlestick pattern that is used to predict the reversal of the current downtrend in a pricing chart. The pattern consists of three consecutive long-bodied candlesticks that open within the previous candle's real body and a close that exceeds the previous candle's high.
🎯 To identify the three white soldiers pattern, look for three consecutive green or white candlesticks. Each must open and close progressively higher than the first. The candlesticks should have big bodies and very small (or no) wicks. As mentioned, you are likely to see the pattern at the bottom of a downtrend.
✅ What Do Three White Soldiers Tell You?
The three white soldiers candlestick pattern suggests a strong change in market sentiment in terms of the stock, commodity or pair making up the price action on the chart. When a candle is closing with small or no shadows, it suggests that the bulls have managed to keep the price at the top of the range for the session. Basically, the bulls take over the rally all session and close near the high of the day for three consecutive sessions. In addition, the pattern may be preceded by other candlestick patterns suggestive of a reversal, such as a doji.
✅ Limitations of Using Three White Soldiers
Three white soldiers can also appear during periods of consolidation, which is an easy way to get trapped in a continuation of the existing trend rather than a reversal. One of the key things to watch is the volume supporting the formation of three white soldiers. Any pattern on low volume is suspect because it is the market action of the few rather than the many.
To combat the limitation of visual patterns, traders use the three white soldiers and other such candlestick patterns in conjunction with other technical indicators like trendlines, moving averages and bands. For example, traders may look for areas of upcoming resistance before initiating a long position or look at the level of volume on the breakout to confirm that there was a high amount of dollar volume transacting. If the pattern occurred on low volume with near-term resistance, traders may wait until there is further confirmation of a breakout to initiate a long position.
Was this information valuable ?

US500, Sell the highs, Bear market It's rangebound. Sell the highs. Expecting it to test lows before it goes to 4400

s&p500 may drift to 3740This is an updated version of my previous post on SPX index, on the basis of Elliott wave analysis
after breaching of 4196 ,the fifth wave is going to extend further up to a maximum of 3740.before march end 2022
traders can open shorts near 4280/4300levels on monthly PUTS, but strict stop loss 4340 ,(disclaimer, trading at your own risk, pl, verify with your advisor)

S&P 500 SELL - 3 DRIVE PATTERN#US100 OR S&P 500 is expected to sell to complete the 3 drive pattern at 1.272 fib extension
after touching 61.8fib of previous swing retracement

S&P500 SHORT OF NUC WEAPEN THREAThi
we all have seen the ukrainenand russian war. gold had a massive spike because of panic in the markets.
i believe that the us500 wil go short because of the nuclear weapen threat from russia. trade wisely and manage youre trade. goodluck !

S&P500 - "Fear Index" Singals ShortVIX9D crossed yesterday VIX30D, 3M and 6M. In addition, the price is bouncing off EMA 200. Signal for a potential short. If you pick short set Stop-loss above Ema 200 to close the position in case price goes up.
________
🚀 Follow for daily posts
🎯 About my posts: They are kept self-explanatory to avoid overcomplicating. Mostly price signals and trend analysis combined with chart patterns.
Disclaimer: This is not an investment advice

US500 SELL STRATEGYHi,
These are my opinions and may be wrong.
US500 going down to 4000 level, to the pink trend line.
It is will be oversold there and I expect an upward movement after touching the pink line.
But the market may want it to go down to 3400 level.
Wish you good luck

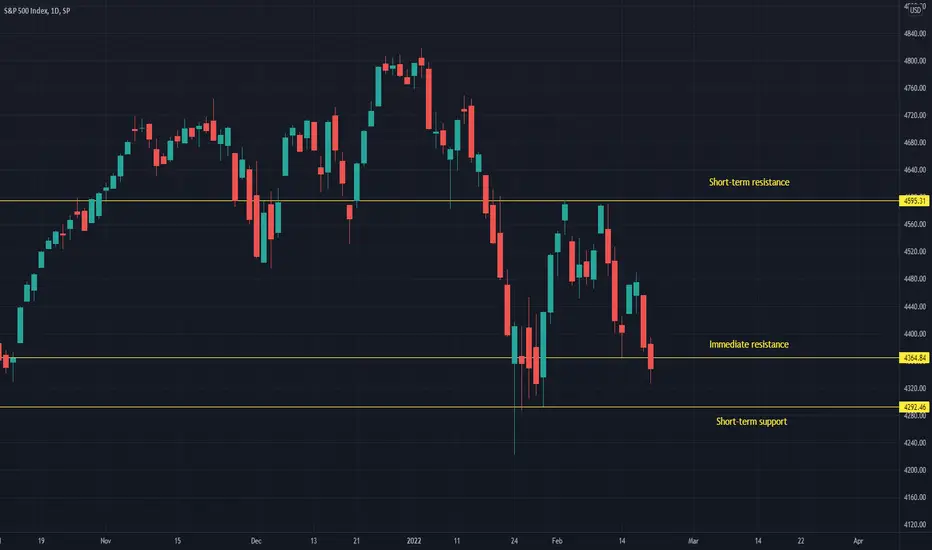
SPX - We expect more weakness ahead of the FOMCWe turn bearish on SPX as the FED meeting is less than a month away. We expect elevated volatility and weakness to continue ahead of the meeting. At the moment, we actually think it is very likely that weakness will remain persistent even after the FED meeting and interest rate hike. In our opinion, higher interest rates in the U.S. pose a substantial threat to further rise of SPX in short-term, medium-term as well as long-term. Our change of view is supported by recent failure of major U.S. indices to reverse to the upside. In addition to that, a change in technical indicators from neutral to bearish also supports our thesis. Because of that we would like to set a new short-term price target for SPX to 4 292 USD; we would also like to set a medium-term price target to 4 222 USD.
Illustration 1.01
Picture above shows the daily chart of SPX and its RSI. We expect the price to reach a new low below 4 222.62 USD. Meanwhile we expect RSI to reach a higher low in comparison to its recent low on 27th January 2021 (which was equal approximately 24 points).
Technical analysis - daily time frame
RSI failed to break its medium-term bearish structure. Stochastic continues to decline which is bearish. MACD reversed to the downside which is bearish as well. DM+ and DM+ also show bearish conditions in the market. ADX shows relatively flat movement which reflects recent choppy price action in the SPX. Overall, the daily time frame is bearish.
Technical analysis - weekly time frame
RSI continues to develop bearish structure. Same applies to MACD and Stochastic. DM+ and DM- are bearish too. ADX increases which suggests the prevailing trend is regaining momentum. Overall, the weekly time frame is bearish.
Support and resistance
Short-term support coincides with our short-term price target of 4 292 USD. Support 1 coincides with our medium-term price target of 4 222 USD. Short-term resistance lies at 4 595.31 USD and Resistance 1 sits at 4 748.83 USD. The major resistance level can be found at the all-time high value of 4 818.62 USD.
Please feel free to express your own ideas and thoughts in the comment section.
DISCLAIMER: This analysis is not intended to encourage any buying or selling of any particular securities. Furthermore, it should not serve as a basis for taking any trade action by an individual investor. Your own due diligence is highly advised before entering trade.
s&p 500 recovery over, ready to test low again(4196)Today SPX completed its recovery(xx) after its wave 'Y', note that it has not penetrated inside wave 'W' territory.
wave 'Y' extended beyond 1.62% of wave 'W',
Hence as per EW rule one more wave 'Z' to unfold which has a definite relationship (between 62% or 162%)of wave 'W'.
Lets open our shorts,keeping stop loss 4582
Trading with minimum stop loss, conserve our capital in case of extension of wave 'xx'

📍 Trading Styles 📍 Trading Styles
There are a lot of strategies and types of traders and investors in the financial markets, this doesn't mean you have to learn all of them. In my opinion you should try all trading types and then conclude which one suits more to your personality becuase there is no such thing as you HAVE TO trade intraday or swing or position, everything depends strictly on you.
✅ Scalping Traders
Holding positions for several minutes, in my opinion its not recommended for the newbies as you will see a lot of losses and wins during the day and this can hurt your emotions.
✅ Day Traders
Holding positions for couple hour or a day, they basically when to know ar the end of the day If they made money or not. Same recommendation as for scalping
✅ Swing Traders
Holding positions for a several days, intra-week trading. This is the recommendation for the newbies as you dont get the market feedback really fast and you can counter emotions + overtrading, usually they take 4-5 trades during the trading week.
✅ Position Traders
Holding positions for several weeks, usually this type of traders trade on a weekly-monthly basis with a focus on the fundamental analysis more than on the technical side. Recommended for experienced traders as you can get big returns with a iron patience
What type do you like or want to be ?

Why 90% of Traders Lose ? ❌ Going Full Margin
Risk management is the most important in this game because it keeps you alive, keeps your account fresh during bad market conditions.
Learn risk management first to understand how to protect your capital first of all and then learn a strategy
You have to know your risk numbers in terms of
• Risk per trade
• Daily Drawdown Limit
• Weekly Drawdown Limit
• Monthly Drawdown Limit
✅ Buying SIGNALS
Buying signals and expecting overnight succes could be bad for your trading journey, don't expect anything from anybody and start to be your signal generator
✅ Get Rich Quickly
Trading business its not getting rich overnight, its getting rich for sure on a long term basis. Don't expect succes overnight its not gonna happen i promise you.
• Trading is a marathon, not a sprint. Give it time and simply commit to the process
✅ Not Sticking to the Plan
Your trading plan is your trading bible and principles, you should respect it no matter what. Your trading plan its the only thing you can control in the markets as you can't control the price movement.
Make the plan and trade the plan.
What do you think ?

The ART of profit booking I am posting a chart for educational purpose using S&p 500 index with heikinAshi candle and elliott waves
trading is an art of buying at low and selling at high, looks easy to do? if so why more people loosing and big players minting money?
trading is a money making process when the crowd has extreme interest in one direction(buy /sell).
when everyone in the street is buying, it is the RIGHT time to sell.
The ART of profit booking without harming buyers(they don't know what's happening) is described in the chart.
Because if they knew in advance then to whom the seller has to sell?
Actually speaking the BULLS AT THE BEGINING OF THE TREND NOW BECOME BEARS!
SELVAM BE, MBA
option trader

Excuses Excuses Excuses! Possible bearish scenario for US indexThanks to everyone that has been supporting my ideas so far. I keep positive about the short position on Tesla Inc. I had mentioned earlier this week, while the look out on Apple might change (probable short). Anyway, yesterday, the S&P 500 has closed the week down 2% to close below the 200 MA. It has not only created a double top, breaking down on higb volume, but it has also been unable to break the resistance level, which might point at a dead cat bounce. So, I believe the major correction we have been waiting for since the beginning of Covid for this "overvalued" market may be starting, for one reason or the other, whether Russian threats or hedge funds and CEOs liquidating their long positions. In fact, I believe the FED might be more involved in this "crash" than we think where they are interested in actively crashing using Russian-Ukraine escalations as possible excuses, I will explain my idea later on in another post appropriately titled.
However, consider that if price is able to recover and be supported above the 200 MA and break the most recent high (4585), then there may be a change of sentiment and this idea would be irrelevant. For now, I would keep short and wait for another correction. GET THE CASH READY.
NOT FINANCIAL ADVICE!

The Bigger Picture on the US100 Hey guys, If you have seen my most recent posts you wont be surprise to see I'm bearish on the markets and have been for some time. With market valuations out of whack, Ungodly like debt in Government, cooperate, and leverage used by traders, 40% of all the US currency printed in 2020-2021 but production at an all time low causing inflation we haven't seen since the 80s and i feel will get even worse and lastly The Fed having to stop its purchases and tighten policy with interest rate hiking probably faster then the market was pricing in. This is a giant bubble with some gaint problems they will send it falling at least in my estimate 40% but trend is even further at 57%. Obviously I dont think it will sink like a rock there and we will have some rebounds but as the fed keeps tightening and i think its safe to assume funds and firms will go bust they will send it back down further and further. Although this is gloomy I don't think its financial collapse, once inflation is taking care of and the excesses of finance have been washed away they market will be set for another massive decade long bull market with growth prospects for the world coming from India, Australia, Mexico and all over Africa.
My plan for this year and next is to watch the FED on interest rate hikes and statements and also inflation numbers, Watch Silver/gold this usually head south first and recover first and when the market starts the recover gold/silver will skyrocket to the moon. and Watch debt levels for both Governments and cooperate, Picking company that have low debt levels now that can take the opportunity that will come will massively improve your longer term portfolios.
keep up to date with my trades by following and liking the post.

BOS - BREAK OF STRUCUTRE ✅✅✅🎯 WHAT IS BOS ?
BOS - break of strucuture. I will use market strucutre bullish or bearish to understand if the institutions are buying or selling a financial asset.
To spot a bullish/bearish market strucutre we should see a higher highs and higher lows and viceversa, to spot the continuation of the bullish market strucuture we should see bullish price action above the last old high in the strucutre this is the BOS.
🎯 BOS for me is a confirmation that price will go higher after the retracement and we are still in a bullish move
Kindly see attached photos

NEO wave projects below 4000 in SPXA clear text book like Elliott wave counts shows that on going ''C'' wave correction will bring this index to below 4000 levels before march'22
I appreciate if any TA tool tells this story.

US500 LONGS 📉📉📉Expecting bullish price action on this pair as price is in a bullish trend on a HTF, taked out liquidity below 4300 closed above bullish, retraced to fill the bullish imbalance and right now we are going higher for the w1 imbalance and 4700. This is a swing entry so please remember it will take some time to capitalise
What do you think ? Comment below..

S&P500 BULLS WILL GET A BEAR HITAs WXYX waves are compressed in an ENDING DIAGONAL , the result of over anticipation ( Euphoria) is favourable to BEARS .
This index is ready to fall from 4th jan for its wave''C''.as per NEO WAVE time cycles
The ongoing wave has 5 subdivisions in a ''CLASSIC ELLIOTT WAVE'' Pattern, which is easy to Trade in OPTIONS
4645 is the first target for BEARS to HIT the BULLS
B SELVAM BE MBA
OPTION BUYING COACH
