US500SHORT

US Market Technicals Ahead (08 Mar – 12 Mar 2021)President Biden’s $1.9 trillion coronavirus aid bill was passed by the Senate on Saturday and sent back to the House for approval which will take place on Tuesday. Investors will be closely watching the progress of this aid bill through Congress this week against a backdrop of concern over what such a large stimulus package could do to inflation and interest rates. Market participants will also be focusing on U.S. inflation figures with a report on the consumer price index due out on Wednesday and the producer price index scheduled for Friday. In Europe, the European Central Bank will hold its latest policy meeting on Thursday.
Here’s what you need to know to start your week.
S&P500 (US Market)
The benchmark index ($SPX) reversed most of its losses in late Friday to end up +0.83% in a sign some bargain-hunters may have already swooped in after a bumpy week. This comes after $SPX decline over -3.55% in three consecutive session.
At the current development (since last week’s highlight on the structural breakdown of $SPX)
Price Action remains below 20DMA
Price Action remains below 50DMA
Price Action is resisted at lower band of 4 Months uptrend channel
Further increase of implied volatility since 16th Feburary 2021
$SPX has a short term establishment of Lower Highs and Lower Lowers for a short term consolidated downtrend channel of 100 points range
At the current junction, $SPX remains bullish at a mid-term higher low. Further signs of weakness in this correction will require $SPX to breach its immediate support level at 3,720.
Immediate resistance for $SPX is currently at 3,915, a breakout of its short term downtrend channel.
Stimulus: a double-edged sword?
The pandemic relief package will give a powerful boost to the economic recovery and to the stock market, but optimism has been offset by fears over rising inflation and interest rates.
Investors have taken the recent run-up in bond yields – which has propelled the benchmark 10-year Treasury yield to levels not seen since before the pandemic – as a sign of potentially damaging inflation expectations.
But U.S. Treasury Secretary Janet Yellen indicated Friday that higher long-term Treasury yields were a sign of expectations for a stronger recovery, not of increased inflation concerns.
U.S. inflation figures
Investors will be closely watching U.S. inflation figures on Wednesday and Friday amid worries over the potential implications of rising price pressures.
Last week Fed Chairman Jerome Powell said that even if prices jump as anticipated this spring, “I expect that we will be patient,” and not change monetary policies that need to remain supportive until the economy is “very far along the road to recovery”.
ECB meeting
Thursday’s ECB meeting is the main event for the euro zone after extended lockdowns in the first quarter. Policymakers will assess the damage to economic growth against a background of a vaccination rollout that is struggling to gain traction, particularly compared with similar efforts in the UK and the U.S.
ECB head Christine Lagarde will also announce the bank’s new quarterly forecasts at the post policy meeting press conference.
Besides the ECB meeting, the euro zone will release figures for January industrial production on Friday, which are expected to contract.

US5001. Down trend channel, nearly at the to of the channel. 2. looking for rejections of that resistance

Lovely Trade💸Hurray, wolves🔥
Here we have a new formation with breakout support zone.
There could be 2 possible scenarios.
First, the price may continue to fall without any corrections.
Second, the may enter into the deep correction and retest the level.
So follow the chart and look for the entering point carefully.
If you enjoy my FREE Technical Analysis , support the idea with a big LIKE👍 and don't forget to SUBSCRIBE my channel, you won't miss anything!
Feel free to leave comments✉️
And always remember: "we don't predict, we react".

Short call for us500 4-8 hr trade idea Short call on US500 70 pip goal from entry, stop loss 20 pips

US500 - Big Short Wave on the TsunamiI have been waiting for this decisive moment for a long time.
Please refer to my chart for consideration.
This is not financial advice
~~~~~~~~~~~~~~~~~~~~~~~~~~~~~~~~~~~~~~~~~~~~~~~~~~~~~~~~~~~~~~~~~~~~~~~~~~~~~~~~~~~~~~~~~~~~~~~~~
Above is my personal opinion, I do not encourage anyone to follow suit, please manage your money, Good luck!
Xin Liar

US Market Technicals Ahead (8 Feb – 12 Feb 2021)All three US major averages finished the week in the green, with each posting its best week since November 2020 as fears of the short-squeeze in a handful of stocks leading to broader market contagion subsided. Investors will be focusing on earnings and the prospects for a hefty new coronavirus relief package in the week ahead. Markets will also be watching the latest consumer price inflation numbers on Wednesday amid expectations for an uptick as the economic backdrop improves and the vaccine roll-out gains momentum.
Here’s what you need to know to start your week.
S&P500 (US Market)
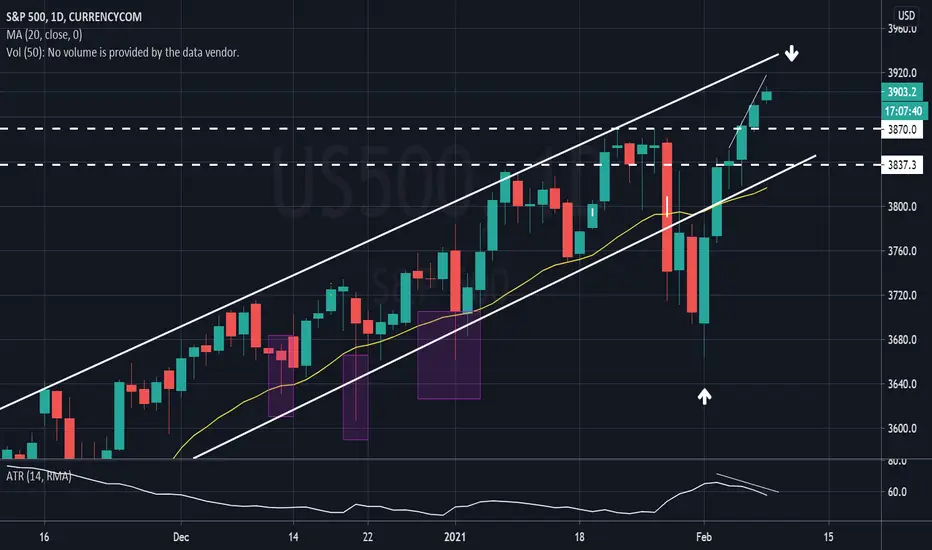
The benchmark index ($SPX) kicks off the month of Feburary with a weekly gain of +5.03%, the best week of the index since November 2020. This rally not only fully recovered the correction from the initial week, but it also established a new all time high for $SPX at 3,895 level. Additionally, $SPX is now back above its 20DMA, along with the consolidated Trend Channel highlighted last week.
At the current junction, the week’s rally of $SPX have exhibited a Bearish Divergence pattern; as the daily rally of $SPX is accompanied with a volume exhaustion. The first signs of weakness in this rally will require a re-test of all-time high resistance turned support at 3,870.
1. Earnings
Better-than-expected corporate results so far in the fourth quarter have driven up analysts’ expectations, and S&P 500 ($SPX) companies are on track to post earnings growth for the period instead of a decline as initially expected. Upcoming U.S. reports in the week ahead include Cisco Systems ($CSCO), Twitter ($TWTR), General Motors ($GM), Pepsi ($PEP), Coca-Cola ($KO), AstraZeneca ($AZN) and Walt Disney ($DIS).
Upbeat earnings along with stimulus talks and progress on the vaccine rollout boosted equities last week, with the S&P 500 and the Nasdaq recording their largest weekly percentage gains since the U.S. elections in early November.
Upbeat fourth-quarter results would bolster expectations for a strong rebound in earnings in 2021 and help to ease investor worries that valuations are overstretched.
2. Stimulus
U.S. President Joe Biden’s push for his $1.9 trillion COVID-19 relief package gained momentum on Friday after the U.S. Senate narrowly approved a budget blueprint allowing Democrats to push the legislation through Congress in coming weeks with or without Republican support.
Republicans have proposed a $600 billion aid package, less than a third the size of the Democratic plan.
Congressional committees are set to start drawing up legislation this week and Speaker Nancy Pelosi has predicted the final legislation could pass Congress before March 15, when special unemployment benefits that were added during the pandemic expire.
Data on Friday showing a smaller-than-expected rebound in the U.S. labor market in January underscored the need for more stimulus to bolster the economy.
3. Inflation data
Market watchers will be paying close attention to Wednesday’s CPI data amid growing expectations that an uptick in inflation could be larger and longer lasting than the Federal Reserve is currently anticipating.
U.S. Treasury investors are betting on rising inflation as the U.S. economy returns to more normal levels in the second half of this year, after contracting at its deepest pace since World War Two in 2020.
The prospect of a new coronavirus relief package is adding to inflation expectations.
Meanwhile, Fed Chair Jerome Powell is to speak about the labor market on Wednesday at a webinar hosted by the Economic Club of New York. Thursday’s figures on initial jobless claims will also be in focus.
S&P 500 to Short in due time?Observing market channel, you can see market may be reaching the top of it's peak soon and a good drop should follow after this.
Stay out of buys unless short term trading and look for sell confirmations for a big drop probably sometime in a couple of months.
Trade at your own risk..


SHORT us500 130+pips=1,300ticks tp1-4 setrunning demo but thought it would be cool to follow up for fun lets go! 50% track debut. lets see how it plays

Long Setup for US500 (SPY, ES, MES)Short term Long Setup for US500
A simple but effective technical analysis using tops and bottoms with scale in strategy.
Scaling refers to the trading strategy of buying multiple orders at different prices so as to limit the impact of putting in one big order.

SPX500USD UPDATEFOLLOWING OUR PREVIOUS IDEA OF A SUBWAVE 4 TO WAVE 5, WE SEEM TO BE ENDING THE BULLRUN AND ENTER ANOTHER CORRECTIE PHASE, WITH DISTRIBUTION (MANIPULATION OF HIGHS) BUILDING UP AND A ENDING DIAGONAL OF THE SUB WAVE 5. THE DECLINE START OR CONTINUE FROM THE NEW YEAR. TRADE SAFE AND HAPPY COMING HOLIDAYS


US500 - S&P500 - Sell Time - H4 ChartUS500 - S&P500 - Sell Time - H4 Chart
Blue Lines are important levels, may pull back to test highs, then down
Look for Selling Opportunities
Please support the idea with a Like 👍
Follow me to receive updates of this analysis, plus new ideas ✅
Thank you for your support 😊
Wishing you successful trading 🙏
------------------------------------------------------------------------------------
🔺 Disclaimer! The content of this analysis is subject to change at any time without notice.
🔺 It is provided for the sole purpose of assisting traders to make independent investment decisions.
🔺 You must do your own research to create your own trading plan for the market.
------------------------------------------------------------------------------------


US500 3541.1 - 0.32 % SHORT IDEA * CORRECTION AND PRICE ACTIONHey everyone
A look at the S&P 500 that is currently trading is a bear flag looking for a break below of the structure, the index rallied up with the bull and was bound to correct this move to complete that big gartley pattern so previous swing lows will be our targets and guided by the fibonacci levels a break above of structure will change the whole trading plan.
As always higher time-frames for direction and whats happening in the overall chart and lower time-frames for entry opportunities.
LET'S SEE HOW IT GOES..
HAPPY TRADING EVERYONE & LET THE WINS RUN...
_________________________________________________________________________________________________________________________
ENTRY & SL - FOLLOW YOUR RULES
RISK-MANAGEMENT
PERIOD - SWING TRADE
__________________________________________________________________________________________________________________________
If this idea helps with your trading plan kindly leave a like definitely appreciate it.

us500 short call then possibly following up with a reversal Us500 call is based on some analysis ive been back testing based on the 50% update the reversal will be around that price area then the buy back up lets see

S&P500 ShortIf the daily candle closes below the upper trend line we would like to short with confirmed price action on lower timeframes.

