SPX500 SHORT for ABCD COMPLETIONLooking at a short off Right Shoulder H&S Pattern
Looking to hold at Minimum ABCD pattern completion C-D Leg
US500SHORT

US500...SHORT (105 points)[b ]Due to the increasing strength of the USd as a result of the increase yield....still looking on to the short of stocks (indices).
US500 experienced a rallied up for sometime, and what everything that goes up surely comes down!!!
NB: Red box: rejection zone


SPX500 ! very bullish make new higher high!After news, the dollar fell sharply, which had a significant impact on price increase. Traders are very interested buy, price has strongly broken of key zones, looks likely to up 4350 or 4470.

SPX may test 3887A very simple Elliott wave chart shows the price action of SPX index so far.
since wave 'c3' extended beyond 1.618 times of wave 1, there must be a final wave (c5).
if 'c5' ends @3887 (0.62%of c1),that will be the end of correction. let's see...

Max Pain for SPX NDX MarketsLooking at the NDX for this example, clear defined downward trend with BIG bear market rallies. this is seems to be a little different with some positive news and lack of bad news so has been highly rewarding for the bulls however we are now at some big resistances.
- 50 moving average on Weekly
- Trend line resistance
- 61 fib of previous move down
- 20% down from top mark which is technical bear market so reacting off this level is good for bears imo.
next peice of news is only around the corner, lots of macro happening behind the scenes. I'm taking a short position at 13400.
just move down RSI indicator has no relevance here.*

SPX Double Top Rejection @ 4144 - SPX500 SHORT 2 HR CHARTAll the earnings and FED news is out so we “” buy the rumour and sell the fact ….””
1 - Looks like 4144 a small double top.
2 - Oscillators divergence BEARISH – Not supporting the new highs…
3 - Both tops followed by Large engulfing RED CANDLES
4 - MACD - BEARISH signal
5 -VWAP - Held on the retracement
6 - FIB levels are the current support
Will trade this to the short side once it breaks below 4090

US 500 Index Short Selling TargetThere is a bearish head and shoulder pattern identified on US 500 Index. Setting shortselling target to 4030.

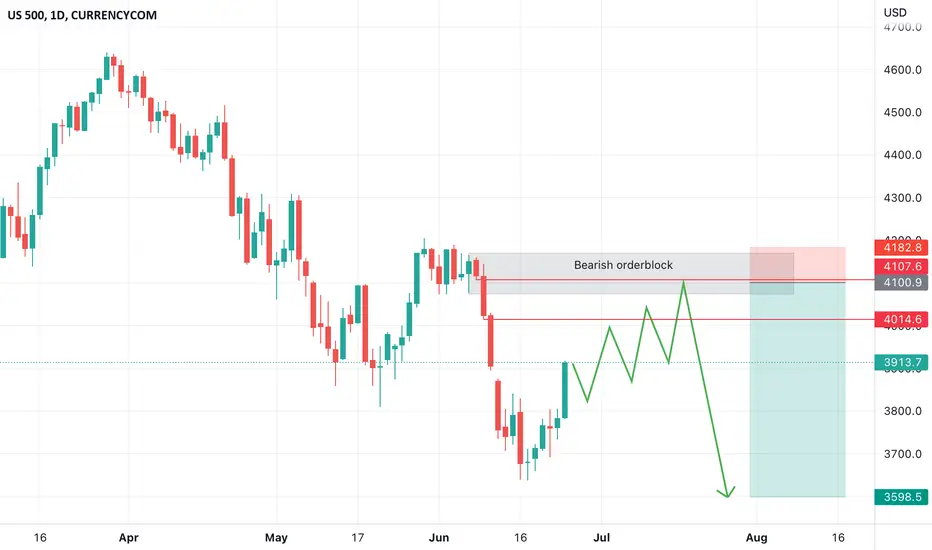
SHORT S&P500 ✅✅✅Hello traders!
✅ This is my trade on US500 .
Here we are in a bearish market structure, so I am looking only for shorts. I expect bearish price action from here as price filled perfectly the imbalance and rejected from bearish orderblock.
Like, comment and subscribe to be in touch with my content!

SHORT US5003990 zone should be hard to break. 2 possibles trend lines that converge to the same point. Could be forming some kind of HSH, with second H going down close to 3480, or going lower close to 3330

Defending the TRIPLE top - 3940 ALAMO must holdThere are lies – damn lies and then there are statistics…
There are charts – then there are Fibs – and Pitchforks --
Then there are Tea Leaves…
When no more indicators support your position -
No longer timeframe to support your losing position - then the decades chart?
Finally get out the colouring book and make it pretty
Anyhow
Holding short the 3900 Triple Top
Overbought and Divergence on the oscillators
In the face of
Poor EPS numbers on the Techs - I bad AAPL will ruin the whole bunch
GDP number next week for 2nd quarter GDP) is 2 negative numbers in row and that makes the recession official
FED Hike next week – and JPOW will explain why SEPT will need another so the landing will be nice and soft
Here is hoping I do not get stopped out ......

short spx500 The reason is very simple the price opens below pivot points and moving average which shows me that sellers are still in power plus cluster algo gives me signal to sell

SHORT S&P500 ✅✅✅Hello traders!
✅ This is my trade on US500.
Here we are in a bearish market structure, so I expect a new expansion after the price filled the imbalance and rejected from bearish orderblock. As target I have sell side liquidity below old low.
Like, comment and subscribe to be in touch with my content!

SPX - SHORT ON CLOSE OF 2 HOUR - RESISTANCE 3910 - 3930Same Idea Yesterday - It Stands... Jobless number drove up yields. Stocks shook it off. 10 year is over 3%. Maybe CPI next week will be over 8% and finally knock this down. RSI and Oscillators all over bought and that resistance of 3920 holds since MAY.
Double Top
Will follow the FIB/Fan lines down

US500 SellsIn TECHNICAL ANALYSIS .
US500 Show a clear Order Block on 4 Hour.
Confluences which validates this order block are as follows:-
1. It has broken structure.
2. Lies with in Premium Supply.
3. Their is in efficient Price Action( Imbalance filled).
4. Mitigated Order Block.
5. Liquidity Taken.
EVERYTHING COOL RIGHT..... Trade Safely.
.
.
More PIPS to come.


US500/SPX enters into a bear market The last time this happened was in 2018 but the market some how management to rally which resulted in a false breakout.
In 2020 the market came back to this level and spiked around this area before turning into an almost 2 year rally.
2007 was a different story as market broke structure and the result was a sell of that lasted one year.
What will happen in 2022? Will the bulls take control and result in the SPX hitting another all time high.
Or will we see similar events of what happened in 2007 which resulted in a huge sell off that one year.

SPX - Headed lower in tandem with the Nasdaq 100 indexWe are bearish on the SPX as we expect more weakness in the U.S. economy. Our view is based upon the combination of bearish fundamental and technical factors. Accordingly, we would like to set a new price target for SPX at 3750 USD and 3500 USD.
Technical analysis - daily time frame
RSI is bearish. Stochastic and MACD are turning bearish. DM+ and DM- are bullish. Overall, the daily time frame is bearish.
Technical analysis - weekly time frame
RSI, MACD, Stochastic, DM+, and DM- are all bearish. Overall, the weekly time frame stays bearish.
Please feel free to express your ideas and thoughts in the comment section.
DISCLAIMER: This analysis is not intended to encourage any buying or selling of any particular securities. Furthermore, it should not be a basis for taking any trade action by an individual investor. Therefore, your own due diligence is highly advised before entering a trade.

⁉️ S&P500 (US500) - Market AnalysisHello traders!
⁉️This is my analysis on US100 .
Here we have the same scenario as on US30 and US100, as they are moving pretty the same. Expect the price to fill the imbalances and to reject from bearish orderblock.
Like, comment and subscribe to be in touch with my content!
S & P 500: Selling On A RetracementS & P 500 – Cash: Selling On A Retracement
Price Action: Price moved higher from the Bullish Pin Bar + Inside Bar (Combo Setup) that had formed late last week (We did not consider trading this setup, nor did we mention it).
Price moved higher from the recent ultra-small Bullish Tailed Bar Signal that had formed over a week ago (We did not consider trading this signal).
Potential Trade Idea: We are considering selling on a retracement higher and after a price action sell signal, whilst price remains below the 4100 – 4205 key resistance area (Event Area).

Jamie Gun2Head Idea - Selling SP500Trade Idea: Selling SP500
Reasoning: Running into resistance level, time for the sellers to step in
Entry Level: 3821
Take Profit Level: 3643
Stop Loss: 3858
Risk/Reward: 4.81:1
Disclaimer – Signal Centre. Please be reminded – you alone are responsible for your trading – both gains and losses. There is a very high degree of risk involved in trading. The technical analysis , like all indicators, strategies, columns, articles and other features accessible on/though this site is for informational purposes only and should not be construed as investment advice by you. Your use of the technical analysis , as would also your use of all mentioned indicators, strategies, columns, articles and all other features, is entirely at your own risk and it is your sole responsibility to evaluate the accuracy, completeness and usefulness (including suitability) of the information. You should assess the risk of any trade with your financial adviser and make your own independent decision(s) regarding any tradable products which may be the subject matter of the technical analysis or any of the said indicators, strategies, columns, articles and all other features.

SPX500 SHORT Trend ContinuationLooking for the 500 to Grab Liquidity to the Downside with one more sweep of the Lows... Looking to see a longer-term play on this through the week...

S&P 500 Weekly AnalysisS&P 500 on the daily chart. The market is still under the control of the bears. This mean that we have to look for selling opportunities more than the buy once. Let us see how the market will move on Monday.
