S&P500 FORMING NEUTRAL TRIANGLE?S&P500 is reluctant to fall as we think before, Both price acion and Neo wave analysis carried out , 70% of wave pattern completed, Today's price action (break out of c4)changed the previous view of reversal..
Us500signals

US5001. Down trend channel, nearly at the to of the channel. 2. looking for rejections of that resistance

🟢 🟣 S&P 500 Analysis 🟣 🟢 (LONG) Hello traders,
🔥 Our winner Signal S&P 500 /US 500 was : BUY @ 3787/exited @3809 --> +22💰💰💰
Let us know in the comment section below if you have any opinions or questions.
And PLEASE smash the LIKE button. 😉

US500 - Big Short Wave on the TsunamiI have been waiting for this decisive moment for a long time.
Please refer to my chart for consideration.
This is not financial advice
~~~~~~~~~~~~~~~~~~~~~~~~~~~~~~~~~~~~~~~~~~~~~~~~~~~~~~~~~~~~~~~~~~~~~~~~~~~~~~~~~~~~~~~~~~~~~~~~~
Above is my personal opinion, I do not encourage anyone to follow suit, please manage your money, Good luck!
Xin Liar

US Market Technicals Ahead (8 Feb – 12 Feb 2021)All three US major averages finished the week in the green, with each posting its best week since November 2020 as fears of the short-squeeze in a handful of stocks leading to broader market contagion subsided. Investors will be focusing on earnings and the prospects for a hefty new coronavirus relief package in the week ahead. Markets will also be watching the latest consumer price inflation numbers on Wednesday amid expectations for an uptick as the economic backdrop improves and the vaccine roll-out gains momentum.
Here’s what you need to know to start your week.
S&P500 (US Market)
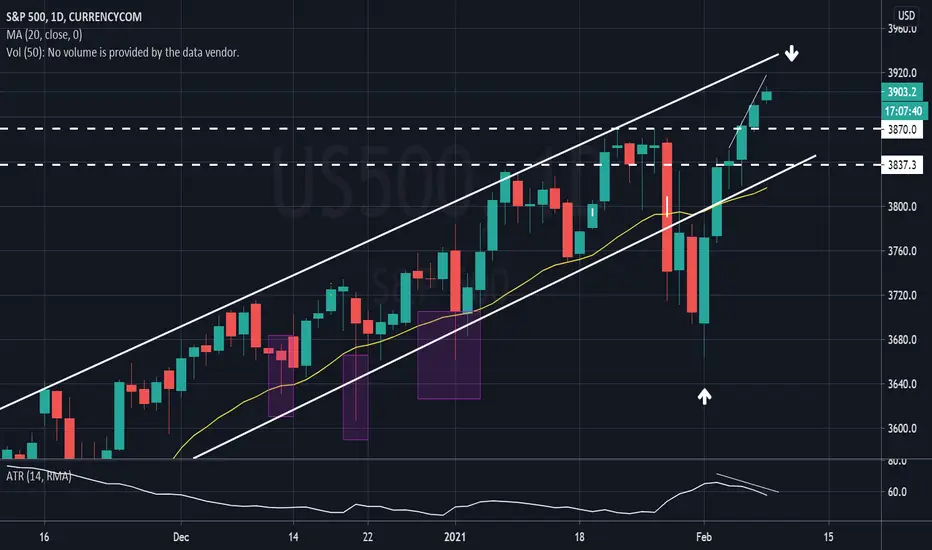
The benchmark index ($SPX) kicks off the month of Feburary with a weekly gain of +5.03%, the best week of the index since November 2020. This rally not only fully recovered the correction from the initial week, but it also established a new all time high for $SPX at 3,895 level. Additionally, $SPX is now back above its 20DMA, along with the consolidated Trend Channel highlighted last week.
At the current junction, the week’s rally of $SPX have exhibited a Bearish Divergence pattern; as the daily rally of $SPX is accompanied with a volume exhaustion. The first signs of weakness in this rally will require a re-test of all-time high resistance turned support at 3,870.
1. Earnings
Better-than-expected corporate results so far in the fourth quarter have driven up analysts’ expectations, and S&P 500 ($SPX) companies are on track to post earnings growth for the period instead of a decline as initially expected. Upcoming U.S. reports in the week ahead include Cisco Systems ($CSCO), Twitter ($TWTR), General Motors ($GM), Pepsi ($PEP), Coca-Cola ($KO), AstraZeneca ($AZN) and Walt Disney ($DIS).
Upbeat earnings along with stimulus talks and progress on the vaccine rollout boosted equities last week, with the S&P 500 and the Nasdaq recording their largest weekly percentage gains since the U.S. elections in early November.
Upbeat fourth-quarter results would bolster expectations for a strong rebound in earnings in 2021 and help to ease investor worries that valuations are overstretched.
2. Stimulus
U.S. President Joe Biden’s push for his $1.9 trillion COVID-19 relief package gained momentum on Friday after the U.S. Senate narrowly approved a budget blueprint allowing Democrats to push the legislation through Congress in coming weeks with or without Republican support.
Republicans have proposed a $600 billion aid package, less than a third the size of the Democratic plan.
Congressional committees are set to start drawing up legislation this week and Speaker Nancy Pelosi has predicted the final legislation could pass Congress before March 15, when special unemployment benefits that were added during the pandemic expire.
Data on Friday showing a smaller-than-expected rebound in the U.S. labor market in January underscored the need for more stimulus to bolster the economy.
3. Inflation data
Market watchers will be paying close attention to Wednesday’s CPI data amid growing expectations that an uptick in inflation could be larger and longer lasting than the Federal Reserve is currently anticipating.
U.S. Treasury investors are betting on rising inflation as the U.S. economy returns to more normal levels in the second half of this year, after contracting at its deepest pace since World War Two in 2020.
The prospect of a new coronavirus relief package is adding to inflation expectations.
Meanwhile, Fed Chair Jerome Powell is to speak about the labor market on Wednesday at a webinar hosted by the Economic Club of New York. Thursday’s figures on initial jobless claims will also be in focus.

us500us500 find good suport at 3720 worst is 3680
and its time for bull target 3840
stop 3650
good luck


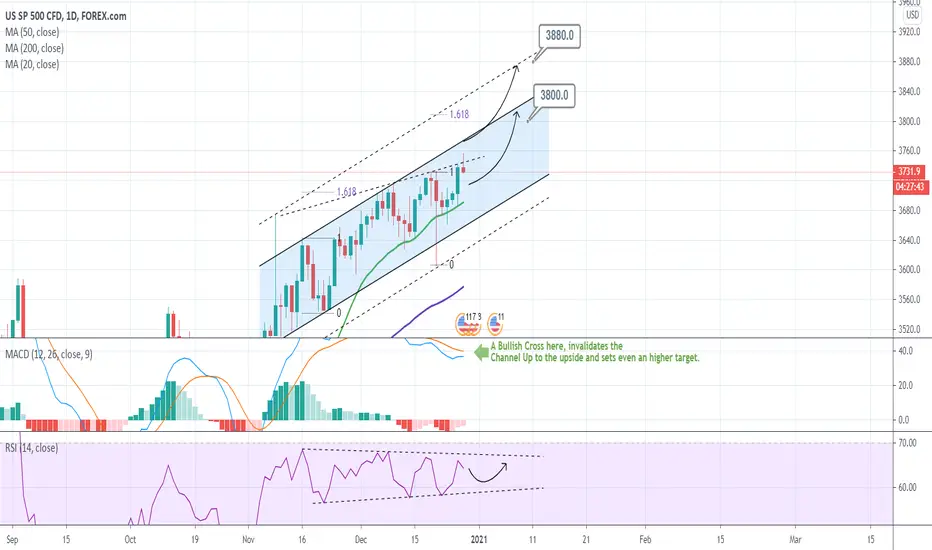
S&P500 aims at 3800Pattern: Channel Up on 1D.
Signal: Buy (a) if the MACD makes a Bullish Cross (every prior 1D Bullish Cross has delivered an extreme rise), or (b) if the RSI approaches its Higher Lows trend-line.
Target: (a) 3880, (b) 3800
** Please support this idea with your likes and comments, it is the best way to keep it relevant and support me. **
--------------------------------------------------------------------------------------------------------
!! Donations via TradingView coins also help me a great deal at posting more free trading content and signals here !!
🎉 👍 Shout-out to TradingShot's 💰 top TradingView Coin donor 💰 this week ==> TradingView
--------------------------------------------------------------------------------------------------------
S&P500 preparing an end of the year rally to 3780SPX continues to trade within the Channel Up that I previously spotted and right now the keys are a certain Fibonacci sequence as well as the MACD formation on the 4H time-frame.
As you see the MACD is printing a similar formation with November 23 - 26. That was when S&P500 made its aggressive Bullish Leg from 3545 to 3655. It made its top on the -0.1 Fibonacci extension then pulled back to the 0.382 Fib retracement and took some time to price a Higher High on the -0.618 Fib extension.
If the same pattern is repeated, then the price could pull back seeking support within the 4H MA50 and 0.382 Fib and then rise to the -0.618 extension which is around 3790. That would set up S&P on a nice end-of-the-year rally.
** Please support this idea with your likes and comments, it is the best way to keep it relevant and support me. **
--------------------------------------------------------------------------------------------------------
!! Donations via TradingView coins also help me a great deal at posting more free trading content and signals here !!
🎉 👍 Shout-out to TradingShot's 💰 top TradingView Coin donor 💰 this week ==> TradingView
--------------------------------------------------------------------------------------------------------

S&P500 Targeting 3720 short-termPattern: Rising Wedge within Channel Up on 4H.
Signal: Buy as the price found support on the 4H MA50, which has been holding since November 23. If the Rising Wedge breaks, buy near the Higher Low of the Channel Up.
Target: 3720 (just below the -0.382 Fibonacci extension like every previous Higher High).
** Please support this idea with your likes and comments, it is the best way to keep it relevant and support me. **
--------------------------------------------------------------------------------------------------------
!! Donations via TradingView coins also help me a great deal at posting more free trading content and signals here !!
🎉 👍 Shout-out to TradingShot's 💰 top TradingView Coin donor 💰 this week ==> TradingView
--------------------------------------------------------------------------------------------------------

S&P500 Trading PlanPattern: Channel Up on 4H.
Signal: (A) Buy either on the Channel's median or on the Higher Low trend-line or if the 3675 Resistace breaks first. (B) Sell below the 3545.
Target: (A) 3670 (just below the Resistance). If 3675 breaks target 3710 (0.5 Fibonacci extension). (B) The 4H MA200 (orange trend-line).
Previous S&P500 trade:


US500 3541.1 - 0.32 % SHORT IDEA * CORRECTION AND PRICE ACTIONHey everyone
A look at the S&P 500 that is currently trading is a bear flag looking for a break below of the structure, the index rallied up with the bull and was bound to correct this move to complete that big gartley pattern so previous swing lows will be our targets and guided by the fibonacci levels a break above of structure will change the whole trading plan.
As always higher time-frames for direction and whats happening in the overall chart and lower time-frames for entry opportunities.
LET'S SEE HOW IT GOES..
HAPPY TRADING EVERYONE & LET THE WINS RUN...
_________________________________________________________________________________________________________________________
ENTRY & SL - FOLLOW YOUR RULES
RISK-MANAGEMENT
PERIOD - SWING TRADE
__________________________________________________________________________________________________________________________
If this idea helps with your trading plan kindly leave a like definitely appreciate it.

S&P500 Buy Signal / Strong supporting linePattern: Higher Lows on the 4H chart.
Signal: Buy as the index rebounded not only on the former Lower Highs trend-line (dashed line), but also on the newly formed Higher Lows trend-line.
Target: 3660 (just below the 3675 Resistance).
Recent S&P signals:
** Please support this idea with your likes and comments, it is the best way to keep it relevant and support me. **
--------------------------------------------------------------------------------------------------------
!! Donations via TradingView coins also help me a great deal at posting more free trading content and signals here !!
🎉 👍 Shout-out to TradingShot's 💰 top TradingView Coin donor 💰 this week ==> seba26-77
--------------------------------------------------------------------------------------------------------

S&P500 ShortIf the daily candle closes below the upper trend line we would like to short with confirmed price action on lower timeframes.

S&P500 Time to break above the Stimulus-Elections Triangle?Since the September 03 Top (All Time High), S&P500 has entered a volatile pattern in the form of a Triangle. The major drivers of this weakness have fundamentally been the U.S. stimulus being delayed and then the elections.
Today the Lower Highs trend-line of this Triangle is being tested. If broken, I expect the 3590 Resistance to be tested, with an extension to the 1.236 Fibonacci at 3620 as it happened with the July 23 extension.
The reason I give more probabilities to an upward break-out from the Triangle is the fact that the MACD on the 1D time-frame has (just) formed a Bullish Cross much earlier than the previous time, something that may accumulate buyers. Also the RSI has broken above its Lower Highs trend-line already, something that was a bullish signal 1 year back. On top of that the MA30 just crossed above the MA50 which on a one month horizon at least, has historically been a bullish signal (we have to go years back to see immediate selling after a 1D MA30/50 Bullish Cross.
Most recent trade on S&P500:
** Please support this idea with your likes and comments, it is the best way to keep it relevant and support me. **
--------------------------------------------------------------------------------------------------------
!! Donations via TradingView coins also help me a great deal at posting more free trading content and signals here !!
🎉 👍 Shout-out to TradingShot's 💰 top TradingView Coin donor 💰 this week ==> didogetsov
--------------------------------------------------------------------------------------------------------


SPX500 BUY IDEA #DaytradeHey tradomaniacs,
welcome to a new free trading-setup.
This is meant to be a preparation for you. As always we will have to wait for a confirmation!
SPX500: Daytrade-Preparation
Notice:
Identified lots of buyers with the retest in market-depth but market overall very shaky!
Low risk and aggressive management or stay out! Market very tricky!
Waiting for more bullish confluence with the current retest.
Market-Buy: 3298,00
Stop-Loss: 3270,00
Target 1: 3327,00
Target 2: 3343,00
Target 3: 3365,00
Stop-Loss: 28 pips
Risk: 0,5% - 1%
Risk-Reward: 2,35
LEAVE A LIKE AND A COMMENT - I appreciate every support! =)
Peace and good trades
Irasor
Wanna see more? Don`t forget to follow me.
Any questions? PM me. :-)


SPX500 BUY SIGNALey tradomaniacs,
welcome to a new free trading-setup.
SPX500: Daytrade-Execution
Market-Buy-Order: 3465,00
Stop-Loss: 3435,00
Target 1: 3495,00
Target 2: 3510,00
Target 3: 3535,00
Target for One-Target-Trader: 3510,00
Stop-Loss: 30 pips
Risk: 0,5% - 1%
Risk-Reward: 2,30
LEAVE A LIKE AND A COMMENT - I appreciate every support! =)
Peace and good trades
Irasor
Wanna see more? Don`t forget to follow me.
Any questions? PM me. :-)
