Us500signals

US500 LongHello guys.
This index has been forming a bearish/ falling flag for the past few weeks and it broke out of the channel, retested it and a bullish momentum has been formed.
My entry point for this trade is at 3800. My stop loss is placed below the previous market zone at 3720 and my targets are 3880, 3960 and 4040.
My R:R is 1: 3.
Remember, move your stop loss above the entry point when the market hits the first target(if the market tends to move according to our prediction). Risk only 1-2% of your account.

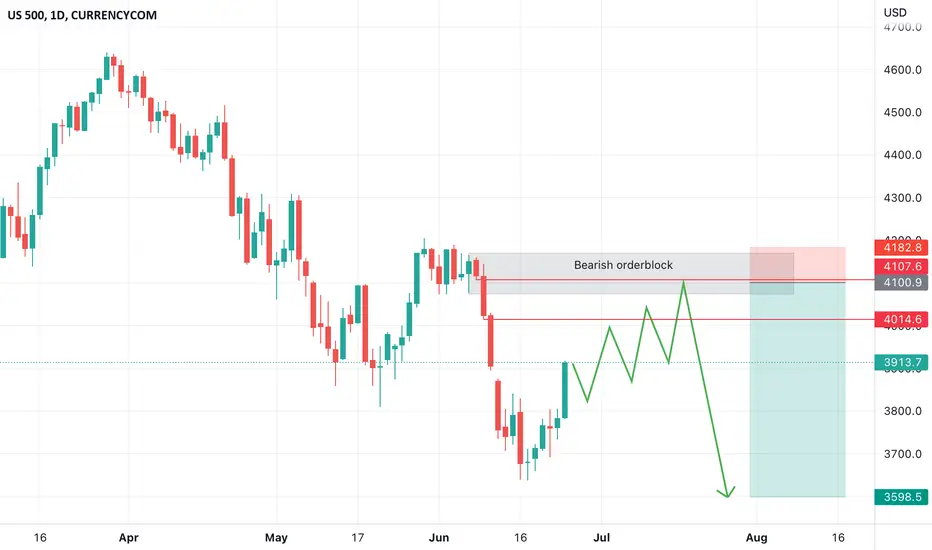
S&P500 - Short from bearish orderblock ✅Hello traders!
‼️ This is my analysis on US500.
Here we are still in the bearish market structure, so I am looking only for shorts. I expect price to continue the retracement to fill the imbalance and then to reject from bearish orderblock.
Like, comment and subscribe to be in touch with my content!

S&P500 Already took two long positions still holding i did not put TP yet because
I'm looking to see price react @ 3765 , if it goes above it will go to @ 3807 then break , once broken it will go all the way to @ 3905 and i will close trades

S&P500 (US500) - Short from bearish orderblock ✅Hello traders!
⁉️This is my analysis on US500.
Here we are in a strong bearish market structure, I expect price to fill the imbalance above and to reject from bearish orderblock. My target is sell side liquidity around price level 3555.
Like, comment and subscribe to be in touch with my content!

S&P500 (US500) - Short from bearish orderblock ✅Hello traders!
⁉️This is my analysis on US500 .
Here we are in a bearish market structure, so I am looking only for shorts. I expect a sell-off from if price fills the imbalance above and rejects from bearish orderblock.
Like, comment and subscribe to be in touch with my content!

US500 IS DIVING DEEPER INTO BEAR MARKETAfter policymakers have shown more appetite for interest rate hikes, S&P500 recorded its lowest close in almost two years and it is 24% down from its record high.
The technical indicators on 1H graph are also putting the index into bear territory, with MACD histogram below 0 and keeps decreasing and RSI well below 50 neutral line.
If the downtrend continues, the index might reach and test levels of around 3530 USD. If opposite scenario occurs, the price might test its previous high at 3800 USD.
Risk Disclosure: Trading Foreign Exchange (Forex) and Contracts of Difference (CFD's) carries a high level of risk. By registering and signing up, any client affirms their understanding of their own personal accountability for all transactions performed within their account and recognizes the risks associated with trading on such markets and on such sites. Furthermore, one understands that the company carries zero influence over transactions, markets, and trading signals, therefore, cannot be held liable nor guarantee any profits or losses.

S&P 500 BEARISH OUTLOOKThe major US indices, including S&P 500, are continuing to plumed after the Fed rate decision yesterday. The interest rate reached 3.25%, as it was predicted, but the forecasts are that the interest rates will keep increasing into the entire 2023 as well, reaching levels of 4.6%
The technical indicators are suggesting a downtrend as well, MACD histogram is below the 0 line and the RSI is well below the oversold 30 line.
If the trend continues the price might test its levels at 3670, but if it reverses, it might test its previous high at 3958.
Risk Disclosure: Trading Foreign Exchange (Forex) and Contracts of Difference (CFD's) carries a high level of risk. By registering and signing up, any client affirms their understanding of their own personal accountability for all transactions performed within their account and recognizes the risks associated with trading on such markets and on such sites. Furthermore, one understands that the company carries zero influence over transactions, markets, and trading signals, therefore, cannot be held liable nor guarantee any profits or losses.

⁉️ US500 - Market AnalysisHello traders!
⁉️This is my analysis on US500 .
Here we are still bearish , so I am looking only for shorts. I expect price to retrace after taking out sell side liquidity, to fill the imbalance and to reject from bearish orderblock.
Like, comment and subscribe to be in touch with my content!

s & p 500 price broke major level and did not retest and momentum still tells me that its a down trending market so will see a retest and drop

SP 500 - next week planW/M downtrend
Weekly OB and daily fvg already hiti and came back down to it
I expect price to broke this level next week and drop further down

US500 BEARISH OUTLOOKAfter the speech of Fed chairman Jerome Powell last Friday, on which he clearly stated that the main goal of Federal Reserve is to stabilize prices and will remain hawkish on interest rates, expectations of increased strength of the USD made big portion of the investors to sell their shares and increase the amount of dollars they are holding, which plummeted the price of S&P500.
RSI indicator is below 30 level and MACD is below zero as well, which also indicates a bearish trend.
The instrument broke the support at 4109 and continues to decline. If this pattern continues, the instrument might test its levels at 3940. Otherwise, if the trend reverses, the price might test levels at 4060.
Risk Disclosure: Trading Foreign Exchange (Forex) and Contracts of Difference (CFD's) carries a high level of risk. By registering and signing up, any client affirms their understanding of their own personal accountability for all transactions performed within their account and recognizes the risks associated with trading on such markets and on such sites. Furthermore, one understands that the company carries zero influence over transactions, markets, and trading signals, therefore, cannot be held liable nor guarantee any profits or losses.

S&P500 Test of 4HMA50. Kept Support but many Resistances above.The S&P500 index has been trading mostly sideways since the June 27 High. The pattern that stands out during that time is a Triangle, with the price keeping (and rebounding since yesterday on) the 3750 Support intact (closed all 4H candles above it). The top of the Triangle involves a Lower Highs trend-line, approximately on the same path of the 4H MA200 (orange trend-line) that already has two clear rejections on the patterns Lower Highs.
At the moment the price is testing the 4H MA50 (blue trend-line) and naturally if broken a 4H MA200 test should follow. There are many Resistance levels up ahead, even if we close above the 4H MA200, we need to consider the Resistance strength of the 0.618-0.786 Fibonacci zones of the Channel Down (remember it is the dominant pattern throughout the whole year when the correction started).
The short-term strategy is to take one Resistance at a time and target the higher levels only if we get a clear 4H candle closing above the current Resistance at hand. In the same notion, a break above the Channel Down, which is approximately where the 0.382 Fib is, targets the 0.618 level at around 4320. Similarly a closing below the 3750 Support, targets the 0.236 Fibonacci level.
--------------------------------------------------------------------------------------------------------
Please like, subscribe and share your ideas and charts with the community!
--------------------------------------------------------------------------------------------------------

short spx500 The reason is very simple the price opens below pivot points and moving average which shows me that sellers are still in power plus cluster algo gives me signal to sell

SHORT S&P500 ✅✅✅Hello traders!
✅ This is my trade on US500.
Here we are in a bearish market structure, so I expect a new expansion after the price filled the imbalance and rejected from bearish orderblock. As target I have sell side liquidity below old low.
Like, comment and subscribe to be in touch with my content!

US500 SellsIn TECHNICAL ANALYSIS .
US500 Show a clear Order Block on 4 Hour.
Confluences which validates this order block are as follows:-
1. It has broken structure.
2. Lies with in Premium Supply.
3. Their is in efficient Price Action( Imbalance filled).
4. Mitigated Order Block.
5. Liquidity Taken.
EVERYTHING COOL RIGHT..... Trade Safely.
.
.
More PIPS to come.

us500 trade ideaUS500, high chance that correction continues until it reaches at the median line, previous swing high and strong resistance.
Once price has reached the level, we will have a nice opportunity to open a short pos.

⁉️ S&P500 (US500) - Market AnalysisHello traders!
⁉️This is my analysis on US100 .
Here we have the same scenario as on US30 and US100, as they are moving pretty the same. Expect the price to fill the imbalances and to reject from bearish orderblock.
Like, comment and subscribe to be in touch with my content!
Jamie Gun2Head Idea - Selling SP500Trade Idea: Selling SP500
Reasoning: Running into resistance level, time for the sellers to step in
Entry Level: 3821
Take Profit Level: 3643
Stop Loss: 3858
Risk/Reward: 4.81:1
Disclaimer – Signal Centre. Please be reminded – you alone are responsible for your trading – both gains and losses. There is a very high degree of risk involved in trading. The technical analysis , like all indicators, strategies, columns, articles and other features accessible on/though this site is for informational purposes only and should not be construed as investment advice by you. Your use of the technical analysis , as would also your use of all mentioned indicators, strategies, columns, articles and all other features, is entirely at your own risk and it is your sole responsibility to evaluate the accuracy, completeness and usefulness (including suitability) of the information. You should assess the risk of any trade with your financial adviser and make your own independent decision(s) regarding any tradable products which may be the subject matter of the technical analysis or any of the said indicators, strategies, columns, articles and all other features.

S&P 500 Weekly AnalysisS&P 500 on the daily chart. The market is still under the control of the bears. This mean that we have to look for selling opportunities more than the buy once. Let us see how the market will move on Monday.

US500 LONG IDEAGoing Busllish on S&P500
Price broke the downtrend and is at a resistance level
limiting my Stop Loss around 3900 while targeting 4680-4700 levels

S&P 500 LongPair: US500
Side: Buying Model
Entry: 4020
Stop loss: 3963
Target : 4310
Risk Ratio: 1/5

