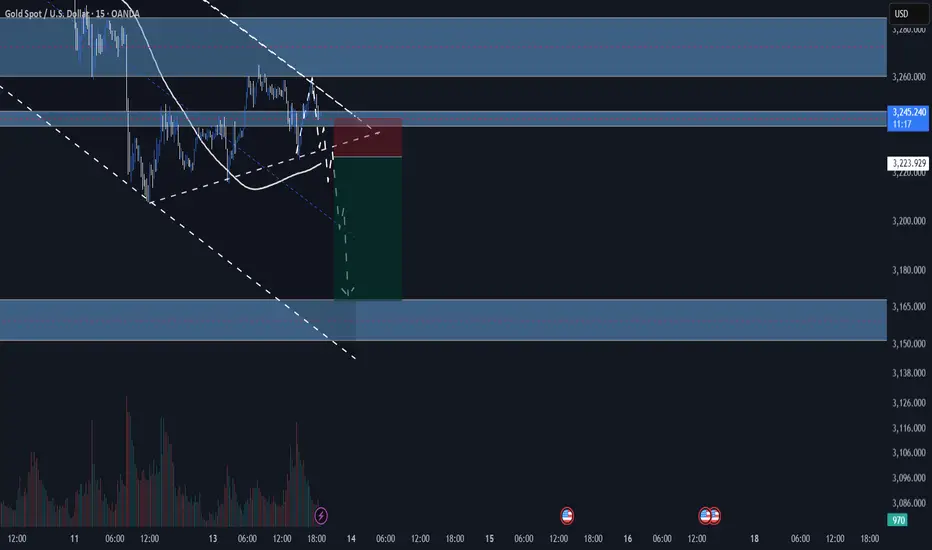
XAUUSD SHORTIt's a beautiful setup , as we see here gold is going down since 6TH of may and it forms a bearish channel , it just tested the lower high of the channel and a resistance . I'm waiting for the market to break and retest the trendline beneath it , then i'll take a short position targeting this support level
USA
DXY Rebound or Reversal? All Eyes on the Bearish OB Zone! Analysis:
As anticipated, DXY has now swept the major weekly/monthly sell-side liquidity (SSL) at 99.58, tapping deep into a high-probability reversal zone. This aggressive liquidity raid was followed by a sharp bullish reaction—marking the first signs of potential re-accumulation or a relief rally.
Currently, price is pushing back toward a bearish order block (OB) that aligns with a dense cluster of confluences:
A weekly FVG (Fair Value Gap)
A monthly FVG that’s been previously respected
Major supply resistance from previous highs around 108.40–109.39
This confluence zone is critical.
📍 Two Likely Scenarios:
Rejection from OB Zone: If price respects the OB, expect continuation to the downside—possibly targeting a deeper structural shift and breaking below the recent SSL.
Breakthrough & Reclaim: If price breaks and closes strongly above the OB zone, it opens the door for a move toward 114.60, the next major daily buy-side liquidity.
🧠 Either outcome offers a significant macro play, especially for risk-sensitive pairs (i.e., AUD, NZD, Gold, or equities inversely correlated to USD strength). Keep in mind, DXY's movement is heavily influenced by macroeconomic events, so dollar strength or weakness can cascade across global markets.
Key Levels to Watch:
Support: 100.215 / 99.58
Resistance: 108.40 → 109.39 OB zone
Upper Target if invalidated: 114.60
⚠️ DYOR. Let price confirm before bias is committed.

USA-UK: Trade Agreement and Impact
Hello, I am Trader Andrea Russo and today I want to talk to you about the meeting that will take place today, May 9, 2025, between the USA and the UK. The announcement of a new trade agreement between the United States and the United Kingdom by Donald Trump has immediately attracted the attention of global investors. Its economic scope could have significant repercussions on the main currencies, in particular on the GBP/USD pair.
The components of the agreement and the reactions of the markets
According to initial information, the agreement aims to strengthen trade relations between Washington and London, simplifying regulations on goods and services, reducing duties and incentivizing bilateral investments.
Immediate impact on the pound (GBP)
The GBP/USD pair has shown an initial reaction of volatility, with investors evaluating the details of the new agreement. If the agreement leads to greater economic stability and growth in the United Kingdom, the pound could benefit from a bullish trend in the short term. However, some analysts warn that the pound could suffer from more in-depth negotiations in the future, especially if the deal puts renewed pressure on UK financial markets.
The US dollar and the Fed’s monetary policy
The deal comes amid economic uncertainty in the US, with the Federal Reserve monitoring inflation and growth. If bilateral trade between the US and UK were to expand significantly, it could have a positive effect on the dollar’s strength, even against other currencies.
Economic sectors involved and impact on FX
The deal could affect several sectors:
Energy and raw materials: If trade in natural gas or oil between the two countries increases, it could have an impact on commodity futures and therefore on currencies linked to these markets, such as the CAD and AUD.
Technology and financial services: Expanded cooperation between technology and financial firms could attract investment on Wall Street and support the dollar.
Manufacturing and Exports: If the UK manages to secure favorable export terms, the pound could see increased demand in Forex.
Outlook
In the short term, the deal could lead to increased volatility in GBP/USD as investors await further details. In the long term, much will depend on the economic policies that follow the deal and the effects on the trade balances of the two countries.
Forex market analysts will continue to monitor investor reaction and future statements from the governments involved.

AI Prediction SOL/USD Trading Plan 24 hours!💰 May 4, 2025 8:52 pm. SOL/USD Trading Plan
Long Scenario
- Entry: Breakout above 148.50 (volume >8,000).
- Stop-Loss (SL): 145.50 (below support).
- Take-Profit (TP): 149.50 (below resistance).
- Trailing Stop: 1.5x ATR ($0.77).
- Confirmation: Supertrend (long), MACD bullish crossover, RSI >50.
Short Scenario
- Entry: Breakdown below 146.50 (volume >12,000).
- SL: 147.50 (above resistance).
- TP: 145.50 (above support).
- Trailing Stop: 1x ATR ($0.51).
- Confirmation: Supertrend flips short, MACD bearish, CMF <0.

Tariffs, and Tumult: Wall Street Waits on Super WednesdayHello everyone, it’s April 30, 2025. The TVC:DJI just closed its sixth consecutive green session, with markets clinging to hope as rumors swirl of a first tariff deal—possibly with India—though nothing is confirmed. That tiny breadcrumb of optimism was enough to boost sentiment late in yesterday’s session, even if volatility is dipping below 25% and investor enthusiasm seems to be fading in lockstep.
U.S. macro data continues to paint a picture of “not great, but not terrible.” Consumer confidence and job openings (JOLTS) came in below expectations but not disastrously so, prompting markets to collectively shrug and declare everything “less worse than feared.” It’s a strategy now: ignore bad data as long as it isn’t apocalyptic.
As earnings roll in, companies are split between those who pretend the tariff storm is “manageable” (hello, NASDAQ:COKE ) and those flying blind through economic fog ( NYSE:UPS , Snap, and Super Micro—who might be losing a major client named Nvidia). The overall takeaway? Visibility is garbage, and most companies are bracing rather than building.
All eyes are now on today’s so-called Super Wednesday, packed with economic data (U.S. GDP, PCE, ADP jobs, Chicago PMI) and mega-earnings from NASDAQ:MSFT and NASDAQ:META . But as usual, expectations may outpace reality. Markets often dream of clarity and wake up to more noise.
Meanwhile, China flashed its first big red light: a manufacturing PMI of 49, signaling contraction—the lowest in two years. No shock, considering their ongoing trade war with the U.S., which seems to be giving the global economy the flu.
On the political front, Trump celebrated his 100 days in office with a campaign-style detour to Detroit, throwing shade at Fed Chair Jerome Powell while declaring the economy in perfect health (despite the worst market performance since Nixon’s early days). He promised tax cuts, again, while doubling down on trade threats. Powell, of course, is just trying to survive the week.
Oil briefly dipped under $60 as markets considered the broader implications of economic warfare, gold sits at $3,311, and Bitcoin hovers around $95,000—looking resilient despite the madness.
As for corporate earnings, Starbucks missed on sales due to weak U.S. demand, Pfizer beat on EPS but saw revenue fall, and Visa continues to rake in profits as Americans keep spending like inflation isn’t real. Novartis crushed it but got no love from the market because apparently, +22% net income just isn’t sexy enough.
In short: chaos remains king. Markets seem oddly calm on the surface, but under the hood, it’s still all about tariffs, Trump tweets, and the fantasy that maybe—just maybe—some clarity will come today. Don’t hold your breath.
Enjoy the ride, and see you tomorrow for more market mayhem.

April 29, 2025 - Waiting for the Crash or the Miracle?Hello everyone, it’s April 29, 2025. Yesterday’s market session was about as exciting as watching paint dry. After months of Trump-fueled chaos, investors seem almost relieved that… nothing happened. Indices barely moved: TVC:DJI up 0.28%, SP:SPX up a pathetic 0.06%, CME_MINI:NQ1! down 0.10%. In short: we’re falling from a 150-story building, and so far, so good — but we know the real pain comes when we hit the ground.
Markets are clinging to hopes that Trump’s trade war with China might get a Hollywood-style happy ending. He’s calmed down a bit. Stopped slamming Powell, flirted with diplomacy, and softened up on auto tariffs. But with an avalanche of critical economic data coming (Consumer Confidence, GDP, PCE, Jobs) and Magnificent Seven earnings, no one’s taking big bets right now. Everyone’s waiting to see if the economic parachute opens, or if we get pancaked on impact.
Meanwhile, US macro isn’t looking great. Confidence is sinking — 53% of Americans say their finances are worsening, a record since COVID. Consumer spending is stalling, companies like NASDAQ:AAL and NASDAQ:DPZ are canceling forecasts, and the real estate market is coughing. Even hardcore Trump supporters are starting to sweat. The US might still technically be growing, but psychologically, the recession has already started.
OANDA:XAUUSD is holding strong at $3,321, BLACKBULL:WTI is around $61.57, and BINANCE:BTCUSDT is cruising near $94,400. Futures this morning are flailing between -0.6% and +0.2%, dancing to the tune of whatever headline drops next.
On the political front, Trump pulled a classic backpedal on auto tariffs: no double penalties for carmakers, partial refunds on tariffs already paid, and promises of time for US production reshoring. Nice words but rebuilding car factories will take years.
As for NASDAQ:NVDA , it’s under pressure after China banned sales of its H20 chips. Huawei’s Ascend 910D chip is stepping in — good for China, but too slow and too pricey for the rest of the world. Nvidia stays king globally for now, but the tech war is heating up.
Today, eyes are on key numbers: US Consumer Confidence (expected 87.7) and JOLTS job openings (expected 7.49M). Also, a heavy lineup of earnings: NYSE:V , NASDAQ:SBUX , NASDAQ:COKE , NYSE:PFE , NYSE:SNAP , and more.
For now, we’re still in free fall, hoping there’s a giant crash pad waiting at the bottom. Hang tight — it’s going to be another wild one.

April 28, 2025 - Broken Supply Chains, and the DC CircusHello everyone, it’s April 28, 2025. The week ahead promises to be spectacular (or a complete disaster) depending on which way the wind blows out of Washington. So far, the futures are down about 0.6% this morning, as everyone’s trying to cut risk ahead of a week crammed with Big Tech earnings ( NASDAQ:AAPL , NASDAQ:MSFT , NASDAQ:AMZN , NASDAQ:META ), a mountain of macro data (PCE, GDP, ISM, jobs), and of course, the never-ending Trump tariff soap opera.
On the US politics front, Trump stayed uncharacteristically quiet over the weekend, no new bombshells. But whispers about “talks” with China surfaced, without any real confirmation. Meanwhile, several countries are supposedly rushing to negotiate tariff deals with the US. Expect headlines (and chaos) throughout the week.
Supply chains are starting to crack. Container traffic from China to the US has plunged 60%, and if deals aren’t made by mid-May, we could be staring down empty shelves and layoffs in transport and retail sectors. Think “Black Friday” without anything to buy.
Meanwhile, the drama at the Fed continues. Kevin Warsh, still salty about not replacing Powell, attacked the Fed’s “media circus” style, blaming it for post-Covid inflation. Warsh wants the Fed to go old-school: shut up, protect the dollar, and stop playing superhero. No forecasts, no endless press conferences. Just cigars and silence.
On the macro side, this week’s economic data could turn into a horror show: weak jobs numbers, soft GDP, slowing PCE, all raising the probability of recession. If that happens, expect markets to start begging the Fed to cut rates sooner rather than later.
Assets snapshot:
• BLACKBULL:WTI : $63.36
• OANDA:XAUUSD : $3,307
• INDEX:BTCUSD : $94,000
In short: expect maximum volatility, endless surprises from DC, and a market that could spin on a dime. Stay sharp, stay skeptical, and brace for anything.

3 Oversold Stocks Poised for a Rally – MAS, IQV & TMOBelow is today’s SmartApingAI snapshot of three highly oversold names showing early signs of a rebound. Scroll down for a quick refresher on each company’s fundamentals, key technicals, and what makes them attractive at current levels.
1. Masco Corp ( NYSE:MAS )
What They Do:
Masco designs, manufactures and sells a broad range of home-improvement and new-construction products, including faucets, cabinets, hardware, coatings and architectural products.
Customers:
• Homeowners tackling renovation projects
• Professional contractors and builders
Income Source:
Primarily through the sale of mid-range to premium fixtures, cabinetry systems and paint/coatings.
Geographic Footprint:
• ~85% North America
• ~15% Europe
Product Pricing:
Mid-range to premium, with strong brand recognition in kitchen and bath fixtures.
SmartAping AI Model Target Price:
$81.36
Technical Snapshot:
• Broke below—and then bounced off—the $57 weekly support zone
• Now trading at $60.42, up from the intra-week low
• WiseStrat Macro ASI: deeply oversold at –120, turning bullish
• WiseStrat Micro ASI: still bearish, suggesting cautious position sizing
Why Watch:
Home-improvement spending has held up despite moderating housing starts, and MAS’s disciplined balance sheet and dividend yield (~2%) make it a compelling recovery play if consumer confidence picks up.
2. IQVIA Holdings Inc ( NYSE:IQV )
What They Do:
IQVIA provides data analytics, research services and technology solutions that power clinical trials, market research and real-world evidence for the life-sciences industry.
Customers:
• Pharma and biotech firms
• Medical device companies
• Healthcare providers and payers
Income Source:
Subscription and project-based fees for data platforms, consulting and trial execution services.
Geographic Footprint:
• 50% Americas
• 30% EMEA (Europe, Middle East & Africa)
• 20% Asia-Pacific
Product Pricing:
Variable, tailored to project scope—from high-volume data subscriptions to multi-million-dollar trial outsourcing contracts.
SmartAping AI Model Target Price:
$275.35
Technical Snapshot:
• Dropped below the $137 weekly support last week, then staged a relief rally
• Currently at $150.28
• WiseStrat Macro ASI: extremely oversold at –127, now in bullish reversal mode
• WiseStrat Micro ASI: turning positive, hinting at building short-term momentum
Why Watch:
With global R&D spend on track to exceed $250 billion this year, IQVIA’s blend of analytics and CRO services is in high demand. A seasonal uptick in trial starts could catalyze upside toward our $275 target.
3. Thermo Fisher Scientific Inc ( NYSE:TMO )
What They Do:
Thermo Fisher supplies scientific instruments, reagents and software used in research, diagnostics, manufacturing and safety testing across life-sciences and industrial markets.
Customers:
• Academic, government and corporate research labs
• Clinical and diagnostic facilities
• Biopharma manufacturers
Income Source:
Sales of equipment (from a few hundred to multi-million dollars), consumables, and service contracts.
Geographic Footprint:
• ~50% North America
• ~30% Europe
• ~20% Asia-Pacific & other
Product Pricing:
Ranges widely: entry-level lab kits to high-end sequencers and complete lab automation lines.
SmartAping AI Model Target Price:
$645.83
Technical Snapshot:
• Tested and held the $412.73 weekly support last week, bouncing back to $424.24
• WiseStrat Macro ASI: oversold at –129, now showing bullish tilt
• WiseStrat Micro ASI: still negative, cautioning potential retest of $412
Why Watch:
Strong long-term secular drivers—gene therapy, personalized medicine and diagnostics—remain intact. A washout in biotech funding fears has left TMO trading at a rare discount to growth peers.

From Financial Markets to Pope Francis' Funeral
From Easter to April 28, 2025, financial markets have been in a period of great turbulence, influenced by economic, geopolitical and social events. The Forex market, in particular, has reacted to central bank decisions, commodity fluctuations, global trade tensions and the major event of Pope Francis' funeral, which has seen the participation of world leaders and talks that could have a lasting impact on international relations. This article offers an in-depth analysis of the key events of these weeks.
1. Monetary Policies and Forex Markets The decisions of major central banks have dominated the movements of currency markets. The Federal Reserve, in an attempt to balance recession and inflation risks, has decided to keep interest rates unchanged. This approach has caused a temporary weakness in the US dollar, prompting many traders to move towards more stable currencies such as the euro and the pound.
In Europe, the European Central Bank took a more hawkish stance, hinting at a possible tightening of monetary policy to combat inflation. This move boosted the euro, which posted significant gains against major currencies.
The Bank of Japan, on the other hand, continued its ultra-accommodative policy, causing the yen to weaken further. Traders then showed a preference for the dollar and the euro over the Japanese currency.
2. Commodity Prices and Impact on Related Currencies The commodity market saw significant movements. Oil prices fell, influenced by a rise in inventories in the United States and weak global demand. This trend penalized currencies that are highly correlated to commodities, such as the Canadian dollar (CAD) and the Australian dollar (AUD).
On the other hand, gold continued to gradually increase, with investors choosing it as a safe haven in a context of economic and geopolitical uncertainty. Gold’s strength had an indirect impact on currencies tied to the precious metal.
3. Geopolitics and Conversations During Pope Francis’ Funeral The funeral of Pope Francis, held on April 26, 2025 in Rome, was a crucial moment for global diplomacy. The participation of world leaders allowed for significant discussions:
Meeting between Donald Trump and Volodymyr Zelensky: During the ceremony, a possible peaceful solution to the conflict in Ukraine was discussed. The opening to a ceasefire represents a real possibility for stability in the region.
Statement by Vladimir Putin: The Russian president expressed Russia’s willingness to negotiate without preconditions, a signal that could positively influence global tensions.
Focus on dialogue and peace: The funeral itself emphasized the importance of building bridges between nations, a central message of Pope Francis’ pontificate.
These talks, if followed up with concrete actions, could have long-term effects not only on geopolitical relations, but also on investor confidence and, consequently, on financial markets.
4. Economic Data and Influence on Forex Markets Economic data released during this period played a central role in the movements of the Forex market:
United States: The Consumer Price Index (CPI) showed a slowdown, suggesting that inflationary pressure could ease. This fueled speculation that the Federal Reserve could cut interest rates in the coming months.
Eurozone: Inflation exceeded expectations, strengthening the euro and increasing the likelihood that the ECB will adopt further monetary tightening measures.
Fluctuations in economic data caused greater volatility in the Forex market, offering opportunities and risks for traders.
5. Implications for the Future Looking ahead, investors should carefully monitor geopolitical developments stemming from Pope Francis’ funeral talks, central bank decisions, and key economic data. The combination of these factors could continue to generate volatility in currency markets, making FX a dynamic and complex space for the coming months.

AI predict BTC\USD price, Unbelievable, Check This Out?BTC / USD. COINBASE. Apr 27, 2025 5:07 pm. BTC / USD. Comprehensive BTC/USD Trading Analysis & Strategy (April 25–27, 2025)
(All timestamps in ISO 8601 UTC)
---
I. Core Trend & Key Price Dynamics
1. Macro Trend:
- Mild Bullish Bias (+0.72% net gain) with extreme intraday volatility.
- Critical rejection at 95,500 resistance (tested on `2025-04-25T14:45:00Z`) and firm support at 93,000.
2. Volatility Clusters:
- High Volatility Phase:
- `2025-04-25T14:00–15:30Z`: Price swung between 94,440–95,564 with volume spikes (>750).
- Low Volatility Phase:
- `2025-04-27T00:00–20:00Z: Range tightened to 94,000–95,000, volume declined.
3. Pivotal Events:
- Bullish Breakout Failure: Sharp rejection at 95,564.90 (`2025-04-25T14:45Z`) led to consolidation.
- Bearish Engulfing Candle: At `2025-04-25T14:15Z` (volume: 846.26), signaling short-term top.
---
II. Multi-Indicator Convergence
| Indicator | Bullish Signals | Bearish Warnings |
|----------------------|---------------------------------------------|-----------------------------------------------|
| RSI 14 | Recovery from 40.79 (oversold) to 68.69 | Divergence at 61.24 as price rose (20:00Z) |
| CMF 20 | Surge to +0.428 (buying pressure, 17:45Z) | Drop to +0.056 (profit-taking, 20:00Z) |
| Supertrend | Bullish flip at 93,825.89 (18:30Z) | Flattening near 94,010.86 (indecision) |
| EMA 9 | Price sustained above EMA 9 (~94,300) | Failure to hold risks breakdown |
| Bollinger Bands | Breakout above upper band (94,191, 18:00Z) | Overextended near 94,540 (mean reversion risk)|
| MACD | Bullish crossover (17:45Z), peak at 47.61 | Histogram decline to 34.98 (momentum fade) |
| Stochastic RSI | Overbought (Fast K=100, 18:30Z) | Bearish divergence (Fast K=83.56 at 20:00Z) |
---
III. Strategic Trade Setups
A. Bullish Scenario (Confirmation Needed)
1. Entry:
- Break & Close Above 95,500 with volume >800.
- Retest of EMA 9 (~94,300) with RSI >50 and CMF >0.
2. Targets:
- 96,000 (psychological level), 97,500 (Fibonacci extension).
3. Stop-Loss:
- Below Supertrend (93,825) or 93,000 support.
B. Bearish Reversal (Caution Signs)
1. Entry Triggers:
- Close Below 94,000 with CMF <0 and RSI <50.
- MACD Bearish Crossover + Stochastic K/D cross below 80.
2. Targets:
- 93,000 (support), 91,500 (volume gap from 25th).
3. Stop-Loss:
- Above Bollinger Upper Band (94,540) or 95,500.
C. Neutral/Consolidation Play
- Range Trade: Fade extremes near 94,000–95,500.
- Stop-Loss: 1% outside the range.
---
IV. Critical Risk Factors
1. Divergence Risks: Bearish RSI/MACD/Stochastic divergences suggest upside exhaustion.
2. Volume Confirmation Needed: Bullish momentum requires volume >750 to sustain breaks.
3. External Catalysts: Watch for macro news (Fed policy, ETF inflows) around key timestamps.
---
V. Real-Time Alert Levels
| Level | Type | Significance |
|------------------|-------------|--------------------------------------------------|
| 95,500 | Resistance | Previous swing high; breakout invalidates bearish structure. |
| 94,300 | Support | EMA 9 dynamic support; loss opens path to 93,825. |
| 93,000 | Strong Support | Macro swing low; breakdown triggers panic selling. |
---
Final Outlook
- Short-Term (24–48h): Neutral-bullish with caution at resistance.
- Medium-Term (3–5d): Direction hinges on closing above 95,500 or below 93,000.
Immediate Action: Tighten stop-losses, book partial profits near 95,500, and await volume-backed breakout/breakdown.
(Indicators and price action analyzed in UTC timestamps for precision.) Disclaimer: This is not financial advice. Crypto markets are highly volatile and speculative. Always do your own research and consult a qualified financial advisor before investing. You could lose your entire investment.

NVDA walkthrough. NDOG+SMT Divergence. Intermarket CorrelationNASDAQ:NVDA
Pairing the NVDA and NQ to understand the direction of the expansion. Although IOF is enough with ES. But if you want to trade the stocks primarily you can use this

SLC Brazilian Agricultural Producer and Farmland Investor ThesisExecutive Summary
We are overweighting SLC Agrícola (SLCE3.BZ) over U.S. agribusiness stocks (BG, ADM, MOS, CTVA, FPI) in the current macro environment. The key drivers are:
Geopolitical arbitrage (Trump-Russia détente benefits Brazilian exporters more than U.S. firms).
FX tailwinds (weaker USD boosts BRL-denominated farmland values).
Commodity cycle positioning (SLC’s cotton/soy mix outperforms U.S. corn/ethanol plays).
Valuation gap (SLCE3 trades at 9.1x P/E vs. 14x+ for U.S. peers).
Top Trade:
Long SLC Agrícola (SLCE3.BZ)
I. Macro & Geopolitical Edge: Why Brazil Wins
1. Trump’s Pro-Russia Policy Reshapes Fertilizer & Grain Flows
Sanctions Relief: Russian potash/phosphate exports resume → BrasilAgro (AGRO3) and SLC benefit from 25-30% lower input costs (U.S. farmers already hedged).
U.S. Grain Export Risk: If Trump pushes Ukraine grain deals, ADM/BG lose pricing power in EU/Asia markets.
2. USD Weakness Favors BRL-Linked Assets
Fed Cuts + Trump’s Dollar Policy: BRL appreciation (R$4.60/USD by 2026E) boosts:
SLC’s USD-linked revenue (68% of sales).
Land appraisals (Brazilian farmland up 18% CAGR in USD terms).
U.S. Companies Hurt: ADM/BG’s LatAm earnings face translation drag.
3. BRICS Neutrality vs. U.S.-China Decoupling
Brazil remains trusted supplier to both China and EU (no trade wars).
U.S. agribusiness (ADM/BG) exposed to:
China soy tariffs (if Trump escalates).
EU carbon taxes (ADM’s ethanol margins at risk).
II. Company-Specific Advantages: SLC vs. U.S. Peers
A. SLC Agrícola (SLCE3.BZ) – The Optimal Play
Metric SLC Agrícola U.S. Peers (ADM/BG/MOS)
P/E (2025E) 9.1x 12-18x
EBITDA Margin 38% (2025E) 8-15%
FX Benefit BRL appreciation USD translation drag
Geopolitical Shield Neutral (BRICS) Exposed to U.S.-China wars
Key Catalysts:
Cotton Supercycle: Trump’s EU-China trade war could spike prices (SLC has 40% exposure).
Hidden Water Rights: 120k hectares of irrigated land (R$3.2B unreported NAV).
Ferrogrão Railway Completion (2026): Cuts logistics costs by 18%.
B. U.S. Agribusiness: Relative Weaknesses
Stock Key Risk Mitigation
ADM Ethanol mandate cuts (Biden hangover) Divesting plants
BG Brazilian tax case (R$4.5B liability) Land asset cover
MOS Saudi JV delays (CFIUS scrutiny) Fertilizer optionality
CTVA Patent cliff (2027+) M&A speculation
FPI U.S. farmland cap rate compression Rent escalators
III. Conclusion: Why SLC Over U.S. Peers?
Geopolitical Arbitrage: Brazil avoids U.S.-China/EU trade wars.
FX Leverage: BRL appreciation boosts USD earnings + land values.
Commodity Mix: Cotton/soy > corn/ethanol in Trump’s policy regime.
Valuation: SLCE3 at 9.1x P/E vs. 14x+ for U.S. stocks.

April 25, 2025 - Trump’s Tango, Tech, and Insider DramaHello everyone, it’s April 25, 2025. We’re closing in on Trump’s 100-day mark back in the White House, and if there’s one word to sum up his impact on markets: chaos. With 137 executive orders signed already, he’s turned global markets into a high-stakes rollercoaster though this week saw signs of recovery, confidence remains fragile, and volatility is still running the show.
The main trigger? You guessed it: Trump and his tariff diplomacy. After weeks of U-turns, threats, and NYSE:TWTR meltdowns, he’s finally announced that talks with China have begun. That was enough to send the AMEX:SPY up 2%, pull the CME_MINI:NQ1! out of correction territory (+2.74%), and ignite a 5.63% jump in the Philadelphia Semiconductor Index, even though it’s still miles below its all-time high.
OANDA:XAUUSD is sitting at $3,332, BLACKBULL:WTI hovers around $63.21, and INDEX:BTCUSD has skyrocketed to $93,200. Not bad for a week that started in total disarray.
Now here’s where things get fishy: US indices started climbing before Trump’s announcement—classic “somebody knew something.” Insider trading? Just your average Thursday. And while Trump claims talks are underway, the Chinese side played coy, denying any ongoing negotiations. Either someone’s lying, or the talks are happening over dim sum in DC.
Beyond geopolitics, NASDAQ:GOOG crushed earnings expectations and added a juicy dividend and GETTEX:70B in buybacks, exploding 6% after-hours. Meanwhile, NASDAQ:INTC flopped—flat profits, poor outlook, and a CEO trying to turn cost-cutting into a growth story. The market wasn’t buying it: down 5.7% after-hours.
NYSE:NOW , though, is living its best life. Strong results, AI momentum, and federal contracts boosted shares 15%. Other names like NASDAQ:PEP , NYSE:PG , and NASDAQ:AAL warned on the future thanks to—you guessed it—political and economic uncertainty.
On the macro front, ECONOMICS:USIJC (US jobless claims) ticked higher, inflation seems to be cooling, and if next week’s PCE and employment data confirm the slowdown, the Fed might just blink and cut rates in May. Market hopes are pinned on Powell holding steady—unless, of course, Trump decides to live-tweet through it.
Futures are up 0.37% ( CME_MINI:ES1! ) this morning, signaling optimism—possibly misplaced—in Trump’s “friendly” overtures toward China. Let’s just say we’re one golf game away from another market tantrum.
Enjoy your weekend, stay alert, and cross your fingers for a quiet Sunday tweet-wise.

(ETH) ethereum "years - phases"The phase of the Ethereum chart in years using colors to represent each year and to visually show what happened during those years. So far this year is cold and losing. Will Ethereum recover and create a new pattern never before seen or will this entire year be in vain while wishing and hoping and believing that the price will turn itself around? The year of 2025 the year of AI.

(BTC) bitcoin "signs"the blue/green line is crossing the purple dotted line. This is a sign representing a transitional phase between moving averages where the short line begins to cross over the patterns of longer time frames. I was looking at this today and though any indicator is never 100% accurate it is always better to see positive signs rather than no signs at all. Could this be the summer of crypto? A positive crypto summer unlike so many previous years? I'm well aware the second quarter just started and summer is not close by 3 months time.

otausa sell orderItaúsa has a strong focus on investing in brands that contribute to Brazil's economic growth. If you have any specific questions about its trading strategies, investment philosophy, or anything else, feel free to ask! 😊

WILL THE S&P 500 COME CRASHING DOWN? TRIPLE RSI DIVERGENCE?!S&P 500 (SPX) Is considered to be one of the primary benchmarks for the U.S economy. Recently it appears to be showing a triple bearish RSI divergence, DMI indicating bearish with ADX above 20, and a bearish MACD on the 1 Month chart. The technical analysis seems to have a highly bearish hypothesis in my opinion. If we give some thought to Ray Dalio's Principles for Dealing with the Changing World Order , some haunting indicators appear to be forming. Could this just be a minor correction? Or is this the beginning of an extended economic downturn?
Disclaimer: Not financial advice.

FHN: Bearish retest after channel break – more downside ahead?First Horizon Corporation is a regional U.S. banking company offering commercial, mortgage, and investment services. It operates mainly across the southern United States and is among the largest regional banks in its sector.
Technical Analysis:
FHN recently broke down from a long-term ascending channel and is now retesting the lower boundary as resistance. Price stalled near 18.65 with weakening bullish momentum. RSI is trending lower and volume on retest is soft. Key downside levels: 15.00, 13.50, and possibly 10.24 if weakness continues.
Fundamentals:
FHN faces headwinds from tightening monetary policy, rising credit costs, and profitability pressures. Regional banks are under investor scrutiny following sector instability. Latest earnings report showed declining margins and weaker guidance.
Scenarios:
Bearish bias – rejection at 18.65 → drop toward 15.00 → 13.50 → 10.24
Bullish reversal – break back above 18.65 → re-entry into channel toward 21.00+

Amazon losing weekly trendline – watch these Fibo levels nextTechnical Analysis
Amazon (AMZN) has broken below its weekly ascending trendline and failed to reclaim the key 0.618 Fibonacci level (180.52). Strong bearish volume and a weakening RSI suggest downside continuation. Key support targets lie at 161.55, 151.21, and 142.58, with extended downside to 119.12.
Fundamentals
Macro pressure from high interest rates and a slowdown in consumer spending weighs on Amazon. Intense competition in AWS and e-commerce adds uncertainty. Upcoming earnings may serve as a catalyst for directional clarity.
Scenarios:
Base case – move down toward 151.21, 142.58, 119.12
Bullish case – break above 180.52 → rally toward 207.52, 241.92

DOW JONES / US30There is a possibility of price correction from the range of 38903.71 towards 39915 and it can be entered as a trade.

Gold Hits Fibonacci 3.618! What’s Next?GOLD (XAU/USD) Quick Analysis – April 2025
Gold just surged to $3,329/oz, reaching the Fibonacci 3.618 extension around $3,338 🚀
The trend remains strongly bullish, but the price is now extended far above key moving averages – signaling potential exhaustion.
Key Levels:
Support: $2,856 (Fibo 2.618)
Next Resistance: $3,635 (Fibo 4.236)
🧭 Outlook:
As long as price holds above $2,856 → the bullish structure remains intact
🎯 Strategy:
Wait for a healthy pullback → buy the dip near support
Or enter on a breakout-retest above $3,338 for potential continuation

(JASMY) jasmy "sectioned macd - wave phase"As seen between the purple lines are the phases of the MACD with no overlap between each of the purple lines. The final bottom phase(5) was reached at which point the price rose to an astonishing 75%. Not sure if these purple lines will be of much use from here on out. I may delete them at some point.

Bitcoin (BTC): Fake-out Above 200EMA | Sellers DominatingBitcoin had a nice rejection yesterday where we failed to form the BOS and break above the local highs, which resulted in a fakeout above the 200EMA and the price falling below that line.
As we see the demand in downward movement, we are keeping our sell target active as long as we are again below the local highs (at $85,750).
Markets sell exhausted, economy doomed....Be sure to have a tight stop-loss and small leverage on any position you would want to open. We expect to see a big liquidation hunting to happen soon thanks to the #China and #USA tariff war.
Swallow Academy
