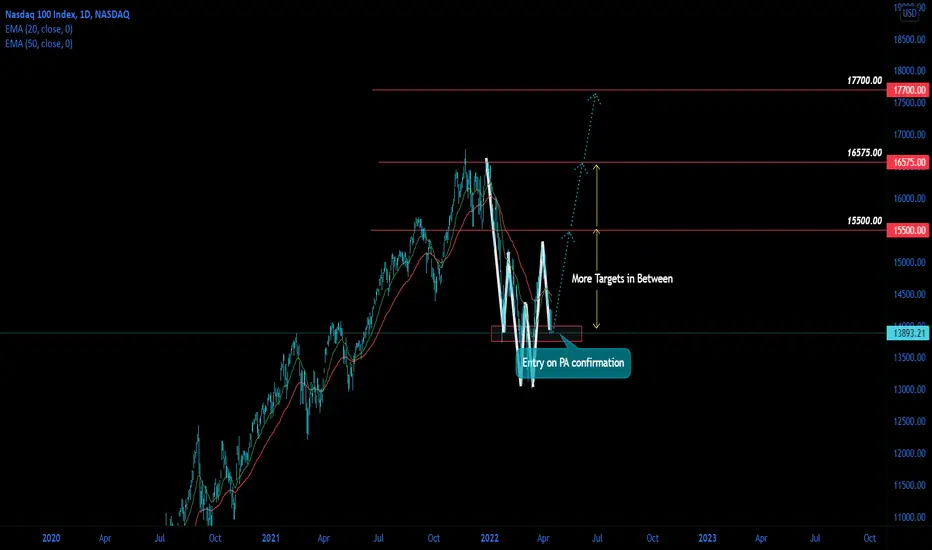
NASDAQ 100 to 17700.00 and BEYONDLooking for the long setup on Nasdaq, contingent to bullish PA being confirmed around buy zone. We will also have target levels in between our main targets highlighted.
USA
GBPUSD ShortHey traders, in today's trading session we are monitoring GBPUSD for a selling opportunity around 1.312 zone, once we will receive any bearish confirmation the trade will be executed.
Trade safe, Joe.

USDCHF LongHey traders, in today's trading session we are monitoring USDCHF for a buying opportunity around 0.835 zone, once we will receive any bullish confirmation the trade will be executed.
Trade safe, Joe.

Mexican IPC BMV - Ascending Triangle1. Uptrend coming since 2020.
2. Consolidation during health emergency,
3. Rising economy beacuase of opening borders and presencial labor.
4. Limit roof standing because of Fed tax rate increase.
%. Waiting for trend continuation completing pattern.
Fundamentals
International relationships
National economy-labor increasing
United States sponsorship on international agreement

USDCAD ShortHey traders, in today's trading session we are monitoring USDCAD for a selling opportunity around 1.271 zone, once we will receive any bearish confirmation the trade will be executed.
Trade safe, Joe.

AUDUSD AnalysisHey traders, in today's trading session we are monitoring AUDUSD for a buying opportunity around 0.737 zone, once we will receive any bullish confirmation the trade will be executed.
Trade safe, Joe.


GBPUSD AnalysisHey traders, in today's trading session we are monitoring GBPUSD for a selling opportunity around 1.307 zone, once we will receive any bearish confirmation the trade will be executed.
Trade safe, Joe.

XAUUSD Selling opportunityHey traders, in today's trading session we are monitoring XAUUSD for a selling opportunity around 1965 zone, once we will receive any bearish confirmation the trade will be executed.
Trade safe, Joe.


USDCHF Swing opportunityHey traders, in today's trading session we are monitoring USDCHF for a long term buying opportunity around 0.932 zone, once we will receive any bullish confirmation the trade will be executed.
Trade safe, Joe.

AUDUSD LONGHey traders, in today's trading session we are monitoring AUDUSD for a buying opportunity around 0.742 zone, once we will receive any bullish confirmation the trade will be executed.
Trade safe, Joe.

USDCAD, BoC to hike rates this week?Hey traders, in this week we are monitoring USDCAD for a selling opportunity around 1.26 zone, in this week we have BoC rate announcement where it's expected for BoC to hike rates by 0.50. this should contribute to CAD strength.
Once we will receive any bearish confirmation the trade will be executed.
Trade safe, Joe.

XAUUSD UpdatesHey traders, XAUUSD already reached an important zone we've been monitoring, in the coming week we are monitoring XAUUSD for a selling opportunity around 1947 zone, once we will receive any bearish confirmation the trade will be executed.
Trade safe, Joe.

USDJPY will continue up?Hey traders, in the coming week we are monitoring USDJPY for a buying opportunity around 124 zone, once we will receive any bullish confirmation the trade will be executed.
Trade safe, Joe.

EURUSD Will continue down?Hey traders, in the coming week we are monitoring EURUSD for a selling opportunity around 1.088 zone, once we will receive any bearish confirmation the trade will be executed.
Trade safe, Joe.

USDCHF Golden Demand zone at 0.93Hey traders, in the coming week we are monitoring USDCHF for a buying opportunity around 0.93 zone, once we will receive any bullish confirmation the trade will be executed.
Trade safe, Joe.


US02YUS02YAlarm in the markets: a part of the US interest rate curve is inverted that has not been in 16 years
US five-year bond yields rose as much as 10 basis points to touch 2.64%, outperforming those on 30-year bonds.
Receive a cordial greeting, In Spain on 08/30/2022
Sincerely, L.E.D.

GBPUSD Strong selling opportunity around 1.308.Hey traders, in today's trading session we are monitoring GBPUSD for a selling opportunity around 1.308 zone, once we will receive any bearish confirmation the trade will be executed.
Trade safe, Joe.

USDJPY ShortHey traders, in today's trading session we are monitoring USDJPY for a selling opportunity around 124.4 zone, once we will receive any bearish confirmation the trade will be executed.
Trade safe, Joe.

USDCHF LongHey traders, in today's trading session we are monitorin USDCHF for a buying opportunity around 0.93400 zone, once we will receive any bullish confirmation the trade will be executed.
Trade safe, Joe.
