XAUUSDGOLD, History might repeat itself?
Above is a technical view on XAUUSD and the most important zones to take in consideration.
Trade safe, Joe.
USA

usdcad short positionEnter the reversal in 2 or 3 steps to improve the risk
position
Stop above point 1

Convenient position for sale #usdcadConvenient position for sale
Swing
Analytical look
Watch list for accurate wood on the climb

"S&P500" Resistance and support zonesNote that the strength of the US dollar is the S&P500. It has been forming a new top for some time. But due to price fatigue, we expect a correction from the ceiling

AUDUSD ShortHey Traders, we didn't received any confirmation from the selling opportunity from 0.707 zone shared the last night. Today the market came with another good sell from 0.71, Once we will notice any bearish confirmation we might consider executing the trade.
Trade safe, Joe.

AUDUSD UPDATESHey Traders, above is an update about our audusd Trade, in current week i'm looking forwards adding more position around 0.707 Zone. Once any confirmation is noticed the trade will be executed.
Trade Safe, Joe.

UNG - Head and Shoulders - Target 13.25, 12.25 UNG formed a Head and Should pattern in the daily chart and recently broke down the neck line. It's looking bearish and would test the 200 DMA around 13.25 and would test 12.25 in next 2-3 months.

USDCHF longHey Traders, in the coming week, we are monitoring USDCHF for a buying opportunity around 0.916, Once we will receive any bullish confirmation the trade will be executed. Trade safe and use proper risk management.
Joe.

EURUSD SWINGHey Traders, in the coming days we are monitoring EURUSD for a swing selling setup around 1.138 zone. we are watching 1.107 Zone as a swing target. once we will receive any bearish confirmation the trade will be executed.
Trade safe, Joe.

AUDUSD ShortHey Traders, today we are monitoring AUDUSD for a selling opportunity around 0.711 zone, once we will receive any bearish confirmation the trade will be executed.
Trade safe, Joe.

XAUUSD LONGHey Traders, in this week we are monitoring XAUUSD for a Buying opportunity around 1775 Zone respecting the bullish trend in combination with the strong Demand and Supply zone. Once we will receive any bullish confirmation the trade will be executed!
Remember always to use a small lot size on gold comparing to the normal lot you use on forex pairs. because XAUUSD movements are violent and it's easy for gold to marginate your account if you have a lack of money management strategy.
Trade safe, Joe.

USDCAD longHey traders, in the coming week we are monitoring USDCAD for a buying opportunity around 1.274 zone, once we will receive any bullish confirmation the trade will be executed.
Trade safe, Joe!

AUDUSD SwingHey Traders, in this week we are monitoring AUDUSD for a long term buying opportunity around 0.711 Zone respecting the strong weekly demand zone in combination with the bullish trend. once we will receive any bullish combination the trade will be executed.
Trade Safe, Joe.

DXY Hey Traders, above is DXY technical analysis, i always recommend DXY analysis prior to trading USD pairs. currently we are watching a couple of zone for a possible bounce. first one around 95.5 and the second one around 94.4. don't forget to be a bit careful especially after fed Chair Powell speech the last night and fears about the new variant, risk for economy and employment and risk for labor market progress.
Trade safe, Joe.

Gold LongHey Traders, today we are monitoring XAUUSD for a buying opportunity around 1780 zone respecting the bullish trend and the strong supply and demand zone, once we will receive any bullish confirmation the trade will be executed.
Trade safe and remember to use proper risk management with gold, because gold movements are so violent comparing to other forex pairs and it's easy for gold to marginate your account if you don't use the right money management plan.
Joe.

GBPUSD LongHey Traders, in the coming week we are monitoring GBPUSD for a buying opportunity around 1.33 zone respecting the support line of the descending channel in combination with weekly demand zone. once we will receive any bullish confirmation the trade will be executed.
Remember to use proper risk management, because in swing trading the movements are more violent comparing to short term trading.
Trade Safe, Joe.

USDJPY SWINGHey Traders, in the coming week we are monitoring USDJPY for a long term buying opportunity around 112.700 Zone respecting the bullish trend in combination with the weekly strong demand zone. Once we will receive any bullish confirmation the trade will be executed.
Trade safe, Joe.

EURUSD Hey Traders, in the coming week we are monitoring EURUSD for a buying opportunity around 1.1245 Zone, once we will receive any bullish confirmation the trade will be executed.
Trade safe, Joe.

DXY Hey Traders, wish a happy weekend for y'all!
i would love to recommend you to take in consideration the USD INDEX analysis in the beginning of every week at least if not everyday. That will help you to trade USD pairs more professional and will help you to spot the direction of USD pairs too.
in the coming week expect a pullback for the dollar index around 95.9 zone towards 96.4, then we might see a potential drop.
Trade Safe and use proper risk management.
Joe.

XAUUSD shortHey Traders, in the coming week we are monitoring XAUUSD for a selling opportunity around 1812 zone, once we will receive any bearish confirmation the trade will be executed. Remember to respect money management guys with gold. movements of gold are more severe than other forex pairs and using a wrong money management with commodities or indices in general will knock you out from the market easily. follow always the beautiful rule of investing, risk small aim high!
Happy weekend, Joe!

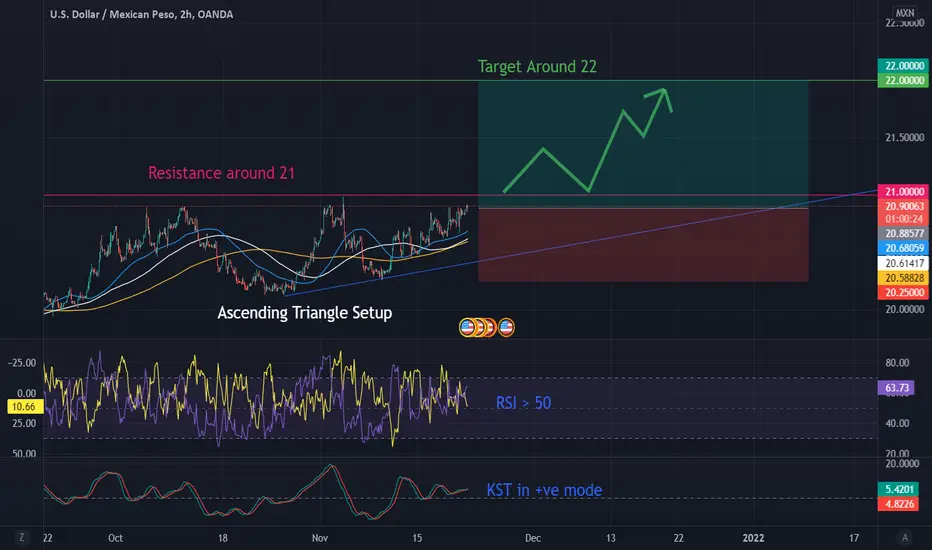
USDMXN to Rally to 22Trend Analysis
The main view of this trade idea is on the 2-Hour Chart. The forex cross USDMXN is currently in an ascending triangle setup with resistance observed around the 21 price level and the support trend line seen around the higher lows of 20.12 and 20.25 respectively. Expectations are for USDMXN to rally towards the 22 price level. Failure of this move will be seen if USDMXN declines below 20.25
On the longer termed Daily Chart USDMXN is trending higher, with the next level of resistance observed around 21.50
Technical Indicators
There has been positive crossovers on USDMXN’s short (50-MA), medium (100-MA) and long (200-MA) term fractal moving averages. USDMXN is also trading above these respective MAs. The RSI is above 50 and the KST is in a positive mode. This indicates a bullish move in USDMXN.
Recommendation
The recommendation will be to go long at market, with a stop loss at 20.25 and a target of 21. This produces a risk/reward ratio of 1.75.
Disclaimer
The views expressed are mine and do not represent the views of my employers and business partners. Persons acting on these recommendations are doing so at their own risk. These recommendations are not a solicitation to buy or to sell but are for purely discussion purposes. At the time of publishing I have exposure to USDMXN.
USDCHF ShortHey Traders, in the coming week we are monitoring USDCHF for a selling opportunity around 0.934 Zone. Once we will receive any bearish confirmation the trade will be executed. trade safe and use proper risk management.
Joe.

USDJPY longHey Traders, in this week we are monitoring USDJPY for a buying opportunity around 114.75 zone, once we will receive any bullish confirmation the trade will be executed.
Trade Safe, Joe.
