USD-BTC


BTC/USD {Parallel Channel} Analysis Hi all!
Time:H1
chart is speaking it self.
If the channel midline is not broken down, the price will rise well TO 13800,
If the midline is broken, the price reacts to the bottom line of the channel and the price gradually increases.
Remember that the trend is our friend and we have to take his hand and go with it.
Traders, if you like this idea or have your opinion about it, write in the comments. We will be happy
Things can change...
The markets are always changing and even with all these signals, the market changes tend to be strong and fast
Thank you for seeing idea . please support us
Good luck.

BTCUSD Let's Sell And Take 1000 Pips Free ♦️Pair : BTC
💢 Vision : Sell
☑️ Entry Point : 11850 - 11900
💲 Target : 11750 / 11600 / 11000
✖️ Stop Lose : Close Daily Candle Above 12000
🔴 Risky Use Small Lot 🔴
⚠️ Reasons To sell ⚠️
🀄️ Trend Break Out
🀄️ Volume Area
🀄️ Golden Zone & Resistance Area
❗️ Risk 5 %
💠 Reward 15 %


!! BTC READY FOR BIG MOVE !! $BTC CHART
Welcome Traders >> We Have Here Opportunity And Direction For $BTC
! Frame : Daily !
! Tools Details On Chart !
♣️ Down Trend Line
♣ Counter Trend
♣ Main Bounce Trend
♣️ Resistance Area + Key Level
♣️ POC
📚 Vision : Buy Or Waiting To Arrive To High Of Trend + Resistance Area + Key Level And Sell From There 📚
🔷 Take Profit Levels : 11300 / 11000/ 10800 / 10500
🔷 Stop Lose Levels : Close Daily Candle Above Resistance Area
!! Please Take care Trading Is Very Risk Don't Risk On Any Position !!

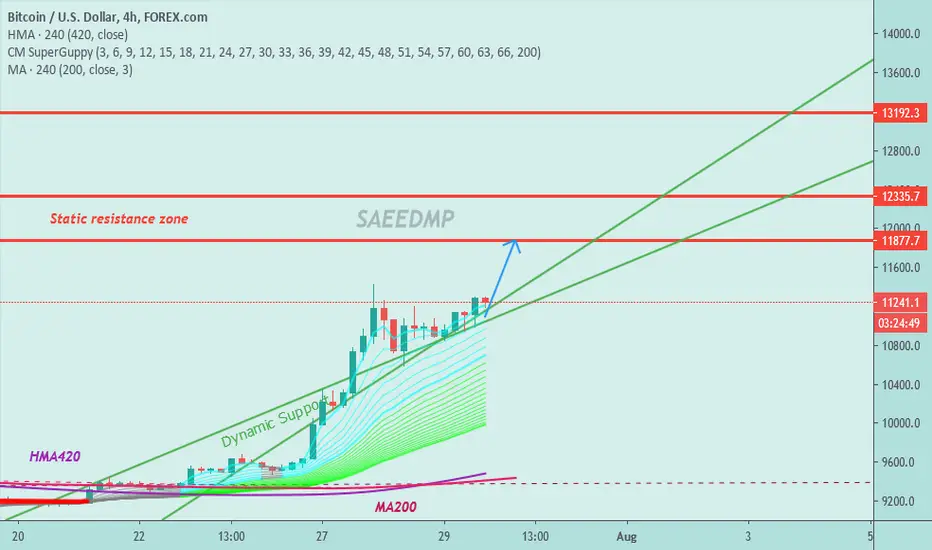
BITCOIN | BTC IS CURRENTLY GIVING US A STRONG PUSH TO THE UPSIDEPLEASE SUPPORT THE IDEA BY SMASHING LIKE AND GIVING A COMMENT <3
Hello Forex Trading Lions! PLEASE ENJOY THE FREE IDEA!
BTC is giving us a bullish engulfing candle on the 4 hourly timeframe if this closes it definitely shows that BTC has potential to go further up.
It also will be a recent new higher high following the moving averages, after such pushes we might see a correction move happening to the moving averages, but looking at technicals this trade definitely looks like a buy
Follow & Check Out My Profile! PEACE <3


BTC SELL UPDATE #1♦ We Have Reach To Target Done ✍️
♣ Entry Point 10700
♣ Profit Point 10580
♣ Total Profit : 120+ Pips Done
Waiting For New Update

$ETH/USD Expects an uptrend from here!Today, I will explain on a daily basis of ETH.
Since the beginning of August, ETH has been repeatedly supporting and resisting on the $ 376 line, and it has been on a downtrend while forming a parallel channel of decline in the short term without giving a sense of medium-term direction. However, the price movement from last week has surpassed this parallel channel, and I feel the strength of the latest momentum.
In the market that gradually raises the low price while raising it, it is difficult for shorts to get out, the consciousness line such as the resistance line does not work, and the trend often continues, but if it continues as it is, today, tomorrow will challenge the $ 376 break.
From there, the game of ETH.
Even if it breaks through $ 376, the strong consciousness line will continue at $ 407 and $ 440, but it is thought that the bottom price has solidified due to the double bottom and the downtrend line, and the future rise may be stronger than before.
How far can we rise toward the end of 2020?
With Ethereum 2.0 ahead, future price increases are expected.


XAUUSD #GOLD Good Buy Now
Welcome Traders >> We Have Here Opportunity And Direction For $GOLD
♦️ We Have Down Trend Area >> Waiting For Break Out
♦️ We Have Fibo Extinction Area » Waiting For Break Out With Trend
♣️ Vision ♣️
Waiting For Break Trend And Buy To Targets
!! Please Take care Trading Is Very Risk Don,t Risk On Any Position !!

Iota - LONGPossible scenario. For now trend is clear - if red channel is broken, we will witness significant retracement.

Bitcoin to $9.8k NextBitcoin is programmed for $9.8k next before any meaningful upside. Do with this as you please, but the chart says is all loud and clear.
//dumpet.setup://.exit.exe
- PennyBags

*BEWARE* WYCKOFF DISTRIBUTION IN FULL EFFECTThis looks like a classic short based on Richard Wyckoff Distribution Schematic. Twitter and everyone is so bullish and Fomo'ing. Funding pays shorts. Long to Short Ratio favors Shorts. Maybe some more up but looks like the big picture shows a massive dump coming in the near future... Beware and trade smart!


Support is being respected, triangle is stretching. BTC is resisting at the current green line support, which tells me it will be heading up slowly until it breaks the big old red resistance line from the 20k.
Good news are coming out and the fear of another bearish move is decreasing, so on my view there will be a slow move to the upside in between that triangle.
Leave your feedback, and have a good one.

Don't miss the great buy opportunity in NEOUSDTrading suggestion:
. There is a possibility of temporary retracement to suggested support line (9.59874). if so, traders can set orders based on Price Action and expect to reach short-term targets.
Technical analysis:
. NEOUSD is in a range bound and the beginning of uptrend is expected.
. The price is above the 21-Day WEMA which acts as a dynamic support.
. The RSI is at 52.
Take Profits:
TP1= @ 12.55810
TP2= @ 14.50133
TP3= @ 16.87258
TP4= @ 20.61120
TP5= @ 24.30101
SL= Break below S2
❤️ If you find this helpful and want more FREE forecasts in TradingView
. . . . . Please show your support back,
. . . . . . . . Hit the 👍 LIKE button,
. . . . . . . . . . . Drop some feedback below in the comment!
❤️ Your Support is very much 🙏 appreciated! ❤️
💎 Want us to help you become a better Forex trader ?
Now, It's your turn !
Be sure to leave a comment let us know how do you see this opportunity and forecast.
Trade well, ❤️
ForecastCity English Support Team ❤️


BTC Possible Bull RunPatiently allowing Price to react to hitting its support mark or waiting to find a breakout of its minor descend trend line potentially putting us in a great RR opportunity for this pair. The most logical entry would be close to our Entry Speculation Region instead of gambling our capitol.

XRP LONG..BOTTOMED OUTxrp showing Bullish divergence which is making me sure that it is ready for a move..i am expecting 17% move for short term
