ETH- Looking incredibleHi,
ETH, is looking incredible for anyone with capital to invest. We've been in this bear pennant since June. We're seeing week after week of lower highs and it finally looks like we will be breaking out soon.
A move out of the pattern will send us to test local lows of the June capitulation $800, but possibly finding a brief support at $1000 once more. If we can retest and move lower, a good target to accumulate would be $400-$600.
Good luck and be patient
USD-BTC

SHORT TERM CPI RALLY🇺🇸 US inflation dropped to 7.1%
Market Pumping Hard on CPI News 📈 In spite of the "bullish numbers" Inflations stays high. Don't forget about 2% as the perfect target. Still, These numbers pushed the market upwards for short term ✅ Be Careful with Volatility 😉

Gobble Gobble DXY Hold onto your pantiesBroken below the wedge.... US markets closed, liquidity thin... overall bearish for USD until next week when Powell comes to give markets their scolding...
I expect a big move down for DXY and up for BTC today

DXY - it's timeIt's time to push up - handle formed and showing strong resistance - stocks at ceilings and exhausted.

DXY - beautiful inversed HSAs expected - dragged down by overly euphoric stocks - but now forming an inversed HS bottom with a target inside the bullflag again - expecting only up from here.

BTC/USDT BINANCEBTC/USDT BINANCE
4H hollows
A price rebound at the Golden Ratio of Fibonacci Retracement is expected, as it is the main Resistance Area.
Sideways movement between Support & Resistance Area is expected until Monday.
BTC = $16,855.78 +1.63%
13.32 ETH -2.47%
Market Cap: $846,597,962,034
24h Vol: $82,580,266,331
Dominance: BTC: 38.2%
ETH: 18.2%
Good Luck
#CryptoHellas Team

DXY EXPECTED MOVES AS we all know later today we have dxy cpi news
we have nothing to do with fundamentals what we can is waiting patientaly todays closing
dxy recently breaks descending b wedge in daily tf (where lots of traders opened there positions )
they were fomo traders in my dairy lets have a look deeply in technical factors
1) dxy recently breaks descending broadening wedge in daily tf what we get from this long uptrend is over now)
2) but what we will do of bulish flag ( ideal pattern for trend continuation) a big question mark
3) personally i will wait for strong rejection from descending b wedge tl area to enter if this not happend then will wait for bulish flag pattern breakout for further shorts in gbp eur btc and others

$AVAX Wall Street Cheat SheetSimilar to Bitcoin, lots of alts showing the same pattern. Leaving the anger stage heading up for the last bear market rally before we hit full depression.

USDT.DBreaking this curve could lead to a retest of 0.618 fib level + broken resistance that would act now as support - if we don't break it - we will go for a retest of last highs forming a double top or continuing the trend.

DXY - will keep parabolicStill expeting DXY to be parabolic and keep the curve's pace.
I don't see no reason for any correction so far.

#btc $BTCIn 1H TF Bitcoin is in BULLISH Market.
Always give attention to Strong Levels and Important Zone

DXY - 120 incomingBig resistances are too strong of a magnet to get omitted - $120 is the previous big top - if we don't reach it out, it means it's gonna go passed it next time.
Therefore possible double retest before small relief.
Also remember we just broke a big weekly/monthly descending wedge. Dollar is going for the 160's in this bear market.
Cheers!
DXY has been dancing, but......but it has been dancing below the curve - and now that it touched the green area - it is free to free-fall for some time and take a rest - this makes me bullish for stocks and crypto. Parabolic time has ended.

DXY daily opiumThe theory is that the crypto market will bottom soon after the mid-term elections, assuming the FED might slower the pace of rate increases or stop them altogether.

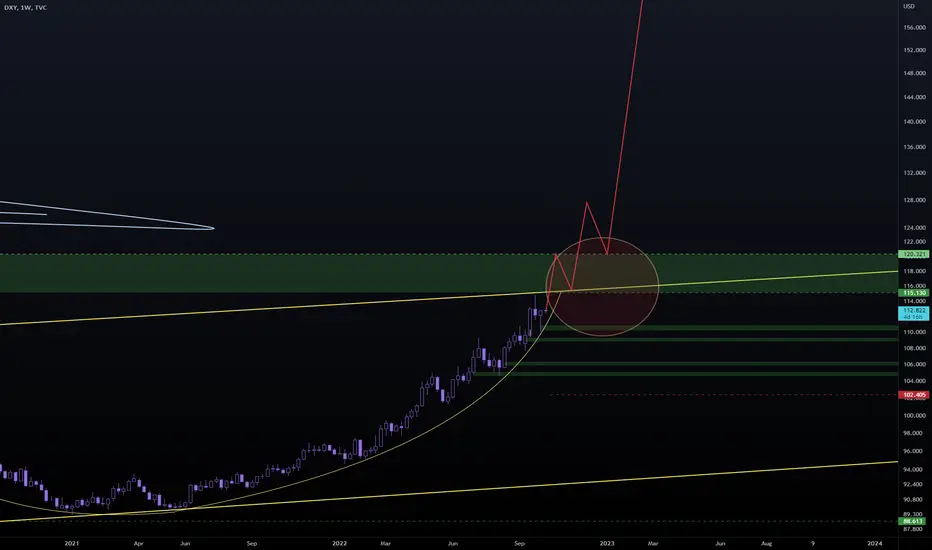
DXY Weekly perspectiveSo here it is - so far it is going for my bear market target.
First we will attack the green area around 115$ and correct from it - and total target until 2024 should be all-time-highs at $150+.
That's where we can focus on re-buying assets.

U.S. Dollar Currency Index (DXY). Hyperinflation Star of CajunWelcome Hyperspace Travelers,
The Quantum Codex reveals all. I am but a simple scrub swimming in a pool of knowledge.
Quantum Formation: Star X1.10.10.00.11
This is a macro Time-Series on a 4-hour timeframe.
Fractal Error Allowed: 7 days
This is a extreme probability event in parallel of a domino effect.
In my eyes at least..
Scaling of ghost fractal adheres to grid codex.
This is what a cycle of extreme hyperinflation would look like with a full scale black swan event in each asset class. Bitcoin included.
This suggest hyperinflation on a scale we have never seen before. Except; this thrusts us into the 4th industrial revolution and 10 years of incredible growth for everyone in all sectors. It is "transitory"... as the FEDs put it..
Do you see why?
Please see the following ideas to understand my perspective of such a narrative:
BTC.D ---> TP: 95.00^
\\
BTC.USD ---> TP: $1700.00
\\
SPX ---> TP: $1100.00
\\
UVXY ---> TP: $1300 - $1800 -- R/S included.
\\
EUR.USD -- GBP.USD -- GBP.JPY -- USD.CAD -- AUD.USD -- DXY// Net Weight Distribution on a Scale never before seen in Forex.
\\
_________________________________________________________
Find the Clues...
Do you see it?
Do you feel it??
Can you figure it out?
Most likely not, but hey...
Think about it..
Doubt it.
I never said I was going to make it easy.
I see what I want you to see.
This is my opinion and mine alone. But sharing is caring ;).
I am but a simple Cajun and what is presented is for Cajuns only.
All others might get hurt.
Do you believe?
Thanks for Pondering the Unknown with Me,
Glitch420

Using DXY to Predict Bitcoin 📈 Winter for the EuroHi Traders, Investors and Speculators 📉📈
Ev here. Been trading crypto since 2017 and later got into stocks. I have 3 board exams on financial markets and studied economics from a top tier university for a year.
If you're following multiple markets you'll e aware that the Euro trades at a 2-Decade low against the dollar, and that the Dollar Index (DXY) is trading at a 20 year high. Things are about to get much worse for the Euro - winter is coming. Russia recently added to Europe's energy crisis by shutting of key gas taps. With this, there is pressure on the ECB / Europe Central Bank to tighten monetary policy. As noted by Bloomberg, there are expectations for the central bank of Europe to raise rates with 75 basis points as soon as Thursday. This is bearish for the Euro, and bullish for the Dollar, as imports from the US increases over winter time. This is, in short, how I come to my conclusion and expectation of the continued rise of the DXY over the next few months. The only natural target, would be the previous ATH / resistance zone.
EURUSD Chart :
This brings us to the next topic, the correlation of the DXY to the Bitcoin chart. For this, it's quite simple to use the correlation coefficient technical indicator and too overlap the BTCUSDT chart. By doing so, we realize that there is a mostly inverse relationship between BTC and the DXY. Thus, to state the obvious, if the DXY continues to rise, we can expect the price of BTC to continue to fall. Interestingly enough, there are two confirmations around the $12K price mark for Bitcoin.
Thank you for watching, tune in again tomorrow !
_________________
👀 Follow us here on TradingView for daily updates and trade ideas on crypto , stocks and commodities 💎
👍Hit like & Follow 🔔
We thank you for your support !
CryptoCheck

BTC to test December '17 TopI don't think this level will break, but I will be monitoring price action around the 19,500 support area.
Expecting a bounce off of the 2017 High.
If it breaks, hold onto your hats.
Not financial advice.

BTC/USDBoring days with crypto.
You can trade between two lines which acummulation zone.
Or avoid trade with this choppy.
Choose your destiny!
*Please share your opinion on it, write in the comments. Dont forget some cheers bravo. "
Teşekkürler.

btc h1 trading planwaiting for breakout small bear flag chart pattern, this will be seen more clearly on the 15m time frame
and still wating for brekout big chanel chart pattern on the 1h
anything can happen to the market, I don't want to take a big risk for this trade so I'm still waiting for confirmation (breakout) no matter where it moves
#safeyourmoney

BTC/USD LONG Looks literally same like scamp pump last week ... sunday dump till wednesday scam dump on cpi reports than pump all week ... next wendsday is fomc so i bet they will dumping it till fomc report and than scam pump .. there was also strong corelation with spx and they looks bit bearish (imgur.com) so theres a option btc will follow again .. also options for 29 july are pretty bullish (imgur.com) + long short ration also showing that theres more liquidity on other side mean like under 22k (imgur.com)

Possible end of the downtrendThere is a divergence on the monthly frame on each of the indicators (RSI, CCI, HIST, MOM). Can we see a deep correction towards the Fibonacci 61 level or the end of the bearish trend to advance towards a new top?
anything could happen..
What do you think?

XRP USD : AND THEN THIS ONE TIME XRP WENT FROM $0.40 TO $40.00FOLLOW ME FOR MORE UPDATES AND ANALYSIS, LIKE AND COMMENT IF YOU APPRECIATE THIS CONTENT.
XRP is looking extremely bullish to me. Its been in the massive cup and handle formation for the past few years. The measured move would bring XRP to at least $40 and probably higher once the FOMO sets in. Also there is a Bull flag on the shorter term time frame that would give XRP a measured move to about $8 then there will be a correction and then straight up to $40 bucks to complete the measured move. XRP is in a great accumulation zone as you can see distribution flipped to accumulation whilst the MACD and Stoch RSI are heading up. A big move is in the works. dont get caught up in all this bearish crap everyone is talking about. Its suddenly like everyone is running around like the apocalypse is coming, its kind of comical to watch. Nothing new is happening, this stuff has been happening for many many years even before most of us were born. Anyways I digress, good luck out there everyone. This is not financial or trading advice this is just my opinion.
