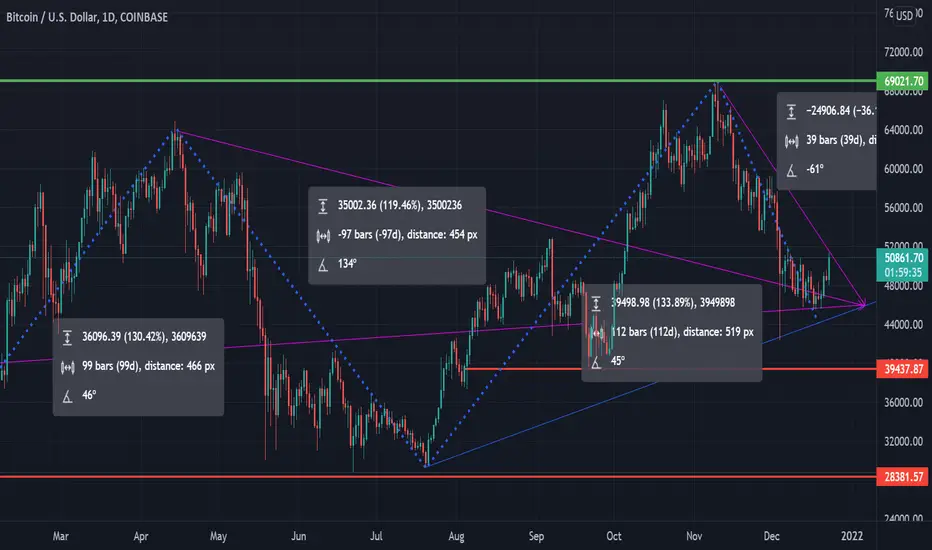
BTC - 44K SUPPORT WILL BRING BTC to 48K TREND (LONG)Hello trading friends,
This is a BTC update depending on the last trends.
it's important to have good risk management and goal target.
44K is an important point, same time a whale point, and can be seen as support.
For time frame long term - this could be seen as support. most also forgot that we are coming from the 69K trend.
We will see how this level will handle the coming time - 44K is very important for the breakout of BTC.
This with the backtesting trend of ETN tool expecting.
Have a great day.
This is not a trading call - manage always your risk.
USD-BTC

Eth confidently breaks through the drop downEth confidently breaks through the drop down.
The main trend is still down.
Possible correction

Ethereum, like bitcoinEthereum, like bitcoin, seems to be preparing for a reversal.
Whether it will be a trend change or just a correction is unknown.
But already now there are signs of a slight weakness of the upward trend.

BITCOIN MAJOR PULLBACK SINCE $69K ATHFollowing a 50% drop from $69k ATH, Bitcoin resume its major deadcat bounce with a 20% increase so far. The market has multiply supply zones (S1, S2, S3) that needs to be invalidated before we change bias to Bullish.
I will be looking at short opportunities on the major supply zones. There is no reason to long on short term at the moment. Analysis on price action progress will be uploaded accordingly.
Note; The only bullish signal will be a strong uptrend on the weekly.

BTCUSD 8 HourPrice has reached broken support looking left, forming a new lower high here which aligns with the descending trend line. Personally, I am anticipating for price to make one more leg lower to the higher timeframe key level support, where a reversal may occur & buyers may step in to take control again around 30K... However, if price makes a breakout to the upside of this region price is stalling, then we could see the market shift & for buyers to keep pushing price higher.

bitcoin buy 1hr higher low setup, price being back at 4hr HL support (demand zone), wick rejections on the 15m

$BTCUSDT UPDATE!!!!Hi Traders,
Please refer to the recording for the next price levels and scenarios.
Thanks
MS

BTCUSD LongHey Traders, in today's trading session we are monitoring BTCUSDT for a buying opportuntiy around 47000 zone, once we will receive any bullish confirmation the trade will be executed.
Trade safe, Joe.

#Bitcoin's Bull-Run Continuation...Bitcoin wicked down to $40,800 during November, shocking traders and causing extreme fear. With that, came Technical Indicators alerting us to the fact that #Bitcoin was extremely oversold. RSI hit previous support it had when it fell to $30,000 over summer. #Bitcoin is highly resilient and on-chain indicators, supply, historical data, TA. and fundamental analysis, are screaming that #Bitcoin will continue onwards towards $100,000 and maybe even well past that by next summer. Certainly, I don't have a crystal ball and ANYTHING could happen so, this is merely my opinion based on analytics, confluences, and discussion amongst others. This is NFA (Not financial advice)...
Bitcoin is going to $150K+ by July '22.
Why?
- Bitcoin/USD is showing great buy volume on the weekly chart. The bottom seems to have formed near the $40K region (due to liquidation mostly).
- Shorts are get destroyed right now, expect a squeeze to push us past key levels of resistance
- BTC/USD showing signs of reversal
- BTC/USD chart details support and key levels where $BTC has bounced
- RSI SMA 14 details simple moving average which $BTC has not fallen below after a rally from the bottom during halving cycle... KEY LEVEL TO WATCH!
- RSI has same levels of support as BTC/USD and is showing signs of reversal as well
- RSI showing extremely oversold at $40-44K area
- Remember, RSI works as a leading indicator... we are just getting started
- Market sentiment has improved... F&GI* reaching "fear" levels
- WEEKLY MACD showing possible convergence of of bullish cross in coming months
- 1D MACD has already signaled a bullish cross... we are far from seeing a bearish cross. I would expect one closer to next summer unless there is FUD
Overall, Bitcoin is extremely oversold and 2022 will bring new opportunities for crypto markets (regulation, adoption, awareness, and most importantly, time).
DESTINY ARRIVES ALL THE SAME.
MERRY CHRISTMAS!
PS. Refer to my links to related ideas below to see how these predictions have played out so far :) Enjoy!
*F&GI: Fear & Greed Index

Dogecoin Dogeusd They have marked the supports and resistances of the DOGE.
I send you a cordial greeting, Merry Christmas and a prosperous 2022
In Spain on 12/23/2021

BITCOIN BTC USDWhat will 2022 bring us
Being the recent rise of: 115,63% in 110 days
Being the recent drop of: 34,17% in 36 days
A cordial greeting. Merry Christmas and a Happy New Year 2022, best wishes.
In Spain on 12/23/2021
Two universal currencies and a world currencyI can see the human corruption within the gold and us dollar.

ChilizJust 6 days left to see ufthis happens.
Hello guys, todaya new analysis where i expect chiliz can go further.. max pointat 0.50$
How i know this? We are repeating same pattern.
Seems we must touch 0.30$ before a new high.
Which new coin do you want?

Bitcoin price analysis is bearish today.BTC/USD saw another quick spike to $58,600 in the afternoon.
The closest support around $56,000 is likely to be tested next.
Bitcoin price analysis is bearish today as the $58,300 resistance has rejected further upside for the third time this week. Therefore, we expect BTC/USD to finally see a strong move lower to continue moving along with the overall downtrend.

TURKISH LIRA GOES PARABOLIC LIKE BITCOINThe chart pretty much explains itself. If the Turkish Central Bank can't interfere at the right time and place, we'll be seeing the Turkish Lira losing even more value and USD becoming equal to 8.70 Turkish Liras in December. Then we might see a retraction just like Bitcoin as the parabolic growth becomes unsustainable.

💡Don't miss the great Sell opportunity in BTCUSDHi dear traders
For now, you need to think about selling bitcoin 😊
Do you want to know what will happen to Bitcoin in the coming hours !?😉 See my analysis and take advantage of it.
🙏If you have an idea that helps me provide a better analysis, I will be happy to write in the comments🙏
❤️Please, support this idea with a like and comment!❤️

GALA USD Possible Head & Shoulders Just bought 100$ worth of Galla at 0.0933$ (1071 Gala) just because it was - 11%...
I know nothing about this coin.

XYO opportunity to buy low before the trend resumesI think we are facing a demand zone both in XYO-USD and XYO-BTC pairs, this should be the right moment to set some trade up.
XYO had a big rip in the past days followed by boring decline, maybe we'll hit enough demand to resume the run up.
Let's try with the usual 1:3 trade setup!

dxy to the moonnnnnnn November 12th 2021: DXY Refreshing 2021 Tops Weighs on Peers
EUR/USD:
(Italics: previous analysis)
Weekly timeframe:
Down 1.0 percent on the week, prime support at $1.1473-1.1583 had its lower wall clipped. As a result, further selling may materialise, targeting a 61.8% Fibonacci retracement at $1.1281 as well as a 1.618% Fibonacci projection from $1.1237.
On top of this, price taking out 2nd November low (2020) at $1.1603 suggests the currency pair is transitioning to a downtrend.
Daily timeframe:
In what was a relatively subdued session Thursday.
Europe’s shared currency eked out modest losses against its US counterpart and refreshed year-to-date lows. Fibonacci support derived from $1.1420-1.1460 (comprises a 78.6% Fibonacci retracement and a 1.272% Fibonacci projection) made an entrance.
Upstream features trendline resistance, taken from the high $1.2254, shadowed by Quasimodo support-turned resistance at $1.1689.
Immediate flow has been trending lower since late May tops at $1.2266. Also confirming downside is the relative strength index (RSI) accepting the 50.00 centreline as indicator resistance since late October. What this tells traders is that momentum is lower (average losses exceeding average gains) and might continue until shaking hands with oversold territory.
H4 timeframe:
Following Wednesday’s bold losses, bearish forces pulled Thursday to within a stone’s throw of Quasimodo support at $1.1438—joined by a 1.618% Fibonacci expansion at $1.1441, a 1.618% Fibonacci projection coming in from $1.1444 and a 100% Fibonacci projection from $1.1431.
Coupled with the daily timeframe’s Fibonacci support at $1.1420-1.1460, H4 support between $1.1431 and $1.1444 could have buyers attempt to establish a floor. Willing bids are likely to zero in on resistance at $1.1495.
Continuation moves below H4 support, on the other hand, tips the weight in favour of daily price engulfing its Fibonacci support.
H1 timeframe:
Out of the relative strength index (RSI), the indicator reveals early bullish divergence (positive momentum: average gains beginning to exceed average losses), despite price action forging fresh troughs in recent hours.
Technical space, nonetheless, shows that sub $1.1467 resistance we have scope to take aim at $1.14.
Observed Technical Levels:
The combination of daily Fibonacci support from $1.1420-1.1460, H4 support between $1.1431 and $1.1444 and the H1 timeframe’s RSI chalking up bullish divergence, echoes a potential short-term recovery. However, recognising the downtrend in this market, any upside attempt may be capped by H1 resistance at $1.1467.

BitcoinVery clean target for the next weeks (or next week)
Price just broke this resistance around the level 63550 and is finishing is retest.
We now can expect the next impulse and yes, breaking a new All Time High soon
Both analysis and fundamentals are huge indicators for this month and December being big for bitcoin (and also for gold)


dxy go roof time to go regularDollar hits 16-month high as inflation fears set it up for best week since June
TOKYO (Reuters) - The U.S. dollar headed for its best week in almost five months against major peers on Friday, amid bets for earlier Federal Reserve interest rate hikes after data this week showed the fastest U.S. inflation in three decades.
The dollar index, which measures the currency against six peers, hit a fresh 16-month high of 95.266, on track for a 1.05% gain this week, the most since the period ended June 20.
The euro slipped back to a 16-month low at $1.1436, and sterling dipped to $1.3354, its weakest level this year.
"We close out the week with the USD thoroughly breaking out," Chris Weston, head of research at brokerage Pepperstone, wrote in a client note. "I am seeing signs of an impending mean reversion play in the USD, but in this flow, dips are a buying opportunity."
Data on Wednesday showed a broad-based rise in U.S. consumer prices last month at the fastest annual pace since 1990, calling into question the Fed's contention that price pressures will be "transitory" and fuelling speculation that policymakers would lift interest rates sooner than previously thought.
Markets now price a first rate increase by July and a high likelihood of another by November.
"We still think market pricing has room to firm further, especially in 2023, which can further support USD," Commonwealth Bank of Australia (OTC:CMWAY) strategist Kimberley Mundy wrote in a client note.
By contrast, "interest rate futures are too aggressive in pricing in (European Central Bank) rate increases for next year considering ECB policymakers are not budging from their ultra‑dovish guidance," giving scope for further euro weakness, she said.
Traders will be watching inflation readings from a University of Michigan survey, along with JOLTS job openings data later in the global day.
New York Fed president John Williams speaks at an online conference, potentially offering a glimpse of how policymakers are reacting to the red-hot inflation print.
European Central Bank chief economist Philip Lane also speaks on a panel at a separate event.
The dollar rose as high as 114.30 yen on Friday, the strongest since Nov. 1.
It touched a three-week high of 0.92295 Swiss franc.
Swiss National Bank governing board member Andrea Maechler said at an event late on Thursday the Swiss franc remained in demand as a safe haven investment with market uncertainties elevated due to the ongoing COVID-19 pandemic.
The risk-sensitive Australian dollar sank as low as $0.7277 for the first time in more than a month.
The New Zealand dollar dropped as low as $0.69965, a level not seen since Oct. 14.
In crypto, bitcoin traded just south of $65,000, down from a record $69,000 earlier in the week.
Ether changed hands at around $4,800,within sight of the all-time peak of $4,868.79 reached Tuesday.
