USD-BTC

Bitcoin Bounce to 55K-57K AreaUsing the Tom Demark Sequential System on the daily chart we look to have a 1 to 4 Day correction to the upside toward the area of the breakdown/previous support after a full 9 Day count to the downside. Also the selling looks exhausted on the rsi. Once we get close to resistance I will be putting in a stop loss to preserve profits. I do think this is not the end of the bull market but a major pull back to the low 40k area or lower would be painful.

BTC BITCOIN Inverse head and shoulder formation in a channelHello Traders,
Here the 2 hour chart of Bitcoin . Clearly we are in a perfect downward trend channel. We also see the formation of the right shoulder of the inverse head shoulder formation.
Target for this head and shoulder formation is 65000 usd when breaking through the neckline.
Currently watch carefully what happens to the price. If it drops below 50000 then the main head and shoulder formation is no longer valid. It is very well possible that the price will rebound and then break through the neckline to the old top with the forming of the right shoulder.
As often, a picture say more than a thousand words!

XLM USD Daily Chart BreakdownWe had a bounce off the 50 MA after breaking upwards with a nice show of force.
If BTC behaves we go yellow.
If BTC booms, we go green.
If BTC misbehaves we go red.
Key levels are outlined on the chart. This is all based on previous movement (which is NOT guaranteed to continue).
I just enjoy looking at what has happened in the past so I can see different possibilities for the future. This is NOT investment advise and I am NOT a financial advisor. I'm just here because my dad sent me.
I am waiting on the MACD to cross.
RSI looking good.
Holding the 20MA is absolutely essential right now.
What color do you think we'll see?
Leave it in the comments.
Thank!

PolkaDOT fighting for life! This is my honest take on PolkaDOT. That bitcoin drop was harsh and sudden no doubt about it, but with every crash comes an opportunity. It's unclear what will happen in the next day or so, but here are some potential trade set-ups that can be made.
For a long position, I would like to see a close on the 4H chart above the .618 Fibonacci extension line. It has some slight resistance and would also show a reversal into a short-term bull trend. From there we could expect it to make it back to where it was consolidating before the crash.
For a short position, It's getting close to breaking through the previous support after that flash crash. From there I could assume that it will climb downwards to test the next support level. But... after that, if that breaks. It won't be pretty. All the gains from March and April would be erased and I would then predict a bear trend for Dot.
While the project has a lot of hype and overall I expect the bull trend to continue it all mainly depends on one large factor. BITCOIN. Only time will tell.
NOTE: This is not financial advice. Enter your own trades at your own risk with a plan!


DXY WATCH PARTY: TIME TO PAY ATTENTION!DXY UPDATE // Looks like its at support. All risk markets over extended SPX500 hit my target pretty much (see below), DXY correction overextended, Euro overextended, Gold is up by 16% and BTC 28% in that same time. BTC hits major resistance at 64K and I dont see it being broken without a correction; also check the wave count on my latest BTC chart below. I see a short term reversal for the DXY and smart money is slowly exiting the risk markets into gold and fiat. So when do we know crypto and stock get a correction? When the DXY prints that double bottom (W). Its right at the 0.5 FIB support level. Also look at that confluence with my correction target for BTC; 8% on the last correction from ATH and now with the neckline of inverse hs as a target; (59,5K) also exactly 8%. Too much confluence and too much hyper euphoria; this cant keep going on forever, sorry to kill the bull vibe... I'm alway a bit early and I have slight regret I didnt ride waves today but better that than riding this wave down because esp. in alts it will be fierce. Dropping this here on a low time frame to keep an eye out... Newly arrived retail has no clue.
SHORT / MID TERM:
- DXY: LONG
- GOLD: LONG
- Risk assets: SHORT
IMPORTANT: this is not financial advice, trade or invest based on your own risk and research.

UNIFUND on UNISWAPBought into this coin when it began leveling out from its decent. If it can break declining trendline and reverse we could see 20% - 50% gains from this level. We could really use a boost in volume to see this coin soar. Good Luck trading. UNIFUND on UNISWAP

THE ZONE OF ZONES NOT HIT INTO BTC POSSIBLE SHORT BELOW 57KHello trading friends,
As you did read before our day trade target of 57600 hit, as we did add before.
We have confirmed the trend for the next target for BTC, and it's possible that we can enter into a new short since the zone of zones not HIT . The whale effect shows a stable trend. we did not break out the zone of zones part.
# Know that we go with the market flow, and this is a day trade update for BTC. This can change with the time as we track data of whales every time again and possible more increase and downtrend signals for next time, but for now data shows a possible short.
At this moment taking a long could be risky. but these are time frame update , we updating depending on the time frame by Day expecting charts. markets change, and we change with the markets directly.
What is possible expecting target
Below 57K could be a possible target. exactly we will update later.
What means this at all?
That's its possible that we can see a short update next time into btcusdt.
What shows whale data?
a stable trend.
can we increase further?
Yes, its possible as its stable trend - but there are more chances for breakdown trend.
@@Follow/like for more 24/7 Live updates on tradingview.@@
Discipline is the key to success - Take profit - Learn from your mistakes and never give up!
The reason 1 that 90% of traders lose, not because they can't trade, but because they trade emotionally.
if this appeals to you then learn yourself first before starting with trading.
#Always do your own research don't follow us or someone else blindly
---> Have a great day 😃

EOS/USDI've been focusing on the EOS/BTC pair but looking at the EOS/USD is looking solid!
Clear breakout of accumulation, I'm targeting $8.90 for a 217% (2.2x move and with the market moving up in bullish fashion, this might happen sooner than rather than later..
Use stop losses and trade within your means. Good luck traders, make some bank!
Alfa

DXY one more marginal high then roll overI think DXY can stretch to 96.4 or so, then we are at major resistance and could pullback, helping push crypto+metals+commodities upwards. We've been bullish since the lows so let's see...

THETAUSDTWe have to wait for the price reaction, to the red trend line
If supported by this trend line, there is a good investment opportunity

LINKUSDTIf the price can break its high resistance, it will create a good opportunity for investment

USDTBTC | Long Term Analysisit's maybe hard to believe that this could happen but the crypto market is very heavily volatile, it can move between price like we never had seen in any other markets, so I found it normal for BTC to reach 6000$ again, that vision is supported by technical analysis and understanding of how normal market works and applies that on the crypto markets and when applying that we can predict long term analysis that the herd could never believe, cuz they think it's huge and it's impossible, but regarding the volatile history of crypto, we saw 90% correction in prices and its not an anomaly, that's the normal price behavior in the crypto market, I found it a high probability for BTC to come around 11k this year, 6k in the couple years ..
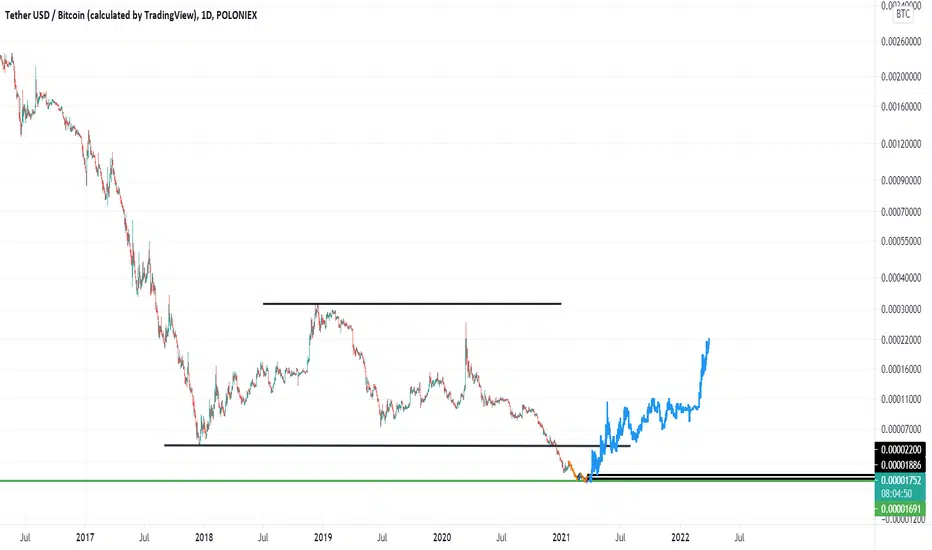
USDTBTC | Change in price behavior Confirms BTC MEGA Correction Change in price behavior for the USDTBTC downtrend Confirms an upcoming major BTCUSD Correction,, a correction was already expected from BTC all time highs of 61k ,, now the setups have revealed more confirmations on that prediction,

Eur/Usd Channel Scheme
Target one: sell 1.17710
Target two: buy 1.20600
Don't forget to look the economic calendar.
THANK YOU!
GOOD LUCK!


LTCUSDTIf the price closes above the red range in the daily time frame, the price is likely to increase up to the range of $ 272

💡Don't miss the great buy opportunity in BTCUSDT @BitcoinTrading suggestion:
There is a possibility of temporary retracement to the suggested support line (48280. 40 ).
. If so, traders can set orders based on Price Action and expect to reach short-term targets."
Technical analysis:
. BTCUSDT is in an uptrend, and the continuation of the uptrend is expected.
. The price is above the 21-Day WEMA, which acts as a dynamic support.
. The RSI is at 58.
Take Profits:
TP1= @ 52640.00
TP2= @ 55018.00
TP3= @ 56600.00
TP4= @ 58400.00
TP5= @ 61100.00
SL= Break below S2
❤️ If you find this helpful and want more FREE forecasts in TradingView
. . . . . Please show your support back,
. . . . . . . . Hit the 👍 LIKE button,
. . . . . . . . . . Drop some feedback below in the comment!
❤️ Your Support is very much 🙏 appreciated!❤️
💎 Want us to help you become a better Forex trader?
Now, It's your turn!
Be sure to leave a comment. Let us know how you see this opportunity and forecast.
Trade well, ❤️
ForecastCity English Support Team ❤️


DOT/USD: My Prediction For Next 12H !This My Prediction for Next Hours...
Stay Careful...
Greetings.

DOT/USDT REVERSAL LONG TRADEI got into a $DOT trade and lets just say it both has and hasn't been the greatest experience. Making the noob mistake of not checking the higher timeframes I got into the trade around 34.. pretty much at resistance.. if I get out of this one alive I'll be lucky to still call myself a trader...
Just a little analysis based on what $DOT seems to currently be doing..
It's just an idea but I hope it sparks an even better strategy in your mind..
Thank you in advance

