USDCAD Potential upsides as we approach FOMCHey traders, in today's trading session we are monitoring USDCAD for a buying opportunity around 1.354 zone, once we will receive any bullish confirmation the trade will be executed.
Trade safe, Joe.
Usd-cad

USDCAD Potential For Bearish ContinuationOn H4, with the price moving below ichimoku cloud and showing a shoulder head pattern , we have a bearish bias that the price may drop form the sell entry at 1.36567, which is in line with the 38.2% fibonacci retracement and overlap to the take profit at 1.33537 where the 61.8% fibonacci retracement is. Alternatively, the price may rise to the stop loss at 1.37981, which is in line with the 61.8% fibonacci retracement.
Please be advised that the information presented on TradingView is provided to Vantage (‘Vantage Global Limited’, ‘we’) by a third-party provider (‘Everest Fortune Group’). Please be reminded that you are solely responsible for the trading decisions on your account. There is a very high degree of risk involved in trading. Any information and/or content is intended entirely for research, educational and informational purposes only and does not constitute investment or consultation advice or investment strategy. The information is not tailored to the investment needs of any specific person and therefore does not involve a consideration of any of the investment objectives, financial situation or needs of any viewer that may receive it. Kindly also note that past performance is not a reliable indicator of future results. Actual results may differ materially from those anticipated in forward-looking or past performance statements. We assume no liability as to the accuracy or completeness of any of the information and/or content provided herein and the Company cannot be held responsible for any omission, mistake nor for any loss or damage including without limitation to any loss of profit which may arise from reliance on any information supplied by Everest Fortune Group.

USD CAD - FUNDAMENTAL DRIVERSUSD
FUNDAMENTAL OUTLOOK: BULLISH
BASELINE
With headline CPI above 8% and Core CPI seeing another acceleration in the SEP CPI data, the Fed is under pressure to continue hiking rates and ramping up QT. Markets expect another 75bsp hike in NOV and currently prices the terminal rate at 4.89%. The Fed is on a data-dependent (meeting-by-meeting) policy stance, meaning incoming growth, inflation and jobs data remains a key driver for short-term USD volatility where we expect a cyclical reaction with incoming data for both the USD and US10Y (good data expected to be supportive for the USD while bad data is expected to pressure the USD). Our expectation for a softer USD this past week played to our advantage with a punchy move lower in the Dollar. The week ahead is filled with lots of US economic data and the FOMC policy decision which will all be important drivers for the USD.
POSSIBLE BULLISH SURPRISES
With the Fed signalling a data dependent policy stance, we expect a cyclical reaction from the USD with incoming US data. Thus, extremely good growth, inflation or jobs data is expected to trigger short-term bullish reactions in the USD. If the cyclical outlook continues to weaken, the USD’s safe haven status still matters. Any incoming catalysts that increase deep recession fears and triggers strong moves lower in risk assets & bonds can trigger safe haven flows into the USD. With a lot priced for the Fed and USD, the bar is high for hawkish Fed surprises, but any aggressive Fed speak talking up a >5.0% terminal rate can trigger further USD upside.
POSSIBLE BEARISH SURPRISES
With the Fed signalling a data dependent policy stance, we expect a cyclical reaction from the USD with incoming US data. Thus, extremely bad growth, inflation or jobs data is expected to trigger short-term bearish reactions in the USD. If the cyclical outlook starts to improve, the USD’s safe haven status still matters. Any incoming catalysts that decrease deep recession fears and triggers strong moves higher in risk assets & bonds can trigger safe haven outflows out of the USD. With a lot priced in for the Fed and the USD, it won’t take much to disappoint on the dovish side. Any big concerns about growth from Fed speakers could trigger outflows.
BIGGER PICTURE
The fundamental outlook for the USD remains bullish as long as the Fed stays hawkish and cyclical concerns put pressure on risk sentiment. The data dependent stance from the Fed means that short-term data surprises can pull the USD either way and would be our preferred way of trading the Dollar right now. We have a very excited economic calendar for the US in the week ahead, with lots of important economic data and the FOMC meeting. For the econ data our expectation is for a cyclical reaction where very good data is expected to support the USD and very bad data expected to pressure the USD. As for the Fed, the main focus will be on whether the FOMC confirms a downshift in the pace and size of hikes.
CAD
FUNDAMENTAL OUTLOOK: NEUTRAL
BASELINE
Recent economic data has shown some deterioration for the growth outlook with three consecutive months of contraction in jobs, falling house prices, and a deceleration in both core and headline CPI . The previous jobs data gave the CAD a decent lift with its first jobs gain in four weeks, but at 21K jobs added, the job market is still down 92K jobs in the last four months. Despite very hawkish comments from Gov Macklem heading into the Oct meeting, the bank surprised markets with a 50bsp hike when markets were pricing in a 75bsp hike. The bank also stated there is increased risks of a recession during 1H23. This saw initial downside in the CAD as one would expect, but the press conference not closing the door on another 50bsp hike saw some reprieve. Due to the economic outlook, we think the CAD might struggle to in the weeks ahead, unless Oil prices can push higher to provide some upside from a terms of trade perspective.
POSSIBLE BULLISH SURPRISES
Catalysts that see upside in Oil (deteriorating supply outlook, ease in demand fears, OPEC developments) could trigger bullish CAD reactions. As a risk sensitive currency, and catalyst that causes big bouts of risk on sentiment could trigger bullish reactions in the CAD. After the BoC’s dovish shift but leaving the door open for another 50bsp, a very strong labour report could see markets price in a higher chance for a 50bsp and support the CAD.
POSSIBLE BEARISH SURPRISES
Catalysts that trigger downside in oil (deteriorating demand outlook, ease in supply shortage, less supply constraints, OPEC developments) could be a negative catalyst for the CAD as well. As a risk sensitive currency, and catalyst that causes big bouts of risk off sentiment could trigger bearish reactions in the CAD. After the BoC’s dovish shift markets are only pricing in a 25bsp for the next meeting, and a big enough miss could see further downside in the CAD and lower terminal rate expectations.
BIGGER PICTURE
The bigger picture outlook for the CAD remains neutral for now. Given the clear risks to the growth outlook (recent negative econ data and fall in oil prices) we remain cautious on the currency. Furthermore, with lots of good news priced, and with the BoC close to terminal rate expectations, our preferred way of trading the CAD is lower on clear short-term negative catalysts. In the week ahead the overall risk tone will be important from a risk sentiment perspective, but majority of focus will be on the jobs report on Friday which markets will use as a guide for the size of hike to expect from the bank at the upcoming meeting.

USDCAD - SHORT SETUPPlease this is not a financial advise rather its an aid to point you to the possible direction!

USD CAD - FUNDAMENTAL DRIVERSUSD
FUNDAMENTAL OUTLOOK: BULLISH
BASELINE
With headline CPI above 8% and Core CPI seeing another acceleration in the SEP CPI data, the Fed is under pressure to continue hiking rates and ramping up QT. Markets expect another 75bsp hike in NOV and currently prices the terminal rate at 4.89%. The Fed is on a data-dependent (meeting-by-meeting) policy stance, meaning incoming growth, inflation and jobs data remains a key driver for short-term USD volatility where we expect a cyclical reaction with incoming data for both the USD and US10Y (good data expected to be supportive for the USD while bad data is expected to pressure the USD). Our expectation for a softer USD this past week played to our advantage with a punchy move lower in the Dollar. The week ahead is filled with lots of US economic data and the FOMC policy decision which will all be important drivers for the USD.
POSSIBLE BULLISH SURPRISES
With the Fed signalling a data dependent policy stance, we expect a cyclical reaction from the USD with incoming US data. Thus, extremely good growth, inflation or jobs data is expected to trigger short-term bullish reactions in the USD. If the cyclical outlook continues to weaken, the USD’s safe haven status still matters. Any incoming catalysts that increase deep recession fears and triggers strong moves lower in risk assets & bonds can trigger safe haven flows into the USD. With a lot priced for the Fed and USD, the bar is high for hawkish Fed surprises, but any aggressive Fed speak talking up a >5.0% terminal rate can trigger further USD upside.
POSSIBLE BEARISH SURPRISES
With the Fed signalling a data dependent policy stance, we expect a cyclical reaction from the USD with incoming US data. Thus, extremely bad growth, inflation or jobs data is expected to trigger short-term bearish reactions in the USD. If the cyclical outlook starts to improve, the USD’s safe haven status still matters. Any incoming catalysts that decrease deep recession fears and triggers strong moves higher in risk assets & bonds can trigger safe haven outflows out of the USD. With a lot priced in for the Fed and the USD, it won’t take much to disappoint on the dovish side. Any big concerns about growth from Fed speakers could trigger outflows.
BIGGER PICTURE
The fundamental outlook for the USD remains bullish as long as the Fed stays hawkish and cyclical concerns put pressure on risk sentiment. The data dependent stance from the Fed means that short-term data surprises can pull the USD either way and would be our preferred way of trading the Dollar right now. We have a very excited economic calendar for the US in the week ahead, with lots of important economic data and the FOMC meeting. For the econ data our expectation is for a cyclical reaction where very good data is expected to support the USD and very bad data expected to pressure the USD. As for the Fed, the main focus will be on whether the FOMC confirms a downshift in the pace and size of hikes.
CAD
FUNDAMENTAL OUTLOOK: NEUTRAL
BASELINE
Recent economic data has shown some deterioration for the growth outlook with three consecutive months of contraction in jobs, falling house prices, and a deceleration in both core and headline CPI. The previous jobs data gave the CAD a decent lift with its first jobs gain in four weeks, but at 21K jobs added, the job market is still down 92K jobs in the last four months. Despite very hawkish comments from Gov Macklem heading into the Oct meeting, the bank surprised markets with a 50bsp hike when markets were pricing in a 75bsp hike. The bank also stated there is increased risks of a recession during 1H23. This saw initial downside in the CAD as one would expect, but the press conference not closing the door on another 50bsp hike saw some reprieve. Due to the economic outlook, we think the CAD might struggle to in the weeks ahead, unless Oil prices can push higher to provide some upside from a terms of trade perspective.
POSSIBLE BULLISH SURPRISES
Catalysts that see upside in Oil (deteriorating supply outlook, ease in demand fears, OPEC developments) could trigger bullish CAD reactions. As a risk sensitive currency, and catalyst that causes big bouts of risk on sentiment could trigger bullish reactions in the CAD. After the BoC’s dovish shift but leaving the door open for another 50bsp, a very strong labour report could see markets price in a higher chance for a 50bsp and support the CAD.
POSSIBLE BEARISH SURPRISES
Catalysts that trigger downside in oil (deteriorating demand outlook, ease in supply shortage, less supply constraints, OPEC developments) could be a negative catalyst for the CAD as well. As a risk sensitive currency, and catalyst that causes big bouts of risk off sentiment could trigger bearish reactions in the CAD. After the BoC’s dovish shift markets are only pricing in a 25bsp for the next meeting, and a big enough miss could see further downside in the CAD and lower terminal rate expectations.
BIGGER PICTURE
The bigger picture outlook for the CAD remains neutral for now. Given the clear risks to the growth outlook (recent negative econ data and fall in oil prices) we remain cautious on the currency. Furthermore, with lots of good news priced, and with the BoC close to terminal rate expectations, our preferred way of trading the CAD is lower on clear short-term negative catalysts. In the week ahead the overall risk tone will be important from a risk sentiment perspective, but majority of focus will be on the jobs report on Friday which markets will use as a guide for the size of hike to expect from the bank at the upcoming meeting.

USDCAD Potential for Bearish ContinuationOn H4, with the price moving below ichimoku cloud and showing a shoulder head pattern , we have a bearish bias that the price may drop form the sell entry at 1.36008, which is in line with the 23.6% fibonacci retracement and overlap to the take profit at 1.33537 where the 61.8% fibonacci retracement is. Alternatively, the price may rise to the stop loss at 1.37480, which is in line with the5 0% fibonacci retracement .
Please be advised that the information presented on TradingView is provided to Vantage (‘Vantage Global Limited’, ‘we’) by a third-party provider (‘Everest Fortune Group’). Please be reminded that you are solely responsible for the trading decisions on your account. There is a very high degree of risk involved in trading. Any information and/or content is intended entirely for research, educational and informational purposes only and does not constitute investment or consultation advice or investment strategy. The information is not tailored to the investment needs of any specific person and therefore does not involve a consideration of any of the investment objectives, financial situation or needs of any viewer that may receive it. Kindly also note that past performance is not a reliable indicator of future results. Actual results may differ materially from those anticipated in forward-looking or past performance statements. We assume no liability as to the accuracy or completeness of any of the information and/or content provided herein and the Company cannot be held responsible for any omission, mistake nor for any loss or damage including without limitation to any loss of profit which may arise from reliance on any information supplied by Everest Fortune Group.

Sell USDCADGood day, traders! Don't forget to put your thumbs up and write your comment if you like the idea
USDCAD sell from 1.3800 and 1.3850. Once again tested the monthly target and, taking into account the removal and return for support in the region of 1.3800, you need to look for an oncoming lane. Further growth potential will be only with a breakdown and fixation above 1.3850. First objective standard, global objective test 1.3600 and ideally update 1.3500
DISCLAIMER:
The opinion of the author may not coincide with yours! Keep this in mind and consider in your trading transactions before making a trading decision.

USDCAD Potential For Bearish ContinuationOn H4, with the price moving below ichimoku cloud , we have a bearish bias that the price may drop form the sell entry at 1.36008, which is in line with the 23.6% fibonacci retracement and overlap resistance to the take profit at 1.33537, where the 61.8% fibonacci retracement is. Alternatively, the price may rise to the stop loss at 1.37480, which is in line with the50% fibonacci retracement.
Please be advised that the information presented on TradingView is provided to Vantage (‘Vantage Global Limited’, ‘we’) by a third-party provider (‘Everest Fortune Group’). Please be reminded that you are solely responsible for the trading decisions on your account. There is a very high degree of risk involved in trading. Any information and/or content is intended entirely for research, educational and informational purposes only and does not constitute investment or consultation advice or investment strategy. The information is not tailored to the investment needs of any specific person and therefore does not involve a consideration of any of the investment objectives, financial situation or needs of any viewer that may receive it. Kindly also note that past performance is not a reliable indicator of future results. Actual results may differ materially from those anticipated in forward-looking or past performance statements. We assume no liability as to the accuracy or completeness of any of the information and/or content provided herein and the Company cannot be held responsible for any omission, mistake nor for any loss or damage including without limitation to any loss of profit which may arise from reliance on any information supplied by Everest Fortune Group.

USDCAD H4: Bearish outlook seen, further downside below 1.3720On the H4 time frame, prices are facing bearish pressure from the resistance zone at 1.3720 which coincides with the graphical resistance zone, descending channel’s resistance and Fibonacci confluence levels. A pullback to the 1.3720 resistance zone presents an opportunity to play the drop to the support target at 1.3380, in line with the 38.2% Fibonacci retracement. Prices are holding below the Ichimoku cloud as well, supporting the bearish bias.

Today’s Notable Sentiment ShiftsUSD – The dollar sank more than 1% against a basket of peers on Wednesday as weakening economic data firmed views that the Federal Reserve will slow the pace of its hiking cycle, sending the euro back above parity with the greenback for the first time in a month.
CAD – The Canadian dollar weakened on Wednesday after the Bank of Canada raised interest rates less than investors expected.
Reuters succinctly summarised: The BoC increased its benchmark rate by half a percentage point to 3.75%, coming up short on calls for another 75 basis points move, as it forecast the economy would stall over the next three quarters.”

USD/CAD Outlook (26 October 2022)The USDCAD retraces from the recent high to trade at the 1.3660 support level. This move lower is driven by the weakness of the DXY and also respects the downward trendline.
Tomorrow, the Bank of Canada is due to release its decision with regards to the interest rates. Markets are expecting an increase of 75bps to take the interest rate to a high of 4.00%
The last interest rate hike on the 7th of September saw the USDCAD fall briefly. This is a likely scenario again, with the price likely to fall toward the 1.35 support level.

USDCAD Double bottom and important monthly zoneHey traders, in today's trading session we are monitoring USDCAD for a buying opportunity around 1.352 zone, once we will receive any bullish confirmation the trade will be executed.
Trade safe, Joe.

USDCAD Potential For Bearish ContinuationOn H4, with the price moving below ichimoku cloud , we have a bearish bias that the price may drop form the sell entry at 1.36511, which is in line with the 23.6% fibonacci retracement and overlap to the take profit at 1.34681, where the 50% fibonacci retracement is. Alternatively, the price may rise to the stop loss at 1.37498, which is in line with the50% fibonacci retracement.
Please be advised that the information presented on TradingView is provided to Vantage (‘Vantage Global Limited’, ‘we’) by a third-party provider (‘Everest Fortune Group’). Please be reminded that you are solely responsible for the trading decisions on your account. There is a very high degree of risk involved in trading. Any information and/or content is intended entirely for research, educational and informational purposes only and does not constitute investment or consultation advice or investment strategy. The information is not tailored to the investment needs of any specific person and therefore does not involve a consideration of any of the investment objectives, financial situation or needs of any viewer that may receive it. Kindly also note that past performance is not a reliable indicator of future results. Actual results may differ materially from those anticipated in forward-looking or past performance statements. We assume no liability as to the accuracy or completeness of any of the information and/or content provided herein and the Company cannot be held responsible for any omission, mistake nor for any loss or damage including without limitation to any loss of profit which may arise from reliance on any information supplied by Everest Fortune Group.

USDCAD Potential For Bearish DropOn H4, with the price moving below ichimoku cloud, we have a bearish bias that the price may drop form the sell entry at 1.37769, which is in line with the 50% fibonacci retracement and previous swing high to the take profit at 1.35642, where the 38.2% fibonacci retracement is. Alternatively, the price may rise to the stop loss at 1.39007, which is in line with the previous swing high.
Please be advised that the information presented on TradingView is provided to Vantage (‘Vantage Global Limited’, ‘we’) by a third-party provider (‘Everest Fortune Group’). Please be reminded that you are solely responsible for the trading decisions on your account. There is a very high degree of risk involved in trading. Any information and/or content is intended entirely for research, educational and informational purposes only and does not constitute investment or consultation advice or investment strategy. The information is not tailored to the investment needs of any specific person and therefore does not involve a consideration of any of the investment objectives, financial situation or needs of any viewer that may receive it. Kindly also note that past performance is not a reliable indicator of future results. Actual results may differ materially from those anticipated in forward-looking or past performance statements. We assume no liability as to the accuracy or completeness of any of the information and/or content provided herein and the Company cannot be held responsible for any omission, mistake nor for any loss or damage including without limitation to any loss of profit which may arise from reliance on any information supplied by Everest Fortune Group.

USDCAD H4: Bearish outlook seen, further downside below 1.3800On the H4 time frame, prices are facing bearish pressure from the resistance zone at 1.3800 which coincides with the graphical resistance zone, descending channel’s resistance and Fibonacci confluence levels. A pullback to the 1.3800 resistance zone presents an opportunity to play the drop to the support target at 1.3585, in line with the 88.6% Fibonacci retracement and 100% Fibonacci extension. Prices are holding below the Ichimoku cloud as well, supporting the bearish bias.

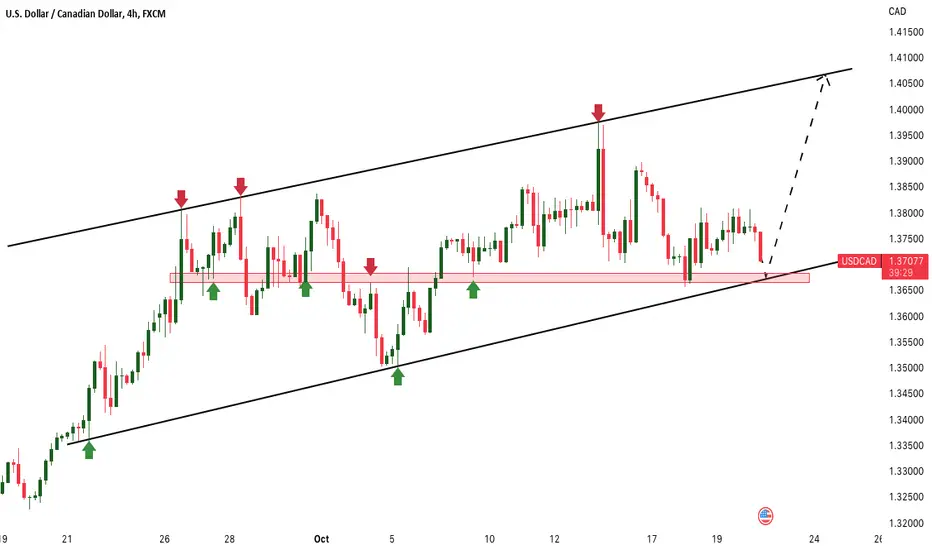
USDCAD: strong bullish scenario ahead the coming FOMCHey traders, in tomorrow's trading session we are monitoring USDCAD for a buying opportunity around 1.36000 zone, once we will receive any bullish confirmation the trade will be executed.
Trade safe, Joe.

USDCAD Potential For Bullish RiseOn H4, with the price crossing the ichimoku cloud , we have a bullish bias that the price may rise from the buy entry at 1.37207, which is in line with the overlap support to the take profit at 1.39775, where the swing high is. Alternatively, the price may drop to the stop loss at 1.35642, where the pullback support is.
Please be advised that the information presented on TradingView is provided to Vantage (‘Vantage Global Limited’, ‘we’) by a third-party provider (‘Everest Fortune Group’). Please be reminded that you are solely responsible for the trading decisions on your account. There is a very high degree of risk involved in trading. Any information and/or content is intended entirely for research, educational and informational purposes only and does not constitute investment or consultation advice or investment strategy. The information is not tailored to the investment needs of any specific person and therefore does not involve a consideration of any of the investment objectives, financial situation or needs of any viewer that may receive it. Kindly also note that past performance is not a reliable indicator of future results. Actual results may differ materially from those anticipated in forward-looking or past performance statements. We assume no liability as to the accuracy or completeness of any of the information and/or content provided herein and the Company cannot be held responsible for any omission, mistake nor for any loss or damage including without limitation to any loss of profit which may arise from reliance on any information supplied by Everest Fortune Group.

USDCAD: Targeting new highs?Hey traders, in today's trading session we are monitoring USDCAD for a buying opportunity around 1.36600 zone, once we will receive any bullish confirmation the trade will be executed.
Trade safe. Joe.
USDCAD Potential For Bullish RiseOn H4, with the price crossing the ichimoku cloud, we have a bullish bias that the price may rise from the buy entry at 1.37207, which is in line with the overlap support to the take profit at 1.39775, where the swing high is. Alternatively, the price may drop to the stop loss at 1.36577, where the overlap support is.
Please be advised that the information presented on TradingView is provided to Vantage (‘Vantage Global Limited’, ‘we’) by a third-party provider (‘Everest Fortune Group’). Please be reminded that you are solely responsible for the trading decisions on your account. There is a very high degree of risk involved in trading. Any information and/or content is intended entirely for research, educational and informational purposes only and does not constitute investment or consultation advice or investment strategy. The information is not tailored to the investment needs of any specific person and therefore does not involve a consideration of any of the investment objectives, financial situation or needs of any viewer that may receive it. Kindly also note that past performance is not a reliable indicator of future results. Actual results may differ materially from those anticipated in forward-looking or past performance statements. We assume no liability as to the accuracy or completeness of any of the information and/or content provided herein and the Company cannot be held responsible for any omission, mistake nor for any loss or damage including without limitation to any loss of profit which may arise from reliance on any information supplied by Everest Fortune Group.

USDCAD H1: Bearish outlook seen, further downside below 1.38200On the H1 time frame, we are seeing bearish market structure formed with prices approaching the resistance zone at 1.38200, in line with the 78.6% Fibonacci retracement and 100% Fibonacci extension levels. A pullback to the 1.38200 resistance zone presents an opportunity to play the drop to the support target at 1.36800. This support zone lines up with the 61.8% Fibonacci retracement and is a zone that prices interacted with multiple times. Stochastic is approaching resistance at 96.35 as well where we could see a reversal below this level, in line with prices.

USDCAD Sell signal to the end of the yearThe USDCAD pair has been following for a very long time our 1W trading pattern and as per our trading plan on November 01 2021, it reached our 1.36000 target for 2022 already:
As you see the projection couldn't have been better and this approach is a great way for long-term investors to benefit with relatively low risk. Currently however we shift our focus on the medium-term and the 1D time-frame where the pair has a Bearish Divergence according to its 1D RSI. As shown while the price action has been on Higher Highs, the RSI is on Lower Highs.
The last two times this Bearish Divergence emerged, the price hit both the 1D MA50 (blue trend-line) and the 1D MA200 (orange trend-line) with ease and even dipped below the 0.618 Fibonacci retracement level. Our medium-term target before this year is out is the 1D MA50 itself. Traders who want to pursue more risk, can target the 1D MA200, whose fair projection by December should be slightly above the 0.786 Fib.
-------------------------------------------------------------------------------
** Please LIKE 👍, SUBSCRIBE ✅, SHARE 🙌 and COMMENT ✍ if you enjoy this idea! Also share your ideas and charts in the comments section below! This is best way to keep it relevant, support me, keep the content here free and allow the idea to reach as many people as possible. **
-------------------------------------------------------------------------------
You may also TELL ME 🙋♀️🙋♂️ in the comments section which symbol you want me to analyze next and on which time-frame. The one with the most posts will be published tomorrow! 👏🎁
-------------------------------------------------------------------------------
👇 👇 👇 👇 👇 👇
💸💸💸💸💸💸
👇 👇 👇 👇 👇 👇

BCOUSD Potential For Bearish DropOn H4, with the price breaking the ascending trendline and below ichimoku cloud, we would hold a bearish bias. The price is showing a double top pattern, if the pattern is formed, we can expect to sell at 1.35071, which is the neckline of the double top pattern. The take profit is at 1.32230, where the overlap support is. Alternatively, the price may rise to the stop loss at 1.38491, where the previous swing high is.
Please be advised that the information presented on TradingView is provided to Vantage (‘Vantage Global Limited’, ‘we’) by a third-party provider (‘Everest Fortune Group’). Please be reminded that you are solely responsible for the trading decisions on your account. There is a very high degree of risk involved in trading. Any information and/or content is intended entirely for research, educational and informational purposes only and does not constitute investment or consultation advice or investment strategy. The information is not tailored to the investment needs of any specific person and therefore does not involve a consideration of any of the investment objectives, financial situation or needs of any viewer that may receive it. Kindly also note that past performance is not a reliable indicator of future results. Actual results may differ materially from those anticipated in forward-looking or past performance statements. We assume no liability as to the accuracy or completeness of any of the information and/or content provided herein and the Company cannot be held responsible for any omission, mistake nor for any loss or damage including without limitation to any loss of profit which may arise from reliance on any information supplied by Everest Fortune Group.

Usdcad longUsdcad long postion set out based on our community analysis
Show up us your analysis in comments
