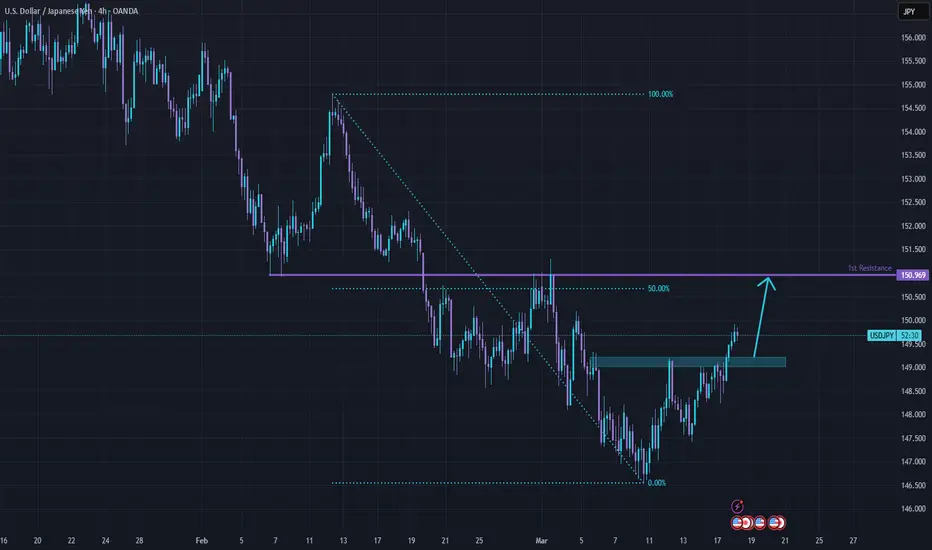
USDJPY - Fake BreakdownHello Traders !
The USDJPY failed to break the support level (149.356 - 148.639).
Currently, The resistance line is broken !
So, I expect a bullish move📈
_______________
TARGET: 150.580🎯
Usd-jpy

USDJPY Breakout And Potential RetraceHey Traders, in today's trading session we are monitoring USDJPY for a selling opportunity around 149.300 zone, USDJPY was trading in an uptrend and successfully managed to break it out. Currently is in a correction phase in which it is approaching the retrace area at 149.300 support and resistance area.
Trade safe, Joe.

Bearish drop?USD/JPY is reacting off the resistance level which is a pullback resistance that aligns with the 127.2% Fibonacci extension and the 61.8% Fibonacci retracement and could reverse from this level to our take profit.
Entry: 149.44
Why we like it:
There is a pullback resistance level that aligns with the 127.2% Fibonacci extension and the 61.8 Fibonacci retracement.
Stop loss: 150.97
Why we like it:
There is an overlap resistance level that is slightly above the 50% Fibonacci retracement.
Take profit: 147.54
Why we like it:
There is a pullback support level.
Enjoying your TradingView experience? Review us!
Please be advised that the information presented on TradingView is provided to Vantage (‘Vantage Global Limited’, ‘we’) by a third-party provider (‘Everest Fortune Group’). Please be reminded that you are solely responsible for the trading decisions on your account. There is a very high degree of risk involved in trading. Any information and/or content is intended entirely for research, educational and informational purposes only and does not constitute investment or consultation advice or investment strategy. The information is not tailored to the investment needs of any specific person and therefore does not involve a consideration of any of the investment objectives, financial situation or needs of any viewer that may receive it. Kindly also note that past performance is not a reliable indicator of future results. Actual results may differ materially from those anticipated in forward-looking or past performance statements. We assume no liability as to the accuracy or completeness of any of the information and/or content provided herein and the Company cannot be held responsible for any omission, mistake nor for any loss or damage including without limitation to any loss of profit which may arise from reliance on any information supplied by Everest Fortune Group.

Bullish momentum to extend?USD/JPY has reacted of the resistance level which is a pullback resistance and could potentially rise from this level to the upside.
Bearish reversal?USD/JPY is rising towards the resistance level which is an overlap resistance that aligns with the 61.8% Fibonacci retracement and the 127.2% Fibonacci extension and could reverse from this level to our take profit.
Entry: 149.44
Why we like it:
There is an overlap resistance level that aligns with the 61.8% Fibonacci retracement and the 127.2% Fibonacci extension.
Stop loss: 150.97
Why we like it:}
There is an overlap resistance level that is slightly above the 50% Fibonacci retracement.
Take profit: 147.54
Why we like it:
There is a pullback support level.
Enjoying your TradingView experience? Review us!
Please be advised that the information presented on TradingView is provided to Vantage (‘Vantage Global Limited’, ‘we’) by a third-party provider (‘Everest Fortune Group’). Please be reminded that you are solely responsible for the trading decisions on your account. There is a very high degree of risk involved in trading. Any information and/or content is intended entirely for research, educational and informational purposes only and does not constitute investment or consultation advice or investment strategy. The information is not tailored to the investment needs of any specific person and therefore does not involve a consideration of any of the investment objectives, financial situation or needs of any viewer that may receive it. Kindly also note that past performance is not a reliable indicator of future results. Actual results may differ materially from those anticipated in forward-looking or past performance statements. We assume no liability as to the accuracy or completeness of any of the information and/or content provided herein and the Company cannot be held responsible for any omission, mistake nor for any loss or damage including without limitation to any loss of profit which may arise from reliance on any information supplied by Everest Fortune Group.

USDJPY Channel Down to make an important decision.The USDJPY pair has been trading within a Channel Down pattern since the January 10 High. During that time it technically got rejection upon every 4H MA100 (green trend-line) contact or close contact into a new Bearish Leg.
Three out of those four Bearish Legs have been -3.16% so even if a rejection does happen at the top (Lower Highs trend-line) of the Channel Down, you can still be expecting 145.350 as a Target.
If however the 4H RSI Bullish Divergence on Higher Lows prevails and causes the price to break above the Channel Down, we will accept the small loss on the short and go long instead, targeting the 2.0 Fibonacci extension at 156.000. A lower Target in that scenario can also be Resistance 2 (154.800).
-------------------------------------------------------------------------------
** Please LIKE 👍, FOLLOW ✅, SHARE 🙌 and COMMENT ✍ if you enjoy this idea! Also share your ideas and charts in the comments section below! This is best way to keep it relevant, support us, keep the content here free and allow the idea to reach as many people as possible. **
-------------------------------------------------------------------------------
Disclosure: I am part of Trade Nation's Influencer program and receive a monthly fee for using their TradingView charts in my analysis.
💸💸💸💸💸💸
👇 👇 👇 👇 👇 👇

Potential bullish rise?USD/JPY has bounced off the pivot which has been identified as an overlap support and could rise to the 1st resistance.
Pivot: 148.14
1st Support: 147.58
1st Resistance: 149.25
Risk Warning:
Trading Forex and CFDs carries a high level of risk to your capital and you should only trade with money you can afford to lose. Trading Forex and CFDs may not be suitable for all investors, so please ensure that you fully understand the risks involved and seek independent advice if necessary.
Disclaimer:
The above opinions given constitute general market commentary, and do not constitute the opinion or advice of IC Markets or any form of personal or investment advice.
Any opinions, news, research, analyses, prices, other information, or links to third-party sites contained on this website are provided on an "as-is" basis, are intended only to be informative, is not an advice nor a recommendation, nor research, or a record of our trading prices, or an offer of, or solicitation for a transaction in any financial instrument and thus should not be treated as such. The information provided does not involve any specific investment objectives, financial situation and needs of any specific person who may receive it. Please be aware, that past performance is not a reliable indicator of future performance and/or results. Past Performance or Forward-looking scenarios based upon the reasonable beliefs of the third-party provider are not a guarantee of future performance. Actual results may differ materially from those anticipated in forward-looking or past performance statements. IC Markets makes no representation or warranty and assumes no liability as to the accuracy or completeness of the information provided, nor any loss arising from any investment based on a recommendation, forecast or any information supplied by any third-party.

Bullish bounce?USD/JPY is falling towards the support level which is an overlap support that aligns with the 127.2% Fibonacci extension and the 71% Fibonacci retracement and could bounce from this level to our take profit.
Entry: 147.31
Why we like it:
There is an overlap support level that aligns with the 127.2% Fibonacci extension and the 71% Fibonacci retracement.
Stop loss: 146.54
Why we like it:
There is a pullback support level.
Take profit: 148.14
Why we like it:
There is a pullback resistance level.
Enjoying your TradingView experience? Review us!
Please be advised that the information presented on TradingView is provided to Vantage (‘Vantage Global Limited’, ‘we’) by a third-party provider (‘Everest Fortune Group’). Please be reminded that you are solely responsible for the trading decisions on your account. There is a very high degree of risk involved in trading. Any information and/or content is intended entirely for research, educational and informational purposes only and does not constitute investment or consultation advice or investment strategy. The information is not tailored to the investment needs of any specific person and therefore does not involve a consideration of any of the investment objectives, financial situation or needs of any viewer that may receive it. Kindly also note that past performance is not a reliable indicator of future results. Actual results may differ materially from those anticipated in forward-looking or past performance statements. We assume no liability as to the accuracy or completeness of any of the information and/or content provided herein and the Company cannot be held responsible for any omission, mistake nor for any loss or damage including without limitation to any loss of profit which may arise from reliance on any information supplied by Everest Fortune Group.

Falling towards 50% Fibonacci support?USD/JPY is falling towards the support level which is a pullback support that aligns with the 50% Fibonacci retracement and could bunce from this level to our take profit.
Entry: 148.03
Why we like it:
There is a pullback support level that aligns with the 50% Fibonacci retracement.
Stop loss: 149.23
Why we like it:
There is a pullback support level that lines up with he 78.6% Fibonacci retracement.
Take profit: 149.23
Why we like it:
There is a pullback resistance level.
Enjoying your TradingView experience? Review us!
Please be advised that the information presented on TradingView is provided to Vantage (‘Vantage Global Limited’, ‘we’) by a third-party provider (‘Everest Fortune Group’). Please be reminded that you are solely responsible for the trading decisions on your account. There is a very high degree of risk involved in trading. Any information and/or content is intended entirely for research, educational and informational purposes only and does not constitute investment or consultation advice or investment strategy. The information is not tailored to the investment needs of any specific person and therefore does not involve a consideration of any of the investment objectives, financial situation or needs of any viewer that may receive it. Kindly also note that past performance is not a reliable indicator of future results. Actual results may differ materially from those anticipated in forward-looking or past performance statements. We assume no liability as to the accuracy or completeness of any of the information and/or content provided herein and the Company cannot be held responsible for any omission, mistake nor for any loss or damage including without limitation to any loss of profit which may arise from reliance on any information supplied by Everest Fortune Group.

USDJPY Potential DownsidesHey Traders, in today's trading session we are monitoring USDJPY for a selling opportunity around 147.500 zone, USDJPY is trading in a downtrend and currently is in a correction phase in which it is approaching the trend at 147.500 support and resistance area.
Trade safe, Joe.

Could the price bounce from here?USD/JPY is reacting off the pivot and could bounce to the 1st resistance which acts as an overlap resistance.
Pivot: 146.90
1st Support: 144.74
1st Resistance: 149.28
Risk Warning:
Trading Forex and CFDs carries a high level of risk to your capital and you should only trade with money you can afford to lose. Trading Forex and CFDs may not be suitable for all investors, so please ensure that you fully understand the risks involved and seek independent advice if necessary.
Disclaimer:
The above opinions given constitute general market commentary, and do not constitute the opinion or advice of IC Markets or any form of personal or investment advice.
Any opinions, news, research, analyses, prices, other information, or links to third-party sites contained on this website are provided on an "as-is" basis, are intended only to be informative, is not an advice nor a recommendation, nor research, or a record of our trading prices, or an offer of, or solicitation for a transaction in any financial instrument and thus should not be treated as such. The information provided does not involve any specific investment objectives, financial situation and needs of any specific person who may receive it. Please be aware, that past performance is not a reliable indicator of future performance and/or results. Past Performance or Forward-looking scenarios based upon the reasonable beliefs of the third-party provider are not a guarantee of future performance. Actual results may differ materially from those anticipated in forward-looking or past performance statements. IC Markets makes no representation or warranty and assumes no liability as to the accuracy or completeness of the information provided, nor any loss arising from any investment based on a recommendation, forecast or any information supplied by any third-party.

Bullish rebound?USD/JPY is falling towards the support level which is a pullback support that lines up with the 61.8% Fibonacci retracement and could bounce form this level to our take profit.
Entry: 146.95
Why we like it:
There is a pullback support level.
Stop loss: 143.76
Why we like it:
There is a pullback support level that is slightly below the 138.2% Fibonacci extension.
Take profit: 150.92
Why we like it:
There is an overlap resistance level that line sup with the 50% Fibonacci retracement.
Enjoying your TradingView experience? Review us!
Please be advised that the information presented on TradingView is provided to Vantage (‘Vantage Global Limited’, ‘we’) by a third-party provider (‘Everest Fortune Group’). Please be reminded that you are solely responsible for the trading decisions on your account. There is a very high degree of risk involved in trading. Any information and/or content is intended entirely for research, educational and informational purposes only and does not constitute investment or consultation advice or investment strategy. The information is not tailored to the investment needs of any specific person and therefore does not involve a consideration of any of the investment objectives, financial situation or needs of any viewer that may receive it. Kindly also note that past performance is not a reliable indicator of future results. Actual results may differ materially from those anticipated in forward-looking or past performance statements. We assume no liability as to the accuracy or completeness of any of the information and/or content provided herein and the Company cannot be held responsible for any omission, mistake nor for any loss or damage including without limitation to any loss of profit which may arise from reliance on any information supplied by Everest Fortune Group.

Heading into 61.8% Fibonacci resistance?USD/JPY rising towards the resistance level which is an overlap resistance that lines up with the 61.8% Fibonacci retracement and could reverse from this level to our take profit.
Entry: 150.06
Why we like it:
There is an overlap resistance level that lines up with the 61.8% Fibonacci retracement.
Stop loss: 151.31
Why we like it:
There is an overlap resistance level.
Take profit: 148.17
Why we like it:
There is a pullback support level.
Enjoying your TradingView experience? Review us!
Please be advised that the information presented on TradingView is provided to Vantage (‘Vantage Global Limited’, ‘we’) by a third-party provider (‘Everest Fortune Group’). Please be reminded that you are solely responsible for the trading decisions on your account. There is a very high degree of risk involved in trading. Any information and/or content is intended entirely for research, educational and informational purposes only and does not constitute investment or consultation advice or investment strategy. The information is not tailored to the investment needs of any specific person and therefore does not involve a consideration of any of the investment objectives, financial situation or needs of any viewer that may receive it. Kindly also note that past performance is not a reliable indicator of future results. Actual results may differ materially from those anticipated in forward-looking or past performance statements. We assume no liability as to the accuracy or completeness of any of the information and/or content provided herein and the Company cannot be held responsible for any omission, mistake nor for any loss or damage including without limitation to any loss of profit which may arise from reliance on any information supplied by Everest Fortune Group.

Could the price drop from here?USD/JPY is reacting off the pivot and could drop to the 1st support which is a pullback support.
Pivot: 151.18
1st Support: 147.17
1st Resistance: 154.79
Risk Warning:
Trading Forex and CFDs carries a high level of risk to your capital and you should only trade with money you can afford to lose. Trading Forex and CFDs may not be suitable for all investors, so please ensure that you fully understand the risks involved and seek independent advice if necessary.
Disclaimer:
The above opinions given constitute general market commentary, and do not constitute the opinion or advice of IC Markets or any form of personal or investment advice.
Any opinions, news, research, analyses, prices, other information, or links to third-party sites contained on this website are provided on an "as-is" basis, are intended only to be informative, is not an advice nor a recommendation, nor research, or a record of our trading prices, or an offer of, or solicitation for a transaction in any financial instrument and thus should not be treated as such. The information provided does not involve any specific investment objectives, financial situation and needs of any specific person who may receive it. Please be aware, that past performance is not a reliable indicator of future performance and/or results. Past Performance or Forward-looking scenarios based upon the reasonable beliefs of the third-party provider are not a guarantee of future performance. Actual results may differ materially from those anticipated in forward-looking or past performance statements. IC Markets makes no representation or warranty and assumes no liability as to the accuracy or completeness of the information provided, nor any loss arising from any investment based on a recommendation, forecast or any information supplied by any third-party.

Bearish drop?USD/JPY is rising towards the resistance level which is a pullback resistance that lines up with the 71% Fibonacci retracement and could drop from this level to our take profit.
Entry: 151.26
Why we like it:
There is a pullback resistance that lines up with the 71% Fibonacci retracement.
Stop loss: 152.20
Why we like it:
There is a pullback resistance that is slightly 61.8% Fibonacci retracement.
Take profit: 150.05
Why we like it:
There is a pullback support level.
Enjoying your TradingView experience? Review us!
Please be advised that the information presented on TradingView is provided to Vantage (‘Vantage Global Limited’, ‘we’) by a third-party provider (‘Everest Fortune Group’). Please be reminded that you are solely responsible for the trading decisions on your account. There is a very high degree of risk involved in trading. Any information and/or content is intended entirely for research, educational and informational purposes only and does not constitute investment or consultation advice or investment strategy. The information is not tailored to the investment needs of any specific person and therefore does not involve a consideration of any of the investment objectives, financial situation or needs of any viewer that may receive it. Kindly also note that past performance is not a reliable indicator of future results. Actual results may differ materially from those anticipated in forward-looking or past performance statements. We assume no liability as to the accuracy or completeness of any of the information and/or content provided herein and the Company cannot be held responsible for any omission, mistake nor for any loss or damage including without limitation to any loss of profit which may arise from reliance on any information supplied by Everest Fortune Group.

USD/JPY Channel Breakout (Weekly Forecast Mar 3-7)The USD/JPY pair on the H2 timeframe presents a Potential Buying Opportunity due to a recent Formation of a Channel Breakout Pattern. This suggests a shift in momentum towards the upside and a higher likelihood of further advances in the coming hours.
Possible Long Trade:
Entry: Consider Entering A Long Position around Trendline Of The Pattern.
Target Levels:
1st Resistance – 153.90
2nd Resistance – 155.60
🎁 Please hit the like button and
🎁 Leave a comment to support for My Post !
Your likes and comments are incredibly motivating and will encourage me to share more analysis with you.
Best Regards, KABHI_TA_TRADING
Thank you.

US PCE could be the catalyst for USDJPY to make a stronger moveMARKETSCOM:USDJPY is currently flirting with the area around the 149.00 hurdle. In order to shift our attention to some lower areas, a drop below the lowest point of December 2024 is needed. But what about the US PCEs? Let's dig in...
FX_IDC:USDJPY
What are your thoughts on this?
74.2% of retail investor accounts lose money when trading CFDs with this provider. You should consider whether you understand how CFDs work and whether you can afford to take the high risk of losing your money. Past performance is not necessarily indicative of future results. The value of investments may fall as well as rise and the investor may not get back the amount initially invested. This content is not intended for nor applicable to residents of the UK. Cryptocurrency CFDs and spread bets are restricted in the UK for all retail clients.

Why USD/JPY looks ripe for a bounceWith key levels holding and bullish divergences forming, USD/JPY looks like it may want to retrace higher over the near term before its bearish trend resumes and head for the 146 - 47 area.
Matt Simpson, Market Analyst at City Index and Forex.com

USDJPY Potential DownsidesHey Traders, in today's trading session we are monitoring USDJPY for a selling opportunity around 149.800 zone, USDJPY is trading in a downtrend and currently is in a correction phase in which it is approaching the trend at 149.800 support and resistance area.
Trade safe, Joe.

Dollar weakens amid growing economic uncertainty
Persistent tariff threats from the Trump administration and rising concerns over the U.S. economy are weighing on the dollar. Trump reaffirmed his commitment to implementing tariffs on Mexico and Canada according to schedule and reiterated the need for reciprocal tariffs. Meanwhile, weak consumer confidence data further rattled investor sentiment, as the February CB Consumer Confidence Index plunged to 98.3 from 105.3, marking its lowest level since June last year.
In Japan, accelerating inflation increases the likelihood of a BoJ rate hike. According to the Ministry of Internal Affairs, Japan’s January CPI rose 3.2%, the largest increase since June 2023. Bloomberg noted that with Japan's inflation among the highest in the G7, the BoJ may continue scaling back stimulus and shifting toward a more restrictive policy stance.
After breaking below the ascending trendline, USDJPY shows a persistent downtrend. After EMA21 death-crossed EMA78, it widens the gap and reinforces the bearish momentum. If USDJPY breaks below the support at 148.20, the price could extend its decline toward 145.00. Conversely, if USDJPY tests the resistance at 150.80, it may gain upward momentum toward 153.40.

USDJPY Potential DownsidesHey Traders, in today's trading session we are monitoring USDJPY for a selling opportunity around 149.600 zone, USDJPY is trading in a downtrend and currently is in a correction phase in which it is approaching the trend at 149.600 support and resistance area.
Trade safe, Joe.

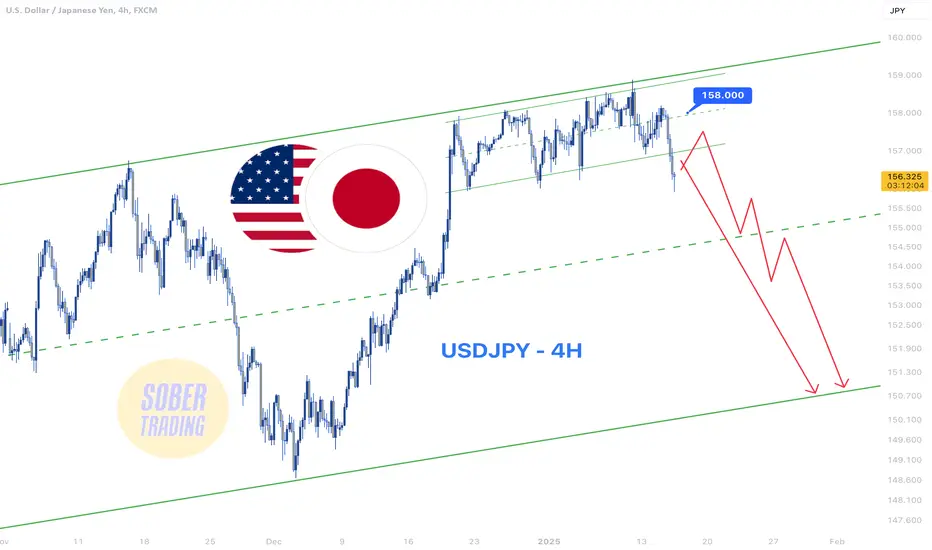
USDJPY - 4H Short Opportunities Amid DowntrendFollowing the sharp fall in FX:USDJPY after PPI and CPI news, we expect further downside, potentially reaching the middle or bottom of the channel. 📉
Each push-up could be a short entry opportunity. Even a strong rise below 158 might be a dead cat bounce and a better short entry point. Stay cautious and strategic! 🔻
USDJPY: Bullish signal on the 0.5 Fib.USDJPY is almost oversold on its 1D technical outlook (RSI = 32.042, MACD = -1.350, ADX = 47.008), pulling back on a technical retrace inside the long term Channel Up. This bullish wave correction is identical to the 0.5 Fibonacci pullback of December 29th 2023 that also traded on similar RSI levels. We expect the price to start recovering now and aim at the 1.382 Fibonacci. Go long, TP = 166.300.
## If you like our free content follow our profile to get more daily ideas. ##
## Comments and likes are greatly appreciated. ##
