EUR/USD Retracement Into Demand ZoneHello guys!
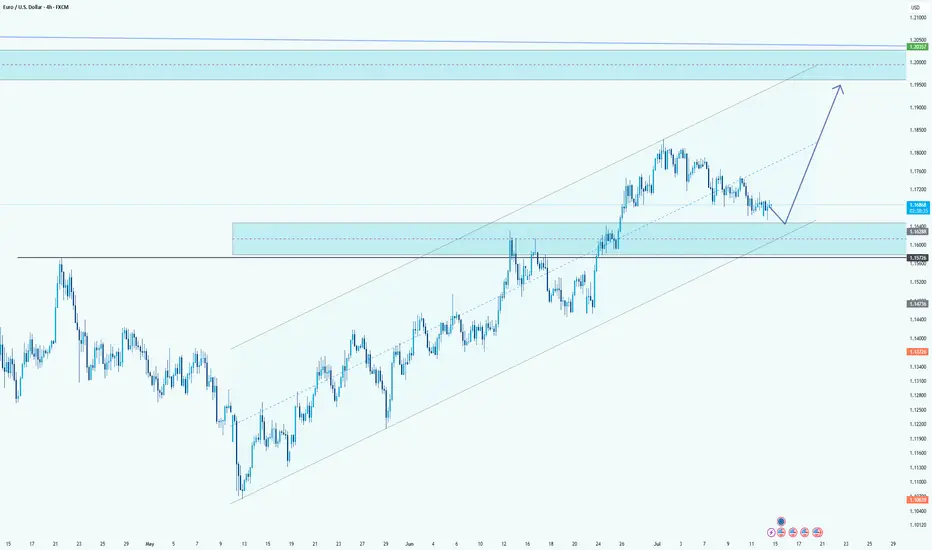
EUR/USD is currently undergoing a healthy retracement after an extended bullish trend within the ascending channel. The price is now approaching a key demand zone, which aligns perfectly with the mid-line of the channel structure.
This zone previously acted as a strong resistance area and is now expected to serve as support, confirming a classic flip in market structure. The reaction around the 1.16288 - 1.15774 area will be crucial.
If buyers step in here, the bullish momentum is likely to resume with the next major target being the upper resistance zone near 1.20000 , as projected by the upward arrow. The overall structure remains bullish as long as the price holds above the channel support and doesn't close below the last demand zone.
USD (US Dollar)
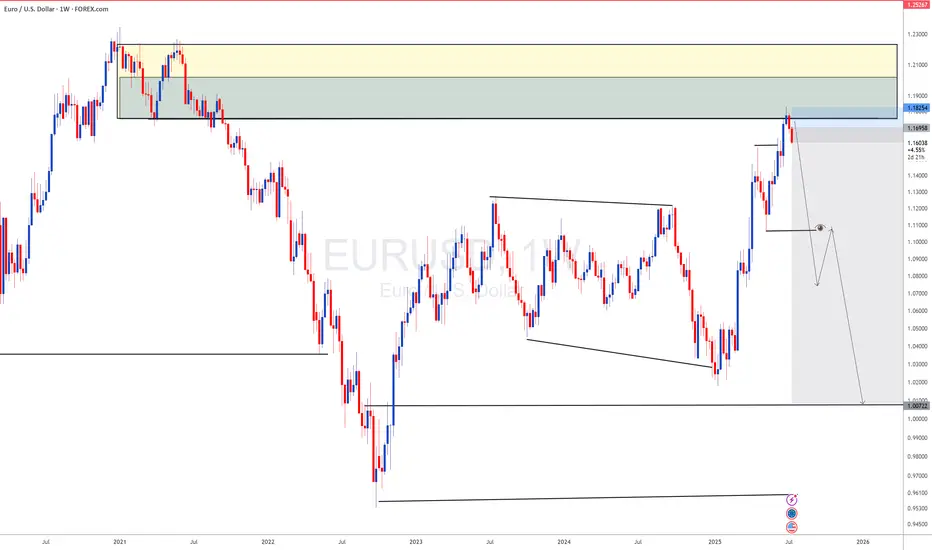
EURUSD as DXY s gaining momentum DXY has completed its long term downside now lets look for sell on EURUSD
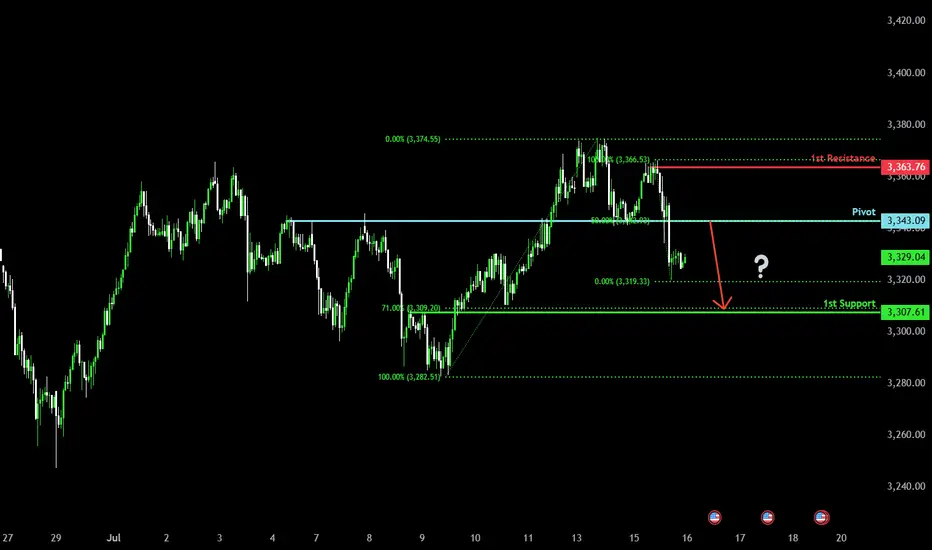
Major resistance ahead?The Gold (XAU/USD) is rising towards the pivot and could reverse to the overlap support.
Pivot: 3,343.09
1st Support: 3,307.61
1st Resistance: 3,363.76
Risk Warning:
Trading Forex and CFDs carries a high level of risk to your capital and you should only trade with money you can afford to lose. Trading Forex and CFDs may not be suitable for all investors, so please ensure that you fully understand the risks involved and seek independent advice if necessary.
Disclaimer:
The above opinions given constitute general market commentary, and do not constitute the opinion or advice of IC Markets or any form of personal or investment advice.
Any opinions, news, research, analyses, prices, other information, or links to third-party sites contained on this website are provided on an "as-is" basis, are intended only to be informative, is not an advice nor a recommendation, nor research, or a record of our trading prices, or an offer of, or solicitation for a transaction in any financial instrument and thus should not be treated as such. The information provided does not involve any specific investment objectives, financial situation and needs of any specific person who may receive it. Please be aware, that past performance is not a reliable indicator of future performance and/or results. Past Performance or Forward-looking scenarios based upon the reasonable beliefs of the third-party provider are not a guarantee of future performance. Actual results may differ materially from those anticipated in forward-looking or past performance statements. IC Markets makes no representation or warranty and assumes no liability as to the accuracy or completeness of the information provided, nor any loss arising from any investment based on a recommendation, forecast or any information supplied by any third-party.
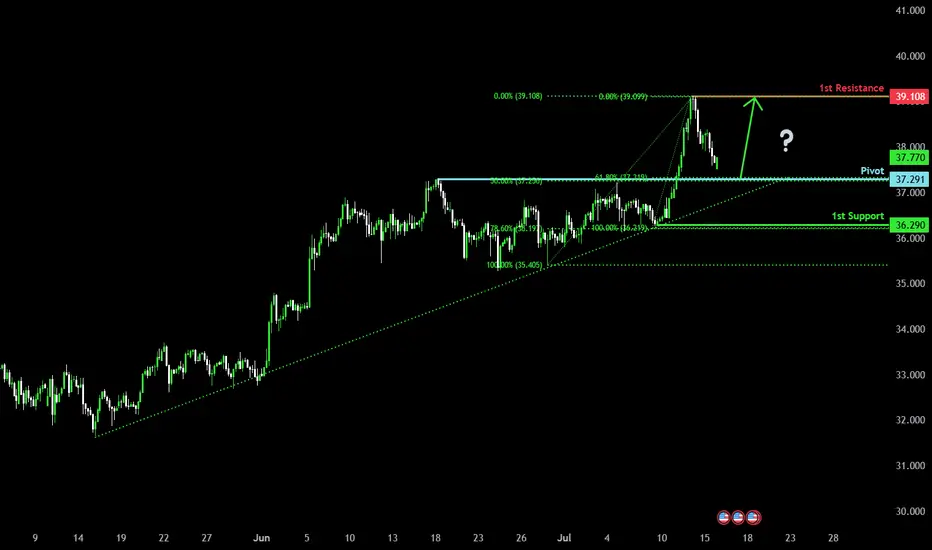
Falling towards the pullback support?The Silver (XAG/USD) is falling towards the pivot which acts as a pullback support and could bounce to the 1st resistance which is a pullback resistance.
Pivot: 37.29
1st Support: 36.29
1st Resistance: 39.10
Risk Warning:
Trading Forex and CFDs carries a high level of risk to your capital and you should only trade with money you can afford to lose. Trading Forex and CFDs may not be suitable for all investors, so please ensure that you fully understand the risks involved and seek independent advice if necessary.
Disclaimer:
The above opinions given constitute general market commentary, and do not constitute the opinion or advice of IC Markets or any form of personal or investment advice.
Any opinions, news, research, analyses, prices, other information, or links to third-party sites contained on this website are provided on an "as-is" basis, are intended only to be informative, is not an advice nor a recommendation, nor research, or a record of our trading prices, or an offer of, or solicitation for a transaction in any financial instrument and thus should not be treated as such. The information provided does not involve any specific investment objectives, financial situation and needs of any specific person who may receive it. Please be aware, that past performance is not a reliable indicator of future performance and/or results. Past Performance or Forward-looking scenarios based upon the reasonable beliefs of the third-party provider are not a guarantee of future performance. Actual results may differ materially from those anticipated in forward-looking or past performance statements. IC Markets makes no representation or warranty and assumes no liability as to the accuracy or completeness of the information provided, nor any loss arising from any investment based on a recommendation, forecast or any information supplied by any third-party.
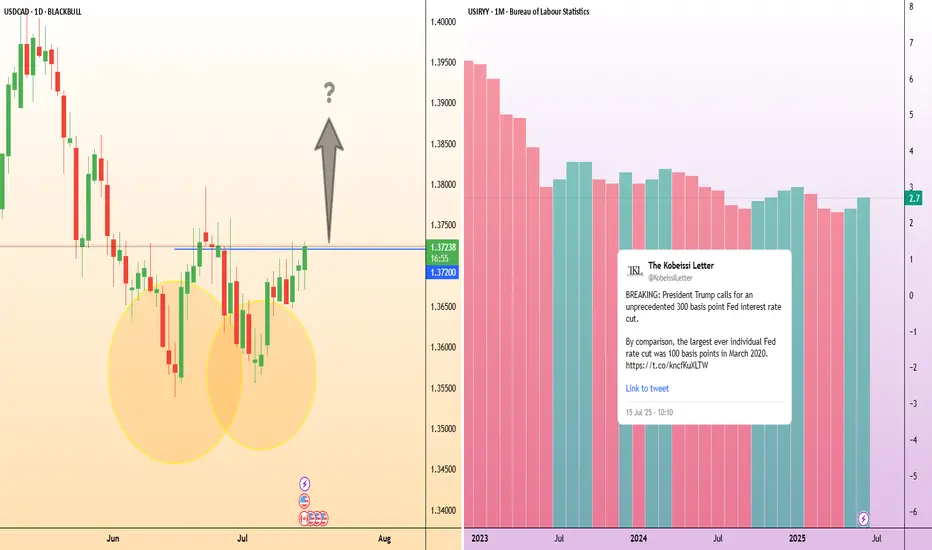
USD/CAD: Inflation gaps create opportunityIn the U.S., inflation accelerated for a second straight month, with headline CPI reaching 2.7% year-on-year in June as President Trump’s tariffs begin to push up the cost of a range of goods.
Increasing inflation could likely heighten the Federal Reserve’s reluctance to cut its interest rate, in defiance of Trump’s public demand. This could provide upward momentum for USD/CAD if expectations for rate cuts are delayed.
USD/CAD is showing signs of a potential trend reversal after finding strong support around 1.3600 in late June. Price action has since formed a series of higher lows, and the recent breakout attempt above 1.3720 suggests bullish momentum could be building.
Canada’s inflation rate, released at the same time as the US’s, edged up to 1.9%, staying below the Bank of Canada’s 2% target for a third consecutive month. With the BoC already signalling easing bias, this divergence in inflation paths may limit CAD strength.
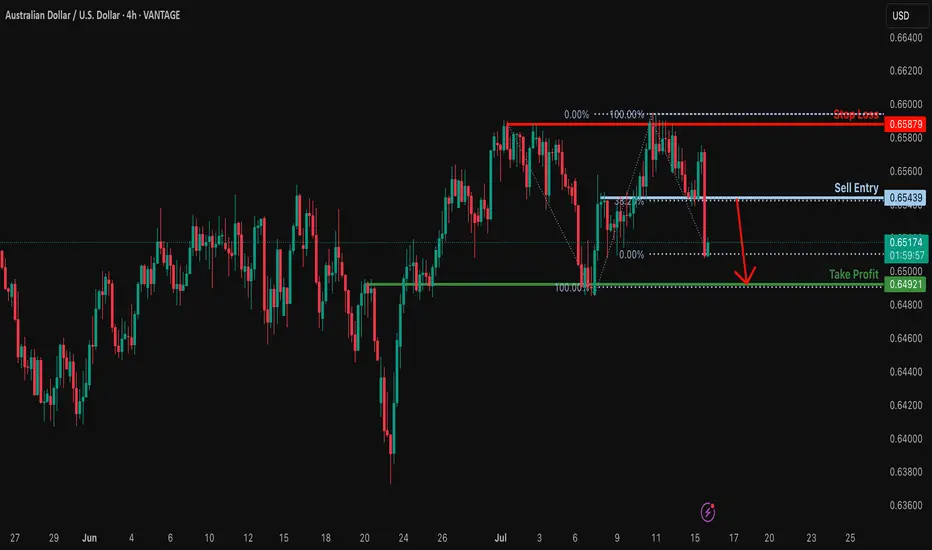
Heading into 38.2% Fibonacci resistance?AUD/USD is rising towards the resistance level which is an overlap. resistance that aligns with the 38.2% Fibonacci retracement and. could drop from this level to our take profit.
Entry: 0.6543
Why we like it:
There is n overlap resistance that aligns with the 38.2% Fibonacci retracement.
Stop loss: 0.6587
Why we like it:
There is. pullback resistance.
Take profit: 0.6492
Why we like it:
There is an overlap support level that lines up with the 100% Fibonacci projection.
Enjoying your TradingView experience? Review us!
Please be advised that the information presented on TradingView is provided to Vantage (‘Vantage Global Limited’, ‘we’) by a third-party provider (‘Everest Fortune Group’). Please be reminded that you are solely responsible for the trading decisions on your account. There is a very high degree of risk involved in trading. Any information and/or content is intended entirely for research, educational and informational purposes only and does not constitute investment or consultation advice or investment strategy. The information is not tailored to the investment needs of any specific person and therefore does not involve a consideration of any of the investment objectives, financial situation or needs of any viewer that may receive it. Kindly also note that past performance is not a reliable indicator of future results. Actual results may differ materially from those anticipated in forward-looking or past performance statements. We assume no liability as to the accuracy or completeness of any of the information and/or content provided herein and the Company cannot be held responsible for any omission, mistake nor for any loss or damage including without limitation to any loss of profit which may arise from reliance on any information supplied by Everest Fortune Group.
Bearish reversal?USD/JPY is reacting off the resistance level which is a pullback resistance that lines up with the 78.6% Fibonacci projection and slightly below the 127.2% Fibonacci extension.
Entry: 148.99
Why we like it:
There is a pullback resistance that lines up with the 78.6% Fibonacci projection and also slightly below the 127.2% Fibonacci extension.
Stop loss: 151.20
Why we like it:
There is an overlap resistance that aligns with the 161.8% Fibonacci extension.
Take profit: 147.08
Why we like it:
There is an overlap support level.
Enjoying your TradingView experience? Review us!
Please be advised that the information presented on TradingView is provided to Vantage (‘Vantage Global Limited’, ‘we’) by a third-party provider (‘Everest Fortune Group’). Please be reminded that you are solely responsible for the trading decisions on your account. There is a very high degree of risk involved in trading. Any information and/or content is intended entirely for research, educational and informational purposes only and does not constitute investment or consultation advice or investment strategy. The information is not tailored to the investment needs of any specific person and therefore does not involve a consideration of any of the investment objectives, financial situation or needs of any viewer that may receive it. Kindly also note that past performance is not a reliable indicator of future results. Actual results may differ materially from those anticipated in forward-looking or past performance statements. We assume no liability as to the accuracy or completeness of any of the information and/or content provided herein and the Company cannot be held responsible for any omission, mistake nor for any loss or damage including without limitation to any loss of profit which may arise from reliance on any information supplied by Everest Fortune Group.

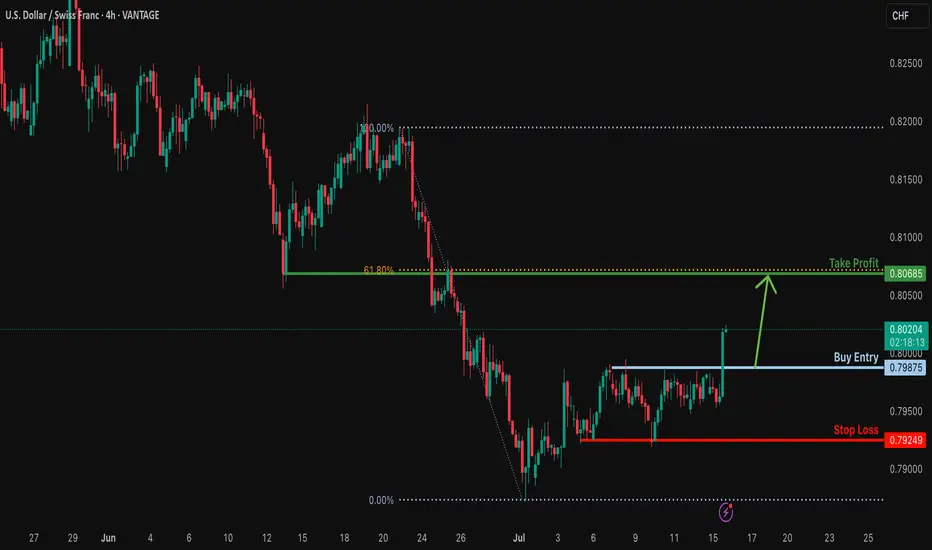
Bullish bounce?USD/CHF is falling towards the support level which is a pullback support and could bounce from this level to our take profit.
Entry: 0.7987
Why we like it:
There is a pullback support.
Stop loss: 0.7924
Why we like it:
There is a pullback support.
Take profit: 0.8068
Why we like it:
There is an overlap resistance that aligns with the 61.8% Fibonacci retracement.
Enjoying your TradingView experience? Review us!
Please be advised that the information presented on TradingView is provided to Vantage (‘Vantage Global Limited’, ‘we’) by a third-party provider (‘Everest Fortune Group’). Please be reminded that you are solely responsible for the trading decisions on your account. There is a very high degree of risk involved in trading. Any information and/or content is intended entirely for research, educational and informational purposes only and does not constitute investment or consultation advice or investment strategy. The information is not tailored to the investment needs of any specific person and therefore does not involve a consideration of any of the investment objectives, financial situation or needs of any viewer that may receive it. Kindly also note that past performance is not a reliable indicator of future results. Actual results may differ materially from those anticipated in forward-looking or past performance statements. We assume no liability as to the accuracy or completeness of any of the information and/or content provided herein and the Company cannot be held responsible for any omission, mistake nor for any loss or damage including without limitation to any loss of profit which may arise from reliance on any information supplied by Everest Fortune Group.
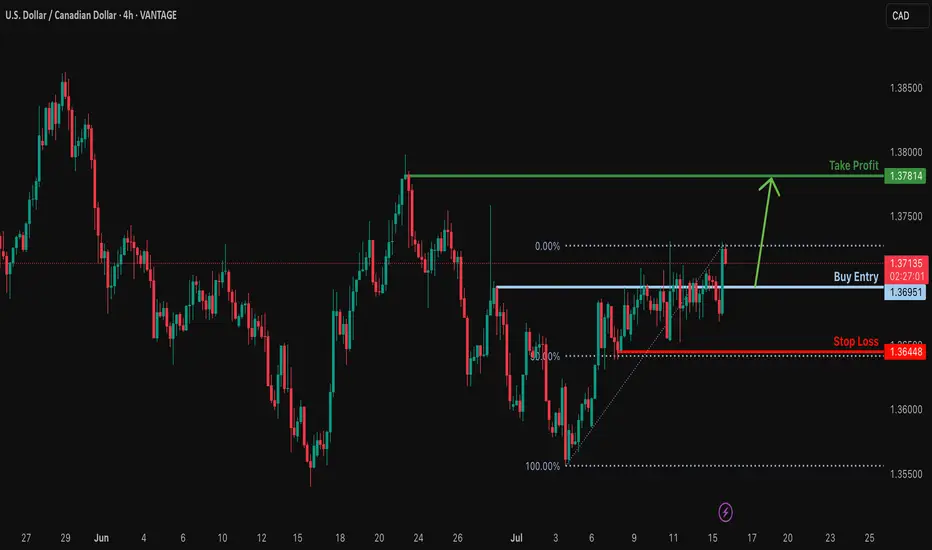
Bullish bounce off pullback support?USD/CAD is falling towards the support level which is a pullback support and could bounce from this level to our take profit.
Entry: 1.3695
Why we like it:
There is a pullback support.
Stop loss: 1.3644
Why we like it:
There is a pullback support that aligns with the 50% Fibonacci retracement.
Take profit: 1.3781
Why we lik eit:
There is a pullback resistance.
Enjoying your TradingView experience? Review us!
Please be advised that the information presented on TradingView is provided to Vantage (‘Vantage Global Limited’, ‘we’) by a third-party provider (‘Everest Fortune Group’). Please be reminded that you are solely responsible for the trading decisions on your account. There is a very high degree of risk involved in trading. Any information and/or content is intended entirely for research, educational and informational purposes only and does not constitute investment or consultation advice or investment strategy. The information is not tailored to the investment needs of any specific person and therefore does not involve a consideration of any of the investment objectives, financial situation or needs of any viewer that may receive it. Kindly also note that past performance is not a reliable indicator of future results. Actual results may differ materially from those anticipated in forward-looking or past performance statements. We assume no liability as to the accuracy or completeness of any of the information and/or content provided herein and the Company cannot be held responsible for any omission, mistake nor for any loss or damage including without limitation to any loss of profit which may arise from reliance on any information supplied by Everest Fortune Group.
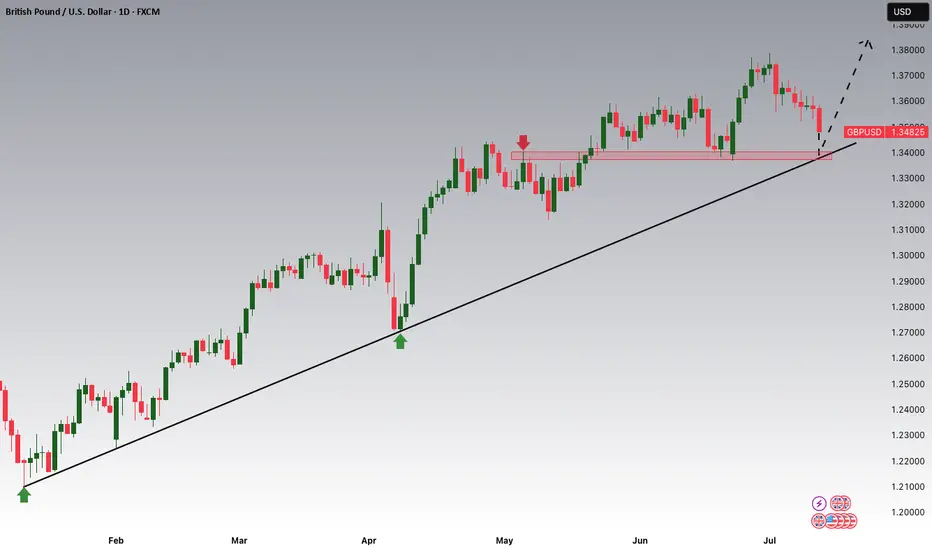
GBPUSD is Nearing the Daily Trend!!!Hey Traders, in tomorrow's trading session we are monitoring GBPUSD for a buying opportunity around 1.34100 zone, GBPUSD is trading in an uptrend and currently is in a correction phase in which it is approaching the trend at 1.34100 support and resistance area.
Trade safe, Joe.
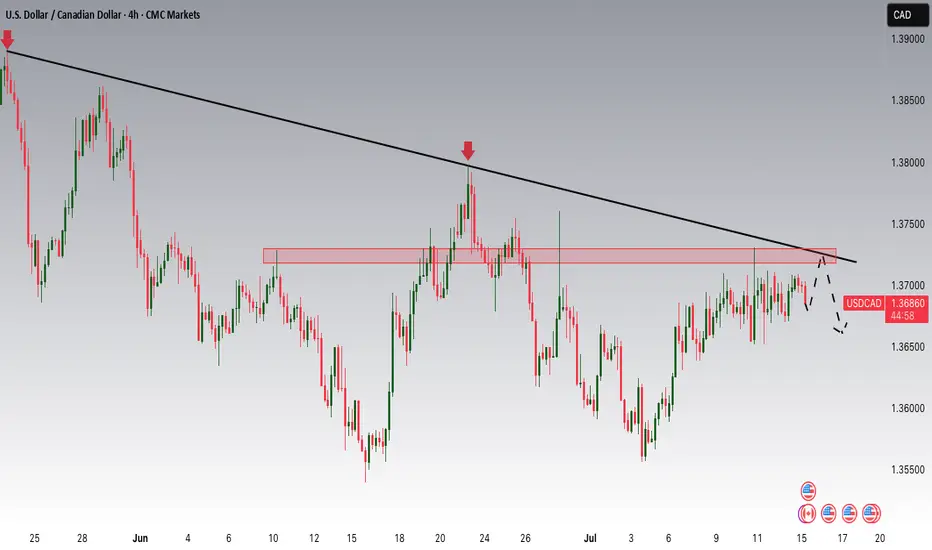
USDCAD Potential DownsidesHey Traders, in today's trading session we are monitoring USDCAD for a selling opportunity around 1.37200 zone, USDCAD is trading in a downtrend and currently is in a correction phase in which it is approaching the trend at 1.37200 support and resistance area.
Trade safe, Joe.
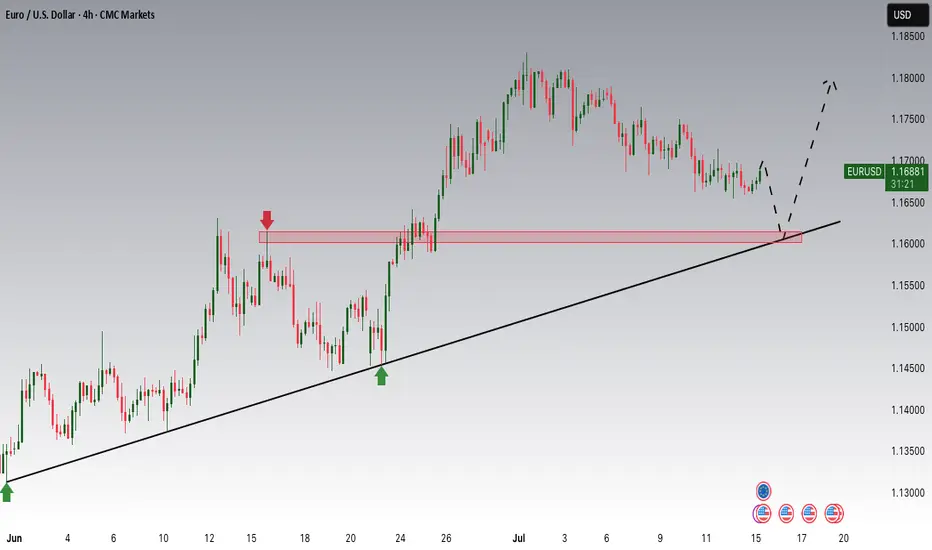
EURUSD: Consolidation Phase Nearing the Main Trend!!Hey Traders, in today's trading session we are monitoring EURUSD for a buying opportunity around 1.16100 zone, EURUSD is trading in an uptrend and currently is in a correction phase in which it is approaching the trend at 1.16100 support and resistance area.
Trade safe, Joe.
GOLD - SHORT TO $2,800 (1H UPDATE)Yesterday's entry hit SL, as price pushed up a little higher for liquidity, ahead of today's CPI data.
I have entered another sell entry today at $3,353. Couldn't send analysis straight away as I was out & didn't have my laptop on me. But re-trying this analysis one last time. If SL is hit, we will wait for $3,400 entry.

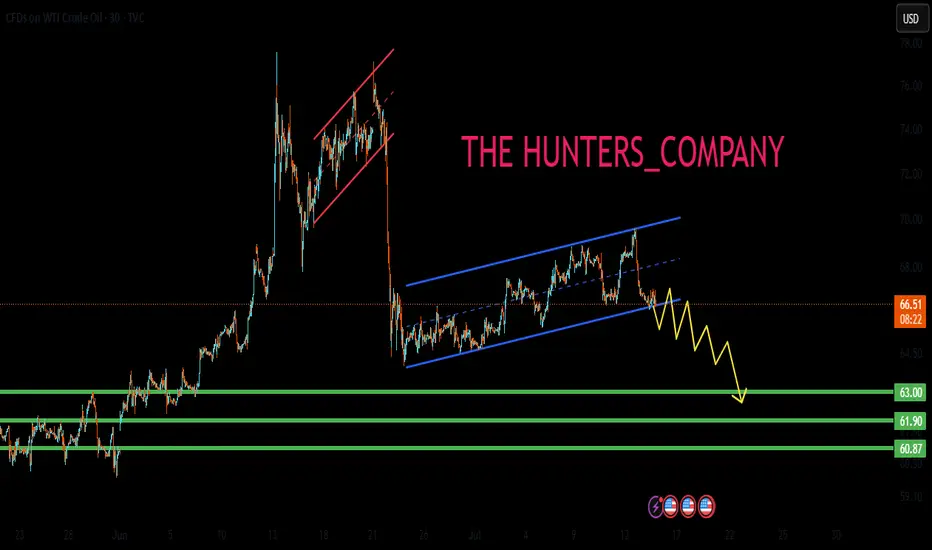
US OIL SELL...Hello friends🙌
🔊As you can see, this chart works well in forming a channel, and now that
we have witnessed a price drop, the price has reached the bottom of the channel, and given the previous heavy drop, the channel shows that the power is currently in the hands of sellers and it is likely that the specified targets will move.
🔥Follow us for more signals🔥
Trade safely with us
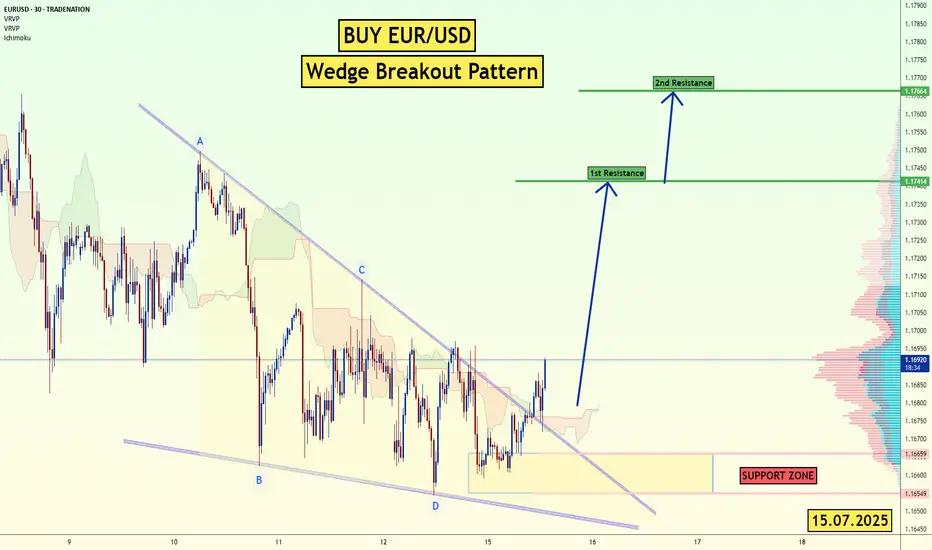
EUR/USD - Wedge Breakout (CPI- Today) 15.07.2025 The EUR/USD pair on the M30 timeframe presents a Potential Buying Opportunity due to a recent Formation of a Wedge Breakout Pattern. This suggests a shift in momentum towards the upside and a higher likelihood of further advances in the coming hours.
Possible Long Trade:
Entry: Consider Entering A Long Position around Trendline Of The Pattern.
Target Levels:
1st Resistance – 1.1741
2nd Resistance – 1.1766
🎁 Please hit the like button and
🎁 Leave a comment to support for My Post !
Your likes and comments are incredibly motivating and will encourage me to share more analysis with you.
Best Regards, KABHI_TA_TRADING
Thank you.
Disclosure: I am part of Trade Nation's Influencer program and receive a monthly fee for using their TradingView charts in my analysis.
Dollar Index Bullish OverviewThe Dollar moving Bullish as we expect it to within the Gold Fund! As soon as we saw a '5 Bearish Wave Completion' on the DXY, straight away buyers entered the market & start pushing price back up.
My Gold Fund investors & Gold Vault Academy students know from our 'Q3 Market Breakdown Report' what we're expecting for the Dollar in the next 3 months.

#010: USD/SEK SHORT Investment Opportunity
At the opening of the 8-hour candle, the price touched the 200-mark moving average with surgical precision on volume compression, signaling the exhaustion of the bullish movement underway since the end of June.
🔍 What strengthened the short position:
The price hit a key area defended by institutions, confirmed by increased open interest and compression in FX options between 9.68 and 9.69.
Retail investors are over 76% long, completely exposed to the wrong side.
Our entry was calculated after the false breakout, and we are positioned exactly below the zone where large traders have already loaded their short positions.
The trade is protected by future passive orders placed below 9.5000, where banks will defend their positions. Our stop is therefore outside the path of stop hunters.
📌 Short-term macro context:
Although the dollar remains strong, USD/SEK has reached a technical and statistical level that historically marks the beginning of short-term corrections, ideal for tactical trading.

LONG ON GBP/USDGU is currently in its pullback phase of its uptrend.
We have a nice sell side Liquidity sweep being completed at this moment.
Price should now tap into previous demand that broke a high to repeat history and rise again.
Very Nice Setup over 300 pips on the table to the previous high/supply zone.

USDJPY - Trade The Range!Hello TradingView Family / Fellow Traders. This is Richard, also known as theSignalyst.
📈USDJPY has been trading within a range between $140 and $150 round numbers and it is currently retesting the upper bound of the range.
📚 As per my trading style:
As #USDJPY is around the red circle zone, I will be looking for bearish reversal setups (like a double top pattern, trendline break , and so on...)
📚 Always follow your trading plan regarding entry, risk management, and trade management.
Good luck!
All Strategies Are Good; If Managed Properly!
~Rich
Disclosure: I am part of Trade Nation's Influencer program and receive a monthly fee for using their TradingView charts in my analysis.

USDCAD LONG DAILY FORECAST Q3 D15 W29 Y25USDCAD LONG DAILY FORECAST Q3 D15 W29 Y25
Professional Risk Managers👋
Welcome back to another FRGNT chart update📈
Diving into some Forex setups using predominantly higher time frame order blocks alongside confirmation breaks of structure.
Let’s see what price action is telling us today! 👀
💡Here are some trade confluences📝
✅Daily Order block identified
✅4H Order Block identified
✅1H Order Block identified
🔑 Remember, to participate in trading comes always with a degree of risk, therefore as professional risk managers it remains vital that we stick to our risk management plan as well as our trading strategies.
📈The rest, we leave to the balance of probabilities.
💡Fail to plan. Plan to fail.
🏆It has always been that simple.
❤️Good luck with your trading journey, I shall see you at the very top.
🎯Trade consistent, FRGNT X

The Gold Retrace for Ultimate Entry!looking for price to continue with its pullback to find where exactly support is. Once we see price establish support we should get some type of signal for entry and price can continue with this bullish price action to make new highs. If we get a full 71.8% pullback that should make for a nice bull run. Just need to wait for the confirmations first before reacting cause we might get a lot of chop until then.

Bullish continuation off pullback support?The Silver (XAG/USD) is falling towards the support which is a pullback support that aligns with the 50% Fibonacci retracement and could bounce from this level too ur take profit.
Entry: 37.24
Why we like it:
There is a pullback support that aligns with the 50% Fibonacci retracement.
Stop loss: 36.49
Why we like it:
There is an overlap support that lines up with the 71% Fibonacci retracement.
Take profit: 39.12
Why we like it:
There is a swing high resistance.
Enjoying your TradingView experience? Review us!
Please be advised that the information presented on TradingView is provided to Vantage (‘Vantage Global Limited’, ‘we’) by a third-party provider (‘Everest Fortune Group’). Please be reminded that you are solely responsible for the trading decisions on your account. There is a very high degree of risk involved in trading. Any information and/or content is intended entirely for research, educational and informational purposes only and does not constitute investment or consultation advice or investment strategy. The information is not tailored to the investment needs of any specific person and therefore does not involve a consideration of any of the investment objectives, financial situation or needs of any viewer that may receive it. Kindly also note that past performance is not a reliable indicator of future results. Actual results may differ materially from those anticipated in forward-looking or past performance statements. We assume no liability as to the accuracy or completeness of any of the information and/or content provided herein and the Company cannot be held responsible for any omission, mistake nor for any loss or damage including without limitation to any loss of profit which may arise from reliance on any information supplied by Everest Fortune Group.

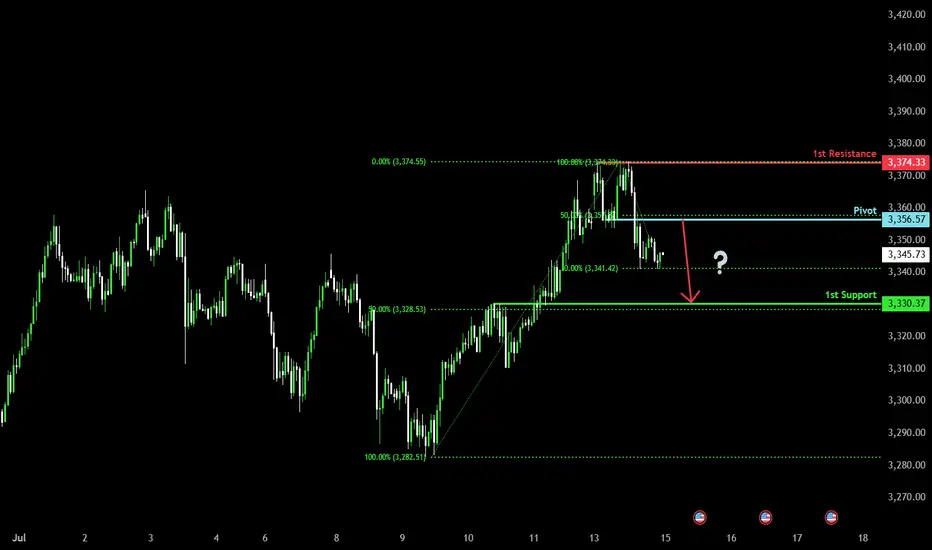
Beaish drop?The Gold (XAU/USD) is rising towards the pivot which aligns with the 50% Fibonacci retracement and could reverse to the 1st support.
Pivot: 3,356.57
1st Support: 3,330.37
1st Resistance: 3,374.33
Risk Warning:
Trading Forex and CFDs carries a high level of risk to your capital and you should only trade with money you can afford to lose. Trading Forex and CFDs may not be suitable for all investors, so please ensure that you fully understand the risks involved and seek independent advice if necessary.
Disclaimer:
The above opinions given constitute general market commentary, and do not constitute the opinion or advice of IC Markets or any form of personal or investment advice.
Any opinions, news, research, analyses, prices, other information, or links to third-party sites contained on this website are provided on an "as-is" basis, are intended only to be informative, is not an advice nor a recommendation, nor research, or a record of our trading prices, or an offer of, or solicitation for a transaction in any financial instrument and thus should not be treated as such. The information provided does not involve any specific investment objectives, financial situation and needs of any specific person who may receive it. Please be aware, that past performance is not a reliable indicator of future performance and/or results. Past Performance or Forward-looking scenarios based upon the reasonable beliefs of the third-party provider are not a guarantee of future performance. Actual results may differ materially from those anticipated in forward-looking or past performance statements. IC Markets makes no representation or warranty and assumes no liability as to the accuracy or completeness of the information provided, nor any loss arising from any investment based on a recommendation, forecast or any information supplied by any third-party.