Falling towards 61.8% Fibonacci support?NZD/USD is falling towards the support level which is an overlap support that lines up with the 61.8% Fibonacci retracement and could bounce from this level to our take profit.
Entry: 0.5887
Why we like it:
There is an overlap support level that lines up with the 61.8% Fibonacci retracement,.
Stop loss: 0.5863
Why we like it:
There is a pullback support level.
Take profit: 0.5932
Why we like it:
There is a pullback resistance level.
Enjoying your TradingView experience? Review us!
Please be advised that the information presented on TradingView is provided to Vantage (‘Vantage Global Limited’, ‘we’) by a third-party provider (‘Everest Fortune Group’). Please be reminded that you are solely responsible for the trading decisions on your account. There is a very high degree of risk involved in trading. Any information and/or content is intended entirely for research, educational and informational purposes only and does not constitute investment or consultation advice or investment strategy. The information is not tailored to the investment needs of any specific person and therefore does not involve a consideration of any of the investment objectives, financial situation or needs of any viewer that may receive it. Kindly also note that past performance is not a reliable indicator of future results. Actual results may differ materially from those anticipated in forward-looking or past performance statements. We assume no liability as to the accuracy or completeness of any of the information and/or content provided herein and the Company cannot be held responsible for any omission, mistake nor for any loss or damage including without limitation to any loss of profit which may arise from reliance on any information supplied by Everest Fortune Group.
USD (US Dollar)

Potential bullish bounce?USD/JPY has bounced off the support level which is a pullback support that is slightly above the 50% Fibonacci retracement and could rise from this level to our take profit.
Entry: 145.89
Why we like it:
There is a pullback support level which is a pullback support that is slightly above the 50% Fibonacci retracement.
Stop loss: 144.44
Why we like it:
There is a pullback support level that is slightly below the 61.8% Fibonacci retracement.
Take profit: 148.70
Why we like it:
There is a pullback resistance level.
Enjoying your TradingView experience? Review us!
Please be advised that the information presented on TradingView is provided to Vantage (‘Vantage Global Limited’, ‘we’) by a third-party provider (‘Everest Fortune Group’). Please be reminded that you are solely responsible for the trading decisions on your account. There is a very high degree of risk involved in trading. Any information and/or content is intended entirely for research, educational and informational purposes only and does not constitute investment or consultation advice or investment strategy. The information is not tailored to the investment needs of any specific person and therefore does not involve a consideration of any of the investment objectives, financial situation or needs of any viewer that may receive it. Kindly also note that past performance is not a reliable indicator of future results. Actual results may differ materially from those anticipated in forward-looking or past performance statements. We assume no liability as to the accuracy or completeness of any of the information and/or content provided herein and the Company cannot be held responsible for any omission, mistake nor for any loss or damage including without limitation to any loss of profit which may arise from reliance on any information supplied by Everest Fortune Group.

Could the Cable bounce from here?GBP/USD is falling towards the support level which is a pullback support that lines up with the 61.8% Fibonacci retracement and could bounce from this level to our take profit.
Entry: 1.3210
Why we like it:
There is a pullback support that lines up with the 61.8% Fibonacci retracement.
Stop loss: 1.3144
Why we like it:
There is a pullback support level that lines up with the 78.6% Fibonacci projection.
Take profit: 1.3345
Why we like it:
There is a pullback resistance level.
Enjoying your TradingView experience? Review us!
Please be advised that the information presented on TradingView is provided to Vantage (‘Vantage Global Limited’, ‘we’) by a third-party provider (‘Everest Fortune Group’). Please be reminded that you are solely responsible for the trading decisions on your account. There is a very high degree of risk involved in trading. Any information and/or content is intended entirely for research, educational and informational purposes only and does not constitute investment or consultation advice or investment strategy. The information is not tailored to the investment needs of any specific person and therefore does not involve a consideration of any of the investment objectives, financial situation or needs of any viewer that may receive it. Kindly also note that past performance is not a reliable indicator of future results. Actual results may differ materially from those anticipated in forward-looking or past performance statements. We assume no liability as to the accuracy or completeness of any of the information and/or content provided herein and the Company cannot be held responsible for any omission, mistake nor for any loss or damage including without limitation to any loss of profit which may arise from reliance on any information supplied by Everest Fortune Group.

Bearish drop?EUR/USD has rejected off the resistance level which is an overlap resistance and could drop from this level to our take profit.
Entry: 1.1274
Why we like it:
There is an overlap resistance level which is an overlap resistance that lines up with the 61.8% Fibonacci retracement.
Stop loss: 1.1373
Why we like it:
There is a pullback resistance level.
Take profit: 1.1084
Why we like it:
There is an overlap support level.
Enjoying your TradingView experience? Review us!
Please be advised that the information presented on TradingView is provided to Vantage (‘Vantage Global Limited’, ‘we’) by a third-party provider (‘Everest Fortune Group’). Please be reminded that you are solely responsible for the trading decisions on your account. There is a very high degree of risk involved in trading. Any information and/or content is intended entirely for research, educational and informational purposes only and does not constitute investment or consultation advice or investment strategy. The information is not tailored to the investment needs of any specific person and therefore does not involve a consideration of any of the investment objectives, financial situation or needs of any viewer that may receive it. Kindly also note that past performance is not a reliable indicator of future results. Actual results may differ materially from those anticipated in forward-looking or past performance statements. We assume no liability as to the accuracy or completeness of any of the information and/or content provided herein and the Company cannot be held responsible for any omission, mistake nor for any loss or damage including without limitation to any loss of profit which may arise from reliance on any information supplied by Everest Fortune Group.

AUDUSD Still on the Bullish Leg of its 3-year Channel Down.The AUDUSD pair has been trading within a Channel Down since the August 08 2022 High and is currently testing the 1W MA50 (blue trend-line) as a Resistance. This is a big Resistance cluster as it also made contact with the Pivot trend-line from the pattern's first Low.
However, all Lower Highs of the Channel Down have been priced above its 1W MA50, with three Tops forming on the 1W MA200 (orange trend-line). As a result, we expect a few more months of uptrend on this Bullish Leg until it approaches the 1W MA200. Our Target is 0.67000.
-------------------------------------------------------------------------------
** Please LIKE 👍, FOLLOW ✅, SHARE 🙌 and COMMENT ✍ if you enjoy this idea! Also share your ideas and charts in the comments section below! This is best way to keep it relevant, support us, keep the content here free and allow the idea to reach as many people as possible. **
-------------------------------------------------------------------------------
💸💸💸💸💸💸
👇 👇 👇 👇 👇 👇

USD/TWDLarge selloff driven by price action in a macro rising wedge
- Look for support hold
- Island bottom or bounce with a wick less than half the body candle
- Could see highs again by 2026/2027
- Could be a concern over Chinese invasion
- China says not ready until 2027 to do so

XAU/USD - Trendline Breakout (14.05.2025)The XAU/USD pair on the M30 timeframe presents a Potential Buying Opportunity due to a recent Formation of a Breakout Pattern. This suggests a shift in momentum towards the upside and a higher likelihood of further advances in the coming hours.
Possible Long Trade:
Entry: Consider Entering A Long Position around Trendline Of The Pattern.
Target Levels:
1st Resistance – 3321
2nd Resistance – 3364
🎁 Please hit the like button and
🎁 Leave a comment to support for My Post !
Your likes and comments are incredibly motivating and will encourage me to share more analysis with you.
Best Regards, KABHI_TA_TRADING
Thank you.

DXY Sell this rally. Bearish until end-of-year.The U.S. Dollar index (DXY) has been trading within a Channel Down since the September 26 2022 High and is currently on a medium-term Bearish Leg. The last 3 weeks however have been a short-term rebound (all 1W candles green), but the price is still below both the 1W MA200 (orang trend-line) and the 1W MA50 (blue trend-line).
This doesn't alter the bearish trend as this is not the first time we've seen this price action. More specifically, DXY also made a short-term rebound during the first Bearish Leg of the pattern and rebounded on January 30 2023 back to the 1W MA50. This delivered a strong rejection which eventually completed the Bearish Leg with one last round of selling to complete a -13.30% Bearish Leg in total.
Before that, we also saw the same pattern (also on 1W RSI terms) in 2020, when on August 31 2020 the price again had a short-term rebound only to resume the bearish trend and finish the sequence again at -13.40% from the top.
As a result, as long as the price remains (closes) below the 1W MA50, the last sell signal is given when the 1W RSI breaks above its MA (yellow trend-line) and then we can expect the Bearish Leg to complete a -13.30% decline with a 96.000 Target.
-------------------------------------------------------------------------------
** Please LIKE 👍, FOLLOW ✅, SHARE 🙌 and COMMENT ✍ if you enjoy this idea! Also share your ideas and charts in the comments section below! This is best way to keep it relevant, support us, keep the content here free and allow the idea to reach as many people as possible. **
-------------------------------------------------------------------------------
💸💸💸💸💸💸
👇 👇 👇 👇 👇 👇

TA on BCHUSD - 2025.05.14This is a quick technical analysis piece on Bitcoin Cash ( MARKETSCOM:BCHUSD ).
Let's dig in!
CRYPTO:BCHUSD
Let us know what you think in the comments below.
Thank you.
77.3% of retail investor accounts lose money when trading CFDs with this provider. You should consider whether you understand how CFDs work and whether you can afford to take the high risk of losing your money. Past performance is not necessarily indicative of future results. The value of investments may fall as well as rise and the investor may not get back the amount initially invested. This content is not intended for nor applicable to residents of the UK. Cryptocurrency CFDs and spread bets are restricted in the UK for all retail clients.

Bearish drop?The Gold (XAU/USD) has rejected off the pivot and could drop to the 1st support.
Pivot: 3,263.17
1st Support: 3,156.30
1st Resistance: 3,287.49
Risk Warning:
Trading Forex and CFDs carries a high level of risk to your capital and you should only trade with money you can afford to lose. Trading Forex and CFDs may not be suitable for all investors, so please ensure that you fully understand the risks involved and seek independent advice if necessary.
Disclaimer:
The above opinions given constitute general market commentary, and do not constitute the opinion or advice of IC Markets or any form of personal or investment advice.
Any opinions, news, research, analyses, prices, other information, or links to third-party sites contained on this website are provided on an "as-is" basis, are intended only to be informative, is not an advice nor a recommendation, nor research, or a record of our trading prices, or an offer of, or solicitation for a transaction in any financial instrument and thus should not be treated as such. The information provided does not involve any specific investment objectives, financial situation and needs of any specific person who may receive it. Please be aware, that past performance is not a reliable indicator of future performance and/or results. Past Performance or Forward-looking scenarios based upon the reasonable beliefs of the third-party provider are not a guarantee of future performance. Actual results may differ materially from those anticipated in forward-looking or past performance statements. IC Markets makes no representation or warranty and assumes no liability as to the accuracy or completeness of the information provided, nor any loss arising from any investment based on a recommendation, forecast or any information supplied by any third-party.

Could the Loonie bounce from here?The price is falling towards the pivot and could bounce to the 61.8% Fibonacci resistance.
Pivot: 1.3904
1st Support: 1.3840
1st Resistance: 1.4063
Risk Warning:
Trading Forex and CFDs carries a high level of risk to your capital and you should only trade with money you can afford to lose. Trading Forex and CFDs may not be suitable for all investors, so please ensure that you fully understand the risks involved and seek independent advice if necessary.
Disclaimer:
The above opinions given constitute general market commentary, and do not constitute the opinion or advice of IC Markets or any form of personal or investment advice.
Any opinions, news, research, analyses, prices, other information, or links to third-party sites contained on this website are provided on an "as-is" basis, are intended only to be informative, is not an advice nor a recommendation, nor research, or a record of our trading prices, or an offer of, or solicitation for a transaction in any financial instrument and thus should not be treated as such. The information provided does not involve any specific investment objectives, financial situation and needs of any specific person who may receive it. Please be aware, that past performance is not a reliable indicator of future performance and/or results. Past Performance or Forward-looking scenarios based upon the reasonable beliefs of the third-party provider are not a guarantee of future performance. Actual results may differ materially from those anticipated in forward-looking or past performance statements. IC Markets makes no representation or warranty and assumes no liability as to the accuracy or completeness of the information provided, nor any loss arising from any investment based on a recommendation, forecast or any information supplied by any third-party.

Bullish bounce off pullback support?USD/JPY is falling towards the pivot, which is a pullback support and could bounce to the 1st resistance identified as an overlap resistance.
Pivot: 145.78
1st Support: 144.62
1st Resistance: 148.21
Risk Warning:
Trading Forex and CFDs carries a high level of risk to your capital and you should only trade with money you can afford to lose. Trading Forex and CFDs may not be suitable for all investors, so please ensure that you fully understand the risks involved and seek independent advice if necessary.
Disclaimer:
The above opinions given constitute general market commentary, and do not constitute the opinion or advice of IC Markets or any form of personal or investment advice.
Any opinions, news, research, analyses, prices, other information, or links to third-party sites contained on this website are provided on an "as-is" basis, are intended only to be informative, is not an advice nor a recommendation, nor research, or a record of our trading prices, or an offer of, or solicitation for a transaction in any financial instrument and thus should not be treated as such. The information provided does not involve any specific investment objectives, financial situation and needs of any specific person who may receive it. Please be aware, that past performance is not a reliable indicator of future performance and/or results. Past Performance or Forward-looking scenarios based upon the reasonable beliefs of the third-party provider are not a guarantee of future performance. Actual results may differ materially from those anticipated in forward-looking or past performance statements. IC Markets makes no representation or warranty and assumes no liability as to the accuracy or completeness of the information provided, nor any loss arising from any investment based on a recommendation, forecast or any information supplied by any third-party.

Slower Inflation Growth, Takes DXY lower.Overnight, the DXY traded lower, driven by 2 main factors.
1) The release of lower-than-expected CPI data at 2.3%
2) Rejection of the long-term bearish trendline and the area of confluence formed by the 61.8% and 38.2% Fibonacci retracement levels from the longer term.
If the DXY breaks below the 38.2% Fibonacci retracement level of the shorter term, we could expect to see further downside, toward the target level of 100.
This round-number level would align with the 61.8% Fibonacci retracement level and the short-term bullish trendline.

Bullish continuation?The Swissie (USD/CHF) is falling towards the pivot, which acts as pullback support that aligns with the 50% Fibonacci retracement and could bounce to the 1st resistance.
Pivot: 0.8333
1st Support: 0.8260
1st Resistance: 0.8515
Risk Warning:
Trading Forex and CFDs carries a high level of risk to your capital and you should only trade with money you can afford to lose. Trading Forex and CFDs may not be suitable for all investors, so please ensure that you fully understand the risks involved and seek independent advice if necessary.
Disclaimer:
The above opinions given constitute general market commentary, and do not constitute the opinion or advice of IC Markets or any form of personal or investment advice.
Any opinions, news, research, analyses, prices, other information, or links to third-party sites contained on this website are provided on an "as-is" basis, are intended only to be informative, is not an advice nor a recommendation, nor research, or a record of our trading prices, or an offer of, or solicitation for a transaction in any financial instrument and thus should not be treated as such. The information provided does not involve any specific investment objectives, financial situation and needs of any specific person who may receive it. Please be aware, that past performance is not a reliable indicator of future performance and/or results. Past Performance or Forward-looking scenarios based upon the reasonable beliefs of the third-party provider are not a guarantee of future performance. Actual results may differ materially from those anticipated in forward-looking or past performance statements. IC Markets makes no representation or warranty and assumes no liability as to the accuracy or completeness of the information provided, nor any loss arising from any investment based on a recommendation, forecast or any information supplied by any third-party.

USD/JPY(20250514)Today's AnalysisMarket news:
The U.S. unadjusted CPI annual rate unexpectedly dropped to 2.3% in April, the lowest since February 2021.
Technical analysis:
Today's buying and selling boundaries:
147.76
Support and resistance levels:
148.83
148.43
148.17
147.34
147.08
146.68
Trading strategy:
If the price breaks through 147.76, consider buying, the first target price is 148.17
If the price breaks through 147.34, consider selling, the first target price is 147.08

ETH Testing Red Resistance – Breakout Potential!🚀 CRYPTOCAP:ETH Testing Red Resistance – Breakout Potential! 📈
CRYPTOCAP:ETH is currently testing the red resistance zone. If the price breaks through, the first target could be the green line level! 📊
Let’s watch this breakout unfold! 💼💸

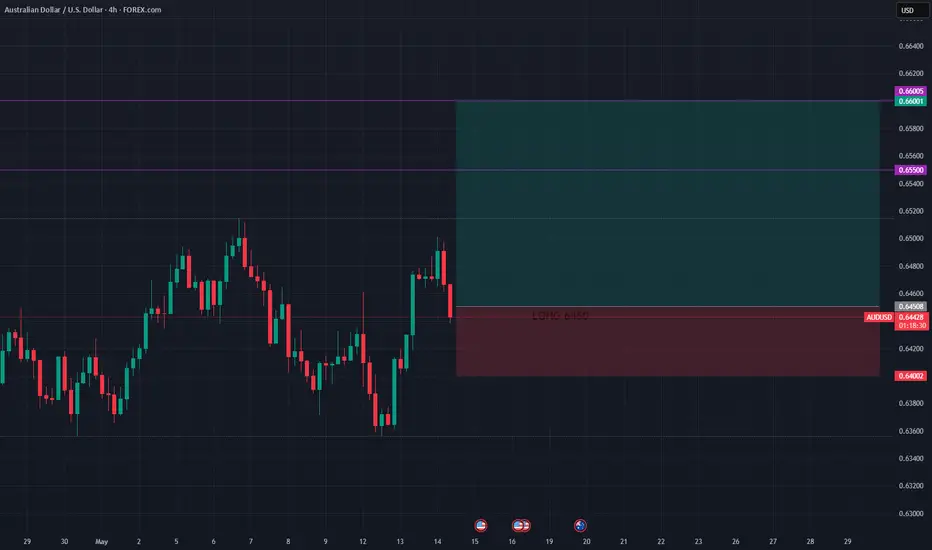
Bullish momentum to extend?The Aussie (AUD/USD) is falling towards the pivot, which has been identified as a pullback support and could bounce to the 1st resistance, which aligns with the 145% Fibonacci extension.
Pivot: 0.6445
1st Support: 0.6408z
1st Resistance: 0.6514
Risk Warning:
Trading Forex and CFDs carries a high level of risk to your capital and you should only trade with money you can afford to lose. Trading Forex and CFDs may not be suitable for all investors, so please ensure that you fully understand the risks involved and seek independent advice if necessary.
Disclaimer:
The above opinions given constitute general market commentary, and do not constitute the opinion or advice of IC Markets or any form of personal or investment advice.
Any opinions, news, research, analyses, prices, other information, or links to third-party sites contained on this website are provided on an "as-is" basis, are intended only to be informative, is not an advice nor a recommendation, nor research, or a record of our trading prices, or an offer of, or solicitation for a transaction in any financial instrument and thus should not be treated as such. The information provided does not involve any specific investment objectives, financial situation and needs of any specific person who may receive it. Please be aware, that past performance is not a reliable indicator of future performance and/or results. Past Performance or Forward-looking scenarios based upon the reasonable beliefs of the third-party provider are not a guarantee of future performance. Actual results may differ materially from those anticipated in forward-looking or past performance statements. IC Markets makes no representation or warranty and assumes no liability as to the accuracy or completeness of the information provided, nor any loss arising from any investment based on a recommendation, forecast or any information supplied by any third-party.

Bullish breakout?The Cable (GBP/USD) has broken out of the resistance level, which was a pullback resistance. A potential pullback to the pivot and a bounce could lead the price to rise toward the 1st resistance level.
Pivot: 1,3259
1st Support: 1.3223
1st Resistance: 1.3319
Risk Warning:
Trading Forex and CFDs carries a high level of risk to your capital and you should only trade with money you can afford to lose. Trading Forex and CFDs may not be suitable for all investors, so please ensure that you fully understand the risks involved and seek independent advice if necessary.
Disclaimer:
The above opinions given constitute general market commentary, and do not constitute the opinion or advice of IC Markets or any form of personal or investment advice.
Any opinions, news, research, analyses, prices, other information, or links to third-party sites contained on this website are provided on an "as-is" basis, are intended only to be informative, is not an advice nor a recommendation, nor research, or a record of our trading prices, or an offer of, or solicitation for a transaction in any financial instrument and thus should not be treated as such. The information provided does not involve any specific investment objectives, financial situation and needs of any specific person who may receive it. Please be aware, that past performance is not a reliable indicator of future performance and/or results. Past Performance or Forward-looking scenarios based upon the reasonable beliefs of the third-party provider are not a guarantee of future performance. Actual results may differ materially from those anticipated in forward-looking or past performance statements. IC Markets makes no representation or warranty and assumes no liability as to the accuracy or completeness of the information provided, nor any loss arising from any investment based on a recommendation, forecast or any information supplied by any third-party.

Could the Fiber reverse from here?The price is rising towards the pivot and could reverse to the 1st support.
Pivot: 1.1208
1st Support: 1.1117
1st Resistance: 1.1244
Risk Warning:
Trading Forex and CFDs carries a high level of risk to your capital and you should only trade with money you can afford to lose. Trading Forex and CFDs may not be suitable for all investors, so please ensure that you fully understand the risks involved and seek independent advice if necessary.
Disclaimer:
The above opinions given constitute general market commentary, and do not constitute the opinion or advice of IC Markets or any form of personal or investment advice.
Any opinions, news, research, analyses, prices, other information, or links to third-party sites contained on this website are provided on an "as-is" basis, are intended only to be informative, is not an advice nor a recommendation, nor research, or a record of our trading prices, or an offer of, or solicitation for a transaction in any financial instrument and thus should not be treated as such. The information provided does not involve any specific investment objectives, financial situation and needs of any specific person who may receive it. Please be aware, that past performance is not a reliable indicator of future performance and/or results. Past Performance or Forward-looking scenarios based upon the reasonable beliefs of the third-party provider are not a guarantee of future performance. Actual results may differ materially from those anticipated in forward-looking or past performance statements. IC Markets makes no representation or warranty and assumes no liability as to the accuracy or completeness of the information provided, nor any loss arising from any investment based on a recommendation, forecast or any information supplied by any third-party.

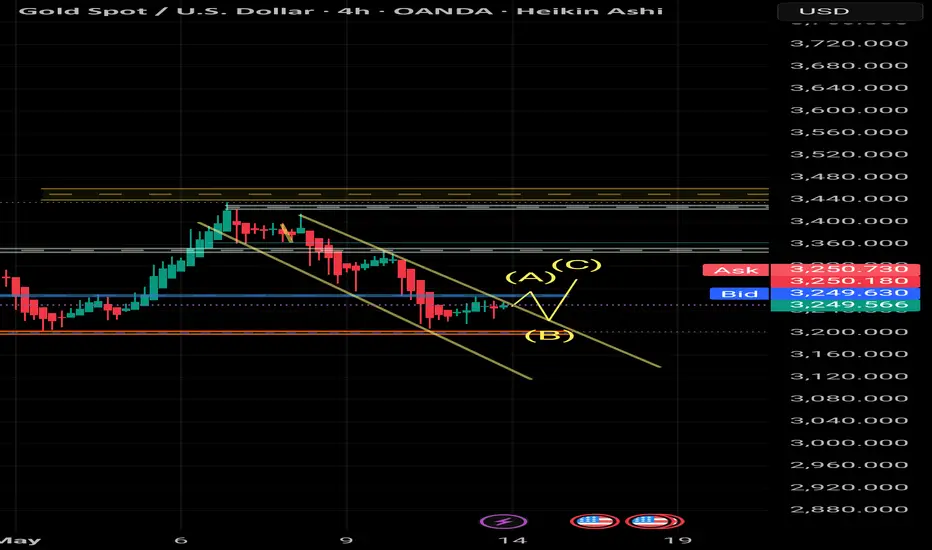
Mentioned as last episode Hi guys a few minutes late I was published price action strategy of xau and explained that if Liquidity will surprising us we need to getting a new chart figure.
I show you B plan on this chart .
as starting the trade session at next on houre we can making decisions for how to start our position and how configuration our TP or SL
Bullish bounce off pullback support?XAU/USD has bounced off the support level which is a pullback support and could potentially rise from this level to our take profit.
Entry: 3,202.71
Why we like it:
There is a pullback support level.
Stop loss: 3,151.11
Why we like it:
There is a pullback support level that lines up with the 127.2% Fibonacci extension.
Take profit: 3,344.32
Why we like it:
There is a pullback resistance level that lines up with the 61.8% Fibonacci retracement.
Enjoying your TradingView experience? Review us!
lease be advised that the information presented on TradingView is provided to Vantage (‘Vantage Global Limited’, ‘we’) by a third-party provider (‘Everest Fortune Group’). Please be reminded that you are solely responsible for the trading decisions on your account. There is a very high degree of risk involved in trading. Any information and/or content is intended entirely for research, educational and informational purposes only and does not constitute investment or consultation advice or investment strategy. The information is not tailored to the investment needs of any specific person and therefore does not involve a consideration of any of the investment objectives, financial situation or needs of any viewer that may receive it. Kindly also note that past performance is not a reliable indicator of future results. Actual results may differ materially from those anticipated in forward-looking or past performance statements. We assume no liability as to the accuracy or completeness of any of the information and/or content provided herein and the Company cannot be held responsible for any omission, mistake nor for any loss or damage including without limitation to any loss of profit which may arise from reliance on any information supplied by Everest Fortune Group.

Potential bearish drop?USD/JPY has rejected off the resistance level which is an overlap resistance that is slightly below the 78.6% Fibonacci retracement and could drop from this level to our take profit.
Entry: 148.25
Why we like it:
There is an overlap resistance level that is slightly below the 78.6% Fibonacci retracement.
Stop loss: 150.24
Why we like it:
There is a pullback resistance level.
Take profit: 145.91
Why we like it:
There is a pullback support level that is slightly above the 50% Fibonacci retracement.
Enjoying your TradingView experience? Review us!
lease be advised that the information presented on TradingView is provided to Vantage (‘Vantage Global Limited’, ‘we’) by a third-party provider (‘Everest Fortune Group’). Please be reminded that you are solely responsible for the trading decisions on your account. There is a very high degree of risk involved in trading. Any information and/or content is intended entirely for research, educational and informational purposes only and does not constitute investment or consultation advice or investment strategy. The information is not tailored to the investment needs of any specific person and therefore does not involve a consideration of any of the investment objectives, financial situation or needs of any viewer that may receive it. Kindly also note that past performance is not a reliable indicator of future results. Actual results may differ materially from those anticipated in forward-looking or past performance statements. We assume no liability as to the accuracy or completeness of any of the information and/or content provided herein and the Company cannot be held responsible for any omission, mistake nor for any loss or damage including without limitation to any loss of profit which may arise from reliance on any information supplied by Everest Fortune Group.
