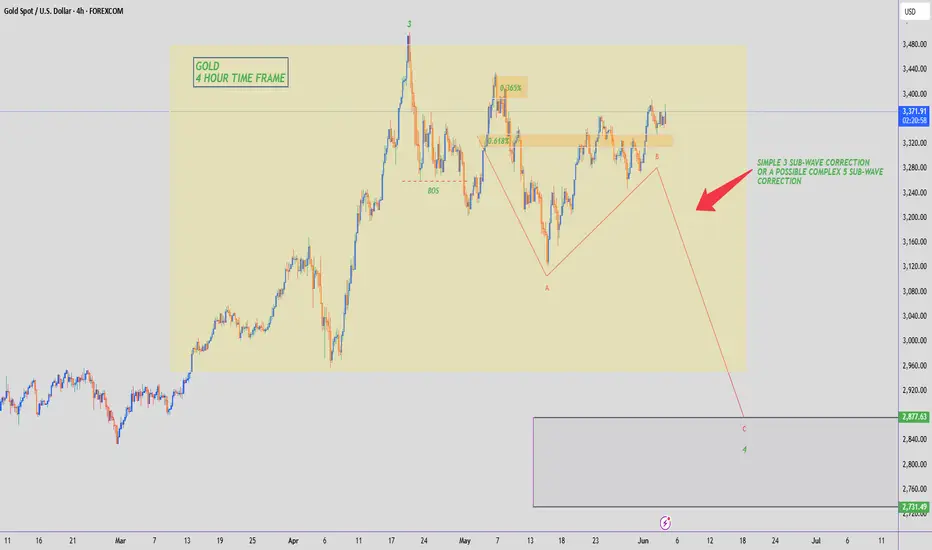
GOLD - WAVE 4 CORRECTION TO $2,800 (UPDATE)The 'resistance turned support' which I mentioned yesterday is holding up well. After the retest of the support zone, we're currently seeing bullish momentum keep Gold prices up.
As soon as Gold surpasses $3,400 & closes WITHIN the previous 0.365% zone, I will be sure that the 3 Sub-Wave (A,B,C) correction for sellers is over & buyers are now heading towards a new ATH. Until then I am still wary & being careful of sellers.
USD (US Dollar)
NAS and Oil Down - Minimal DrawdownQuick thoughts and reasons for trades taken with almost zero drawdown
Nas Short/Oil Short Trades

USDCAD 04/06 – BoC Rate Decision Ahead USDCAD 04/06 – BoC Rate Decision Ahead | Will the Market Break Higher or Reverse From 1.3820?
The USDCAD pair is trading around the 1.3700 area as markets prepare for the upcoming Bank of Canada (BoC) interest rate decision. Price action shows potential for a breakout, but macro risks remain high.
🌍 MACRO OUTLOOK
BoC Expected to Hold Rates
Analysts widely expect the BoC to keep the interest rate unchanged at 2.75%, marking the third consecutive pause. Inflation has slipped below 2%, supporting the case for a dovish tone.
Trade Policy in Focus
With growing global uncertainties and Trump’s trade stance back in the spotlight, BoC Governor Tiff Macklem is expected to address policy risks, especially related to tariffs.
Market Sentiment
USD is mildly weaker after soft ISM data.
CAD remains near YTD highs but sensitive to policy commentary.
📉 TECHNICAL OUTLOOK – H2 Chart
Price is forming a potential double bottom near the 1.3693 zone – a key structure support.
Resistance sits at 1.3725 – 1.3757. A confirmed breakout could lead to a test of 1.3824, the recent high.
Failure to hold 1.3690 may expose deeper downside toward 1.3620–1.3600.
🔑 KEY LEVELS TO WATCH
🟢 BUY ZONE: 1.3693 – 1.3700
SL: 1.3670
TP: 1.3725 → 1.3757 → 1.3800 → 1.3824
🔴 SELL ZONE: 1.3824 – 1.3830
SL: 1.3850
TP: 1.3780 → 1.3750 → 1.3700 → 1.3650
🎯 TRADE STRATEGY
If BoC holds rates with a dovish bias, USDCAD may rally sharply toward 1.3824 and potentially higher.
If BoC surprises with hawkish comments, CAD strength may push the pair lower, targeting the 1.36 handle.
Traders should be cautious around 1.3690 – this is the pivot zone for the week.
📌 CONCLUSION
“The BoC’s decision may already be priced in – but the true volatility could come from Governor Macklem’s press conference. Any hint regarding Trump’s trade policies could trigger sharp moves. Stick to clean key levels and protect your capital.”

GOLD - Third Wave Next!Hello TradingView Family / Fellow Traders. This is Richard, also known as theSignalyst.
📈After breaking above the $3,330 structure, GOLD's momentum shifted to bullish again from a short-term perspective.
Moreover, the $3,310 is a strong demand as Gold made an explosive movement from it.
🏹 Thus, the highlighted blue circle is a strong area to look for buy setups as it is the intersection of support, demand and red trendline acting as a non-horizontal support.
📚 As per my trading style:
As #XAUUSD retests the blue circle zone, I will be looking for bullish reversal setups (like a double bottom pattern, trendline break , and so on...)
📚 Always follow your trading plan regarding entry, risk management, and trade management.
Good luck!
All Strategies Are Good; If Managed Properly!
~Rich
Disclosure: I am part of Trade Nation's Influencer program and receive a monthly fee for using their TradingView charts in my analysis.

Dollar BearishAs per yesterdays video. We are still below the block highlited before the fact.
We still hunting the Target on Dollar as shown in the chart.

NZDUSD to find buyers around trend line support?NZDUSD - 24h expiry
Price action looks to be forming a bottom.
The primary trend remains bullish.
This is positive for sentiment and the uptrend has potential to return.
We look for a temporary move lower.
Further upside is expected although we prefer to buy into dips close to the 0.5975 level.
We look to Buy at 0.5975 (stop at 0.5940)
Our profit targets will be 0.6074 and 0.6220
Resistance: 0.6006 / 0.6080 / 0.6220
Support: 0.5955 / 0.5850 / 0.5775
Risk Disclaimer
The trade ideas beyond this page are for informational purposes only and do not constitute investment advice or a solicitation to trade. This information is provided by Signal Centre, a third-party unaffiliated with OANDA, and is intended for general circulation only. OANDA does not guarantee the accuracy of this information and assumes no responsibilities for the information provided by the third party. The information does not take into account the specific investment objectives, financial situation, or particular needs of any particular person. You should take into account your specific investment objectives, financial situation, and particular needs before making a commitment to trade, including seeking advice from an independent financial adviser regarding the suitability of the investment, under a separate engagement, as you deem fit.
You accept that you assume all risks in independently viewing the contents and selecting a chosen strategy.
Where the research is distributed in Singapore to a person who is not an Accredited Investor, Expert Investor or an Institutional Investor, Oanda Asia Pacific Pte Ltd (“OAP“) accepts legal responsibility for the contents of the report to such persons only to the extent required by law. Singapore customers should contact OAP at 6579 8289 for matters arising from, or in connection with, the information/research distributed.

USDJPY Potential DownsidesHey Traders, in today's trading session we are monitoring USDJPY for a selling opportunity around 143.200 zone, USDJPY is trading in a downtrend and currently is in a correction phase in which it is approaching the trend at 143.200 support and resistance area.
Trade safe, Joe.

CRUDE OIL TO HIT $160?!Oil prices broke down lower in the past few weeks, after a much needed LQ grab, following a 2 year consolidation. We’ve seen a ‘5 Wave Complex Correction’, which should now be followed by price recovery.
Wait for buyers to BREAK ABOVE our ‘buying confirmation’ level, followed a by a retest before buying, otherwise leave it❗️

Bullish bounce off 50% Fibonacci support?XAU/USD is falling towards the support level that lines up with the 50% Fibonacci retracement and could bounce from this level to our take profit.
Entry: 3,327.90
Why we like it:
There is a pullback support level that lines up with the 50% Fibonacci retracement.
Stop loss: 3,304.13
Why we like it:
There is an overlap support level that is slightly above the 78.6% Fibonacci retracement.
Take profit: 3,390.21
Why we like it:
There is a pullback resistance level.
Enjoying your TradingView experience? Review us!
Please be advised that the information presented on TradingView is provided to Vantage (‘Vantage Global Limited’, ‘we’) by a third-party provider (‘Everest Fortune Group’). Please be reminded that you are solely responsible for the trading decisions on your account. There is a very high degree of risk involved in trading. Any information and/or content is intended entirely for research, educational and informational purposes only and does not constitute investment or consultation advice or investment strategy. The information is not tailored to the investment needs of any specific person and therefore does not involve a consideration of any of the investment objectives, financial situation or needs of any viewer that may receive it. Kindly also note that past performance is not a reliable indicator of future results. Actual results may differ materially from those anticipated in forward-looking or past performance statements. We assume no liability as to the accuracy or completeness of any of the information and/or content provided herein and the Company cannot be held responsible for any omission, mistake nor for any loss or damage including without limitation to any loss of profit which may arise from reliance on any information supplied by Everest Fortune Group.

Potential bearish drop?NZD/USD is reacting off the resistance level which is a pullback resistance and could drop from this level to our take profit.
Entry: 0.6011
Why we like it:
There is a pullback resistance level.
Stop loss: 0.6051
Why we like it:
There is a pullback resistance level.
Take profit: 0.5950
Why we like it:
There is a pullback support level.
Enjoying your TradingView experience? Review us!
Please be advised that the information presented on TradingView is provided to Vantage (‘Vantage Global Limited’, ‘we’) by a third-party provider (‘Everest Fortune Group’). Please be reminded that you are solely responsible for the trading decisions on your account. There is a very high degree of risk involved in trading. Any information and/or content is intended entirely for research, educational and informational purposes only and does not constitute investment or consultation advice or investment strategy. The information is not tailored to the investment needs of any specific person and therefore does not involve a consideration of any of the investment objectives, financial situation or needs of any viewer that may receive it. Kindly also note that past performance is not a reliable indicator of future results. Actual results may differ materially from those anticipated in forward-looking or past performance statements. We assume no liability as to the accuracy or completeness of any of the information and/or content provided herein and the Company cannot be held responsible for any omission, mistake nor for any loss or damage including without limitation to any loss of profit which may arise from reliance on any information supplied by Everest Fortune Group.

DOW JONES TO 111 THOUSAND..in the the 2030's.
as an investor you must be thinking 2 decades down the line.
NOT 2 quarters.
They can not
stop
printing #FIAT
it's in the code.
A 8% compound rate puts the Dow Jones at 85,000 in 2034.
I'm long forever.

Bearish reversal off 61.8% Fibonacci resistance?AUD/USD is rising towards the resistance level which is a pullback resistance that lines up with the 61.8% Fibonacci retracement and could reverse from this level to our take profit.
Entry: 0.6477
Why we like it:
There is a pullback resistance level that aligns with the 61.8% Fibonacci retracement.
Stop loss: 0.6496
Why we like it:
There is a pullback resistance level.
Take profit: 0.6450
Why we like it:
There is an overlap support level.
Enjoying your TradingView experience? Review us!
Please be advised that the information presented on TradingView is provided to Vantage (‘Vantage Global Limited’, ‘we’) by a third-party provider (‘Everest Fortune Group’). Please be reminded that you are solely responsible for the trading decisions on your account. There is a very high degree of risk involved in trading. Any information and/or content is intended entirely for research, educational and informational purposes only and does not constitute investment or consultation advice or investment strategy. The information is not tailored to the investment needs of any specific person and therefore does not involve a consideration of any of the investment objectives, financial situation or needs of any viewer that may receive it. Kindly also note that past performance is not a reliable indicator of future results. Actual results may differ materially from those anticipated in forward-looking or past performance statements. We assume no liability as to the accuracy or completeness of any of the information and/or content provided herein and the Company cannot be held responsible for any omission, mistake nor for any loss or damage including without limitation to any loss of profit which may arise from reliance on any information supplied by Everest Fortune Group.

Falling towards pullback support?EUR/USD is falling towards the support level which is a pullback support that aligns with the 50% Fibonacci retracement and could bounce from this level to our take profit.
Entry: 1.1325
Why we like it:
There is a pullback support level that lines up with the 50% Fibonacci retracement.
Stop loss: 1.1266
Why we like it:
There is a pullback support level that lines up with the 78.6% Fibonacci retracement.
Take profit: 1.1418
Why we like it:
There is a pullback resistance level.
Enjoying your TradingView experience? Review us!
Please be advised that the information presented on TradingView is provided to Vantage (‘Vantage Global Limited’, ‘we’) by a third-party provider (‘Everest Fortune Group’). Please be reminded that you are solely responsible for the trading decisions on your account. There is a very high degree of risk involved in trading. Any information and/or content is intended entirely for research, educational and informational purposes only and does not constitute investment or consultation advice or investment strategy. The information is not tailored to the investment needs of any specific person and therefore does not involve a consideration of any of the investment objectives, financial situation or needs of any viewer that may receive it. Kindly also note that past performance is not a reliable indicator of future results. Actual results may differ materially from those anticipated in forward-looking or past performance statements. We assume no liability as to the accuracy or completeness of any of the information and/or content provided herein and the Company cannot be held responsible for any omission, mistake nor for any loss or damage including without limitation to any loss of profit which may arise from reliance on any information supplied by Everest Fortune Group.

USDollar Is Making An Intraday Pullback Within DowntrendGood morning traders! Stocks keep pushing higher along with yields, so it looks like 10Y US Notes could still see lower support levels, and that’s why USdollar is in a bigger intraday correction. What we want to say is that while the 10Y US Notes are still searching for support, the DXY can stay in recovery mode or at least sideways. In the meantime, stocks can easily see even higher levels after NVIDIA surpassed earnings.
Looking at the intraday USDollar Index – DXY chart, we see a leading diagonal formation, so we are tracking now an intraday abc correction before a bearish continuation, thus keep an eye on GAP from May 18 around 101 level that can be filled and may act as a resistance before a bearish continuation.

My Market Review for the week 03/06/2025 (Tuesday)Staying bearish for now.
Let me know your thoughts and ideas and of any other pairs you would like me to look at

Waiting for a Short-Term Pullback Before the Next Bullish Leg? NZDUSD – Waiting for a Short-Term Pullback Before the Next Bullish Leg?
As global markets await the upcoming U.S. Non-Farm Payrolls (NFP) report later this week, NZDUSD is showing early signs of short-term weakness following a strong bullish rally from the 0.5905 low. While the broader structure remains bullish, a corrective move may be necessary to shake out weak hands and reload liquidity before a renewed surge.
🌐 Macro & Fundamental Outlook:
New Zealand: Recent economic releases from New Zealand have been lackluster, yet the RBNZ's hawkish policy stance (high interest rates) continues to support the Kiwi. However, pressure from China – New Zealand’s top trading partner – remains a drag.
United States: The U.S. Dollar remains under pressure due to rising expectations that the Fed will start cutting rates by Q3 2025, despite some hawkish tones from FOMC officials. This week’s NFP report will be a decisive factor.
Market Sentiment: After a ~150-pip rally, traders are beginning to take profits. The correction could offer a golden re-entry opportunity.
📊 Technical Analysis:
Trend Bias: The market structure is still in an uptrend, maintaining Higher Highs and Higher Lows.
Fibonacci Retracement: Price is currently pulling back toward the 0.5 – 0.618 Fibo zone (0.5992 – 0.5978), aligning with the H1 89 & 200 EMAs.
EMA Structure (13 – 34 – 89 – 200): Still bullish but currently signaling a short-term pullback.
🔑 Key Price Zones:
Resistance Levels: 0.6014 – 0.6052
Support Levels: 0.5973 – 0.5951 – 0.5932
🧭 Trade Plan
📌 Buy Setup (trend continuation):
BUY ZONE: 0.5951 – 0.5932
SL: 0.5900
TP: 0.5978 → 0.6014 → 0.6052
📌 Expecting a bullish bounce off the 61.8% Fibo + EMA 200 confluence ahead of NFP.
📌 Sell Setup (short-term countertrend scalp):
SELL ZONE: 0.6014 – 0.6025
SL: 0.6060
TP: 0.5978 → 0.5951
📌 Anticipating a reaction at a key resistance zone – ideal for intraday scalpers.
⚠️ Risk Management Notes:
Stay cautious ahead of high-impact U.S. data (ADP, Jobless Claims, NFP).
Favor buying the dip in line with the higher-timeframe trend.
Maintain discipline with tight SLs (30–35 pips max per setup).

GBPUSD – Is the Recovery Losing Steam? GBPUSD – Is the Recovery Losing Steam? Watch for Technical Pullback Ahead of NFP
The GBPUSD pair has recently rebounded impressively from the 1.3427 key support zone, reflecting short-term USD weakness and growing speculation of rate cuts by the Fed. However, after the strong bullish move, the market is now showing signs of exhaustion and potential profit-taking—especially with high-impact US employment data just around the corner.
🔍 Macro & Fundamental Overview:
United States: All eyes are on this week’s JOLTS and Non-Farm Payrolls (NFP) reports. Weak jobs data could strengthen the case for rate cuts by the Fed in Q3, weighing on the US Dollar. On the flip side, a solid print would revive “higher for longer” rate expectations and likely support USD strength.
United Kingdom: Although inflation remains above the Bank of England’s 2% target, political uncertainty ahead of July’s general election may keep GBP on the defensive, especially if BoE signals a dovish turn.
Bond Yield Spread (UK vs US): A widening spread in favor of the USD is exerting downward pressure on GBPUSD in the medium term.
📈 Technical Outlook (H1 Chart):
Structure: Price has formed a double-top pattern at 1.35598 and 1.35322, with multiple rejections—signaling a weakening bullish momentum after a sustained rally.
EMA 13 – 34 – 89 – 200 Setup: Price is currently testing the EMA89 zone (~1.34854). A clean break below this moving average could accelerate the downside correction.
FVG Zone (Liquidity Pool): The 1.3427 – 1.3457 area offers a potential liquidity sweep and may serve as a springboard for the next bullish leg.
📊 Trade Scenarios:
🔻 Short-Term SELL SCALP:
Entry: 1.3532 – 1.3545
Stop Loss: 1.3565
Take Profit: 1.3485 → 1.3457 → 1.3427
→ Ideal if price fails to hold above recent highs and forms bearish rejection candles.
🔵 BUY ZONE Setup:
Entry: 1.3427 – 1.3440
Stop Loss: 1.3400
Take Profit: 1.3475 → 1.3505 → 1.3535 → 1.3555
→ High-probability entry if price reacts positively to the FVG zone and maintains bullish structure.
📌 Final Thoughts:
GBPUSD is currently in a delicate zone where both technical and macro forces are converging. While the broader trend remains bullish, momentum is slowing. With critical US jobs data due, traders should stay cautious and rely on clear confirmations around key price levels. Maintain strict risk management and look for liquidity-driven moves around FVG zones.

EURUSD – Retracement Expected Before Further UpsideEURUSD – Retracement Expected Before Further Upside
The EURUSD pair has seen strong bullish momentum over the past two days, mainly driven by the weakening U.S. dollar. Last week’s softer-than-expected U.S. Core PCE and PMI data fueled speculation that the Federal Reserve may hold rates steady for longer, weighing on USD sentiment.
However, with upcoming speeches from FOMC members and the Non-Farm Payrolls (NFP) data due later this week, traders may look to take profit or step aside, leading to a short-term retracement before any continuation of the bullish trend.
🔍 Macro & Fundamental Overview:
USD remains under pressure amid declining inflation signals and weakening economic data.
ECB is expected to cut rates, but at a slower pace than the Fed, creating a divergence that supports the Euro in the near term.
Political uncertainties in the EU, including upcoming elections, are worth monitoring.
📉 Technical Analysis:
The medium-term trend remains bullish with EMA 13–34–89–200 aligned to the upside.
Price is currently reacting at the 0.0 FIBO level (1.1420), suggesting a potential pullback.
Key support lies between 1.1345 – 1.1317. If this zone holds, it could serve as a solid base for a bullish continuation.
🧭 Suggested Trade Scenarios:
🔵 BUY ZONE: 1.1317 – 1.1345
SL: 1.1285
TP: 1.1370 → 1.1400 → 1.1420 → 1.1450+
🔻 SELL ZONE (Short-term counter-trade): 1.1418 – 1.1425
SL: 1.1450
TP: 1.1385 → 1.1350 → 1.1320

Could the Loonie reverse from here?The price is rising towards the pivot, which has been identified as a pullback resistance and could reverse to the 127.2% Fibonacci support.
Pivot: 1.3767
1st Support: 1.3634
1st Resistance: 1.3856
Risk Warning:
Trading Forex and CFDs carries a high level of risk to your capital and you should only trade with money you can afford to lose. Trading Forex and CFDs may not be suitable for all investors, so please ensure that you fully understand the risks involved and seek independent advice if necessary.
Disclaimer:
The above opinions given constitute general market commentary, and do not constitute the opinion or advice of IC Markets or any form of personal or investment advice.
Any opinions, news, research, analyses, prices, other information, or links to third-party sites contained on this website are provided on an "as-is" basis, are intended only to be informative, is not an advice nor a recommendation, nor research, or a record of our trading prices, or an offer of, or solicitation for a transaction in any financial instrument and thus should not be treated as such. The information provided does not involve any specific investment objectives, financial situation and needs of any specific person who may receive it. Please be aware, that past performance is not a reliable indicator of future performance and/or results. Past Performance or Forward-looking scenarios based upon the reasonable beliefs of the third-party provider are not a guarantee of future performance. Actual results may differ materially from those anticipated in forward-looking or past performance statements. IC Markets makes no representation or warranty and assumes no liability as to the accuracy or completeness of the information provided, nor any loss arising from any investment based on a recommendation, forecast or any information supplied by any third-party.

Potential bearish drop off pullback resistance?The Swissie (USD/CHF) is rising towards the pivot, which acts as a pullback resistance and could drop to the 1st support that aligns with the 78.6% Fibonacci projection.
Pivot: 0.8199
1st Support: 0.8113
1st Resistance: 0.8267
Risk Warning:
Trading Forex and CFDs carries a high level of risk to your capital and you should only trade with money you can afford to lose. Trading Forex and CFDs may not be suitable for all investors, so please ensure that you fully understand the risks involved and seek independent advice if necessary.
Disclaimer:
The above opinions given constitute general market commentary, and do not constitute the opinion or advice of IC Markets or any form of personal or investment advice.
Any opinions, news, research, analyses, prices, other information, or links to third-party sites contained on this website are provided on an "as-is" basis, are intended only to be informative, is not an advice nor a recommendation, nor research, or a record of our trading prices, or an offer of, or solicitation for a transaction in any financial instrument and thus should not be treated as such. The information provided does not involve any specific investment objectives, financial situation and needs of any specific person who may receive it. Please be aware, that past performance is not a reliable indicator of future performance and/or results. Past Performance or Forward-looking scenarios based upon the reasonable beliefs of the third-party provider are not a guarantee of future performance. Actual results may differ materially from those anticipated in forward-looking or past performance statements. IC Markets makes no representation or warranty and assumes no liability as to the accuracy or completeness of the information provided, nor any loss arising from any investment based on a recommendation, forecast or any information supplied by any third-party.

Bearish reversal off 50% Fibonacci resistance?USD/JPY is rising towards the pivot, which aligns with the 50% Fibonacci retracement and could reverse to the 1st support, a pullback level.
Pivot: 144.37
1st Support: 141.94
1st Resistance: 146.17
Risk Warning:
Trading Forex and CFDs carries a high level of risk to your capital and you should only trade with money you can afford to lose. Trading Forex and CFDs may not be suitable for all investors, so please ensure that you fully understand the risks involved and seek independent advice if necessary.
Disclaimer:
The above opinions given constitute general market commentary, and do not constitute the opinion or advice of IC Markets or any form of personal or investment advice.
Any opinions, news, research, analyses, prices, other information, or links to third-party sites contained on this website are provided on an "as-is" basis, are intended only to be informative, is not an advice nor a recommendation, nor research, or a record of our trading prices, or an offer of, or solicitation for a transaction in any financial instrument and thus should not be treated as such. The information provided does not involve any specific investment objectives, financial situation and needs of any specific person who may receive it. Please be aware, that past performance is not a reliable indicator of future performance and/or results. Past Performance or Forward-looking scenarios based upon the reasonable beliefs of the third-party provider are not a guarantee of future performance. Actual results may differ materially from those anticipated in forward-looking or past performance statements. IC Markets makes no representation or warranty and assumes no liability as to the accuracy or completeness of the information provided, nor any loss arising from any investment based on a recommendation, forecast or any information supplied by any third-party.

Bullish bounce off pullback support?The Fiber (EUR/USD) is falling towards the pivot and could bounce to the 1st resistance.
Pivot: 1.1367
1st Support: 1.1278
1st Resistance: 1.1475
Risk Warning:
Trading Forex and CFDs carries a high level of risk to your capital and you should only trade with money you can afford to lose. Trading Forex and CFDs may not be suitable for all investors, so please ensure that you fully understand the risks involved and seek independent advice if necessary.
Disclaimer:
The above opinions given constitute general market commentary, and do not constitute the opinion or advice of IC Markets or any form of personal or investment advice.
Any opinions, news, research, analyses, prices, other information, or links to third-party sites contained on this website are provided on an "as-is" basis, are intended only to be informative, is not an advice nor a recommendation, nor research, or a record of our trading prices, or an offer of, or solicitation for a transaction in any financial instrument and thus should not be treated as such. The information provided does not involve any specific investment objectives, financial situation and needs of any specific person who may receive it. Please be aware, that past performance is not a reliable indicator of future performance and/or results. Past Performance or Forward-looking scenarios based upon the reasonable beliefs of the third-party provider are not a guarantee of future performance. Actual results may differ materially from those anticipated in forward-looking or past performance statements. IC Markets makes no representation or warranty and assumes no liability as to the accuracy or completeness of the information provided, nor any loss arising from any investment based on a recommendation, forecast or any information supplied by any third-party.

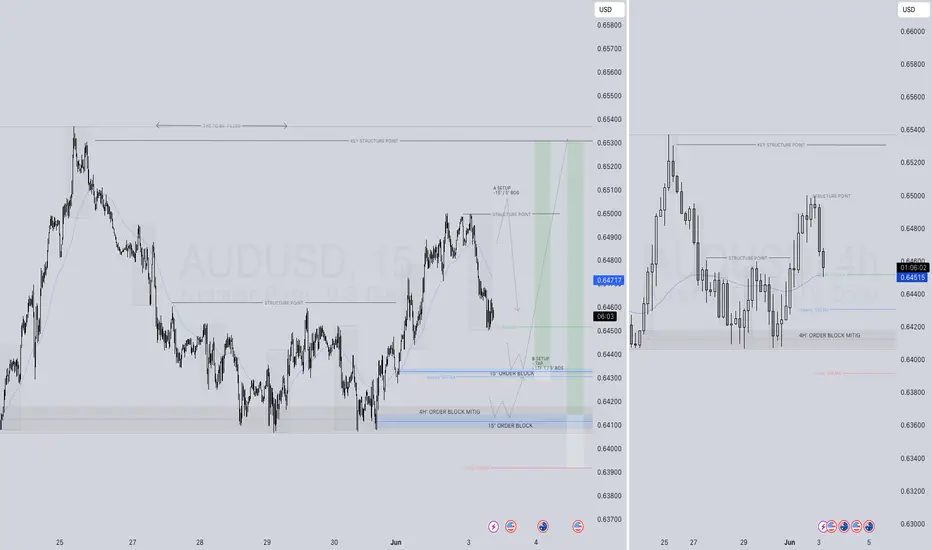
AUDUSD LONG FORECAST Q2 W23 D3 Y25👀 AUDUSD LONG FORECAST Q2 W23 D3 Y25
Professional Risk Managers👋
Welcome back to another FRGNT chart update📈
Diving into some Forex setups using predominantly higher time frame order blocks alongside intraday confirmation & breaks of structure.
Let’s see what price action is telling us today! 🔥
💡Here are some trade confluences📝
✅Weekly 50 EMA
✅Daily 50 EMA
✅15’ order block
✅Intraday bullish breaks of structure
🔑 Remember, to participate in trading comes always with a degree of risk, therefore as professional risk managers it remains vital that we stick to our risk management plan as well as our trading strategies.
📈The rest, we leave to the balance of probabilities.
💡Fail to plan. Plan to fail.
🏆It has always been that simple.
❤️Good luck with your trading journey, I shall see you at the very top.
🎯Trade consistent, FRGNT X