GBPUSD – DAILY FORECAST Q3 | W31 | D29 | Y25📊 GBPUSD – DAILY FORECAST
Q3 | W31 | D29 | Y25
Daily Forecast 🔍📅
Here’s a short diagnosis of the current chart setup 🧠📈
Higher time frame order blocks have been identified — these are our patient points of interest 🎯🧭.
It’s crucial to wait for a confirmed break of structure 🧱✅ before forming a directional bias.
This keeps us disciplined and aligned with what price action is truly telling us.
📈 Risk Management Protocols
🔑 Core principles:
Max 1% risk per trade
Only execute at pre-identified levels
Use alerts, not emotion
Stick to your RR plan — minimum 1:2
🧠 You’re not paid for how many trades you take, you’re paid for how well you manage risk.
🧠 Weekly FRGNT Insight
"Trade what the market gives, not what your ego wants."
Stay mechanical. Stay focused. Let the probabilities work.
FX:GBPUSD
USD (US Dollar)

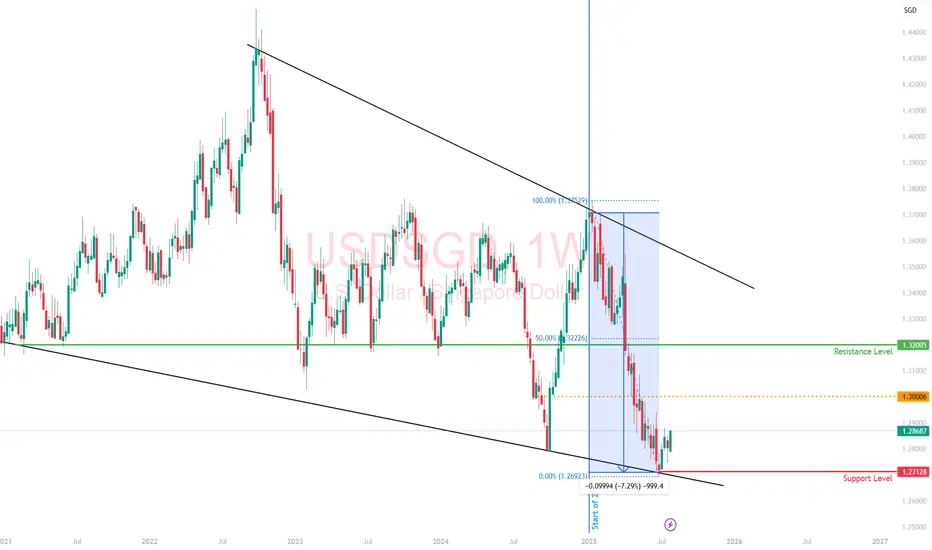
#014: USD/SGD SHORT Investment Opportunity
In recent days, an extremely interesting window has opened on the USD/SGD exchange rate, a pair often overlooked by retail traders but highly sensitive to Asian institutional flows. I decided to open a short position, betting on a decline in the US dollar against the Singapore dollar, for a series of structural, real, and measurable reasons.
The US dollar has begun to show clear signs of weakness. Recent macroeconomic data releases have been below expectations, particularly those related to inflation and consumption. At the same time, market expectations regarding interest rates are shifting in the opposite direction from a few months ago: the probability of a rate cut by the Fed by the end of the year is growing. Added to this is a visible decline in open interest on dollar-linked futures contracts, a clear sign that many institutional long positions are being closed. The market simply no longer believes in a strong dollar.
While the US dollar is losing momentum, the Singapore dollar is quietly but solidly strengthening. The Monetary Authority of Singapore has maintained an extremely prudent and conservative monetary policy, and capital flows into Asian markets continue to grow. The Singapore dollar has historically been seen as a regional safe-haven currency, and in an environment where the US dollar is weakening, it becomes an ideal candidate to accommodate new relative strength.
One of the most significant factors in this decision, however, is retail sentiment. Currently, over 80% of retail traders are long USD/SGD. This imbalance is striking. Typically, when the vast majority of non-professional traders are aligned on one side, the market ends up moving in the opposite direction. Institutions, on the other hand, patiently build short positions, taking advantage of excessive retail euphoria. Conventional sentiment is often the best counter-indicator.
Chart and volume analysis perfectly confirm this scenario. In recent candles, we have seen an anomalous spike above resistance, followed by a sharp rejection. This is classic behavior: institutions push the price above a key zone, trigger long retail traders' stops, raise liquidity, and then let the price fall. No news, no macro trigger: just pure manipulation. The structure now has all the characteristics to unload downwards.
The chosen take profit level is not random. It is positioned in an area historically defended by institutions, specifically between 1.27680 and 1.27720. In that range, there are volume gaps, representing the classic unloading zones where banks close positions. Furthermore, FX options show a high concentration of put strikes in that same zone, confirming that options desks are also working to defend a bearish move.
All these elements combined—macroeconomic, behavioral, volumetric, and positioning—lead to a single logical conclusion: shorting USD/SGD at this precise moment is a rational, concrete trade, and consistent with institutional flows. No gambles. No forcing. Just chance, balance and timing.

Singapore Dollar: Asia’s Quiet Safe Haven with Eyes on ParityThe Singapore dollar has quietly emerged as one of the strongest performers in Asia, gaining over 7% against the US dollar this year.
While much of the FX world fixates on the yen or franc in times of uncertainty, the SGD is carving out a niche as a regional safe-haven, driven not by size or liquidity, but by credibility.
The strength in the SGD isn’t just about USD weakness. Singapore's macro fundamentals
budget surpluses,
robust reserves, and
deep-rooted investor confidence
offer a kind of quiet strength that traders tend to overlook until it becomes obvious.
This makes the SGD a compelling hedge against both regional turmoil and global dollar decay.
As more global capital looks for stable homes outside of the traditional, Singapore’s financial system and currency are set to benefit.
The idea of SGD hitting parity with the USD, once dismissed as unrealistic, is now getting serious attention.
Analysts have suggested that it could happen within five years, but I wouldn’t be surprised if it comes sooner!
The greenback’s structural issues of twin deficits, political gridlock, and de-dollarization headwinds are no longer theoretical.
That said, liquidity is still a constraint. The SGD makes up just 2% of global FX turnover, and the MAS actively manages the currency to avoid excessive volatility.
This means that while the long-term trend favors SGD appreciation, traders betting on a rapid sprint to parity may be left waiting.
In my view, the SGD is one of the most underappreciated macro trades in FX.
USD/JPY(20250729)Today's AnalysisMarket news:
After gold prices soared to an all-time high of more than $3,500 an ounce in April, the latest report from the Commodity Futures Trading Commission (CFTC) showed that fund managers have increased their bullish bets to the highest level in 16 weeks.
Technical analysis:
Today's buy and sell boundaries:
148.19
Support and resistance levels:
149.23
148.84
148.59
147.78
147.53
147.14
Trading strategy:
If the price breaks through 148.59, consider buying, the first target price is 148.84
If the price breaks through 148.19, consider selling, the first target price is 147.78

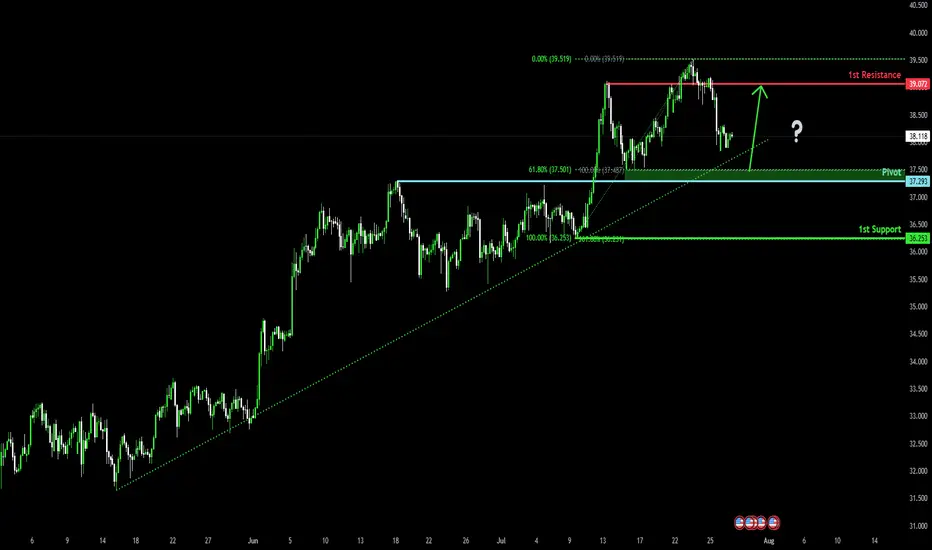
Falling towards pullback support?The Silver (XAG/USD) is falling towards the pivot, which is a pullback support and could rise to the 1st resistance.
Pivot: 37.29
1st Support: 36.25
1st Resistance: 39.07
Risk Warning:
Trading Forex and CFDs carries a high level of risk to your capital and you should only trade with money you can afford to lose. Trading Forex and CFDs may not be suitable for all investors, so please ensure that you fully understand the risks involved and seek independent advice if necessary.
Disclaimer:
The above opinions given constitute general market commentary, and do not constitute the opinion or advice of IC Markets or any form of personal or investment advice.
Any opinions, news, research, analyses, prices, other information, or links to third-party sites contained on this website are provided on an "as-is" basis, are intended only to be informative, is not an advice nor a recommendation, nor research, or a record of our trading prices, or an offer of, or solicitation for a transaction in any financial instrument and thus should not be treated as such. The information provided does not involve any specific investment objectives, financial situation and needs of any specific person who may receive it. Please be aware, that past performance is not a reliable indicator of future performance and/or results. Past Performance or Forward-looking scenarios based upon the reasonable beliefs of the third-party provider are not a guarantee of future performance. Actual results may differ materially from those anticipated in forward-looking or past performance statements. IC Markets makes no representation or warranty and assumes no liability as to the accuracy or completeness of the information provided, nor any loss arising from any investment based on a recommendation, forecast or any information supplied by any third-party.
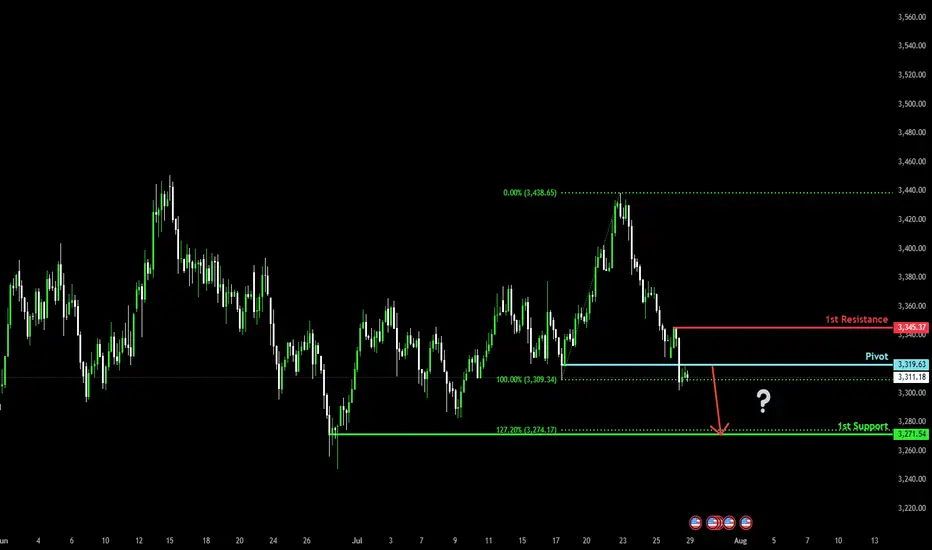
Bearish drop for the Gold?The price is reacting off the pivot and could drop to the 1st support, which is a swing low support that aligns with the 127.2% Fibonacci extension.
Pivot: 3,319.63
1st Support: 3,271.54
1st Resistance: 3,345.37
Risk Warning:
Trading Forex and CFDs carries a high level of risk to your capital and you should only trade with money you can afford to lose. Trading Forex and CFDs may not be suitable for all investors, so please ensure that you fully understand the risks involved and seek independent advice if necessary.
Disclaimer:
The above opinions given constitute general market commentary, and do not constitute the opinion or advice of IC Markets or any form of personal or investment advice.
Any opinions, news, research, analyses, prices, other information, or links to third-party sites contained on this website are provided on an "as-is" basis, are intended only to be informative, is not an advice nor a recommendation, nor research, or a record of our trading prices, or an offer of, or solicitation for a transaction in any financial instrument and thus should not be treated as such. The information provided does not involve any specific investment objectives, financial situation and needs of any specific person who may receive it. Please be aware, that past performance is not a reliable indicator of future performance and/or results. Past Performance or Forward-looking scenarios based upon the reasonable beliefs of the third-party provider are not a guarantee of future performance. Actual results may differ materially from those anticipated in forward-looking or past performance statements. IC Markets makes no representation or warranty and assumes no liability as to the accuracy or completeness of the information provided, nor any loss arising from any investment based on a recommendation, forecast or any information supplied by any third-party.
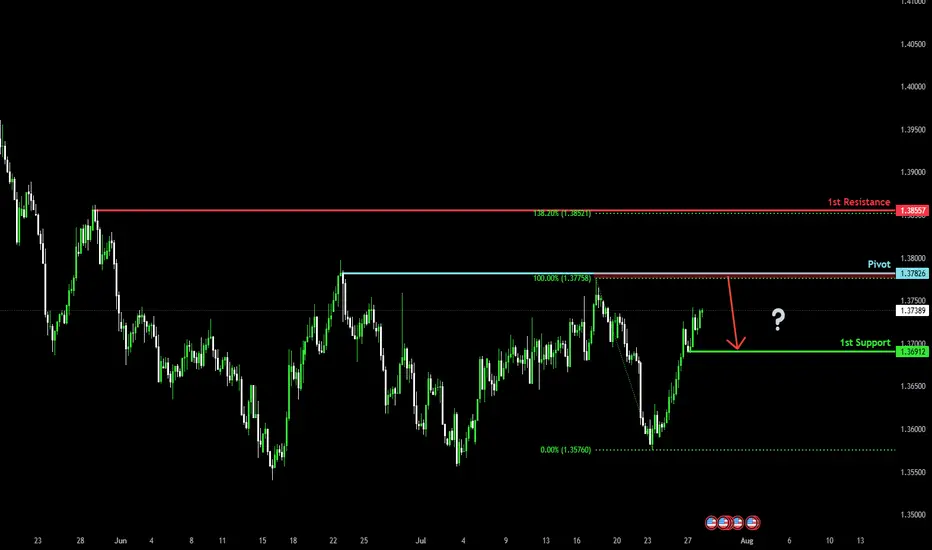
Heading into multi swing high resistance?The Loonie (USD/CAD) is rising towards the pivot, which has been identified as a swing high resistance and could reverse to the pullback support.
Pivot: 1.3782
1st Support: 1.3691
1st Resistance: 1.3855
Risk Warning:
Trading Forex and CFDs carries a high level of risk to your capital and you should only trade with money you can afford to lose. Trading Forex and CFDs may not be suitable for all investors, so please ensure that you fully understand the risks involved and seek independent advice if necessary.
Disclaimer:
The above opinions given constitute general market commentary, and do not constitute the opinion or advice of IC Markets or any form of personal or investment advice.
Any opinions, news, research, analyses, prices, other information, or links to third-party sites contained on this website are provided on an "as-is" basis, are intended only to be informative, is not an advice nor a recommendation, nor research, or a record of our trading prices, or an offer of, or solicitation for a transaction in any financial instrument and thus should not be treated as such. The information provided does not involve any specific investment objectives, financial situation and needs of any specific person who may receive it. Please be aware, that past performance is not a reliable indicator of future performance and/or results. Past Performance or Forward-looking scenarios based upon the reasonable beliefs of the third-party provider are not a guarantee of future performance. Actual results may differ materially from those anticipated in forward-looking or past performance statements. IC Markets makes no representation or warranty and assumes no liability as to the accuracy or completeness of the information provided, nor any loss arising from any investment based on a recommendation, forecast or any information supplied by any third-party.
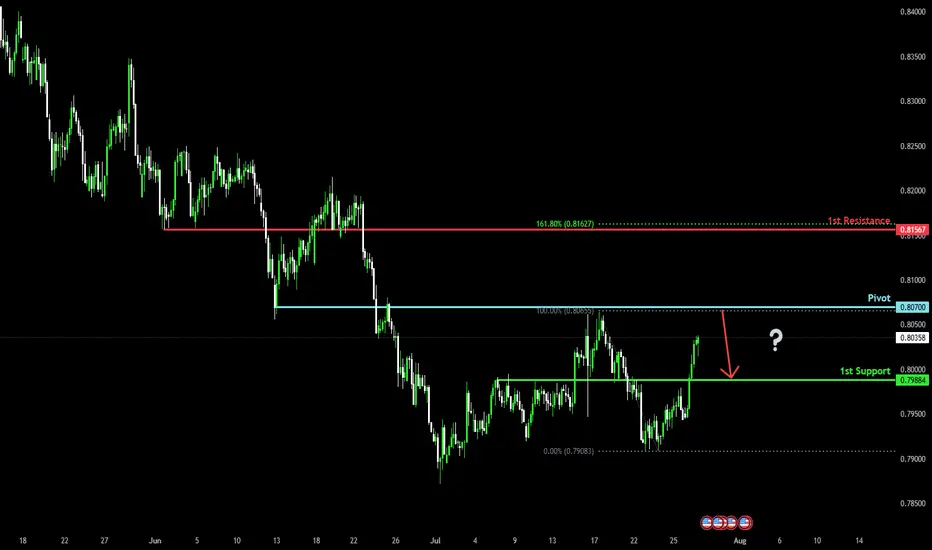
Bearish reversal?The Swissie (USD/CHF) is rising towards the pivot, which acts as an overlap resistance and could reverse to the 1st support.
Pivot: 0.8070
1st Support: 0.7988
1st Resistance: 0.8156
Risk Warning:
Trading Forex and CFDs carries a high level of risk to your capital and you should only trade with money you can afford to lose. Trading Forex and CFDs may not be suitable for all investors, so please ensure that you fully understand the risks involved and seek independent advice if necessary.
Disclaimer:
The above opinions given constitute general market commentary, and do not constitute the opinion or advice of IC Markets or any form of personal or investment advice.
Any opinions, news, research, analyses, prices, other information, or links to third-party sites contained on this website are provided on an "as-is" basis, are intended only to be informative, is not an advice nor a recommendation, nor research, or a record of our trading prices, or an offer of, or solicitation for a transaction in any financial instrument and thus should not be treated as such. The information provided does not involve any specific investment objectives, financial situation and needs of any specific person who may receive it. Please be aware, that past performance is not a reliable indicator of future performance and/or results. Past Performance or Forward-looking scenarios based upon the reasonable beliefs of the third-party provider are not a guarantee of future performance. Actual results may differ materially from those anticipated in forward-looking or past performance statements. IC Markets makes no representation or warranty and assumes no liability as to the accuracy or completeness of the information provided, nor any loss arising from any investment based on a recommendation, forecast or any information supplied by any third-party.
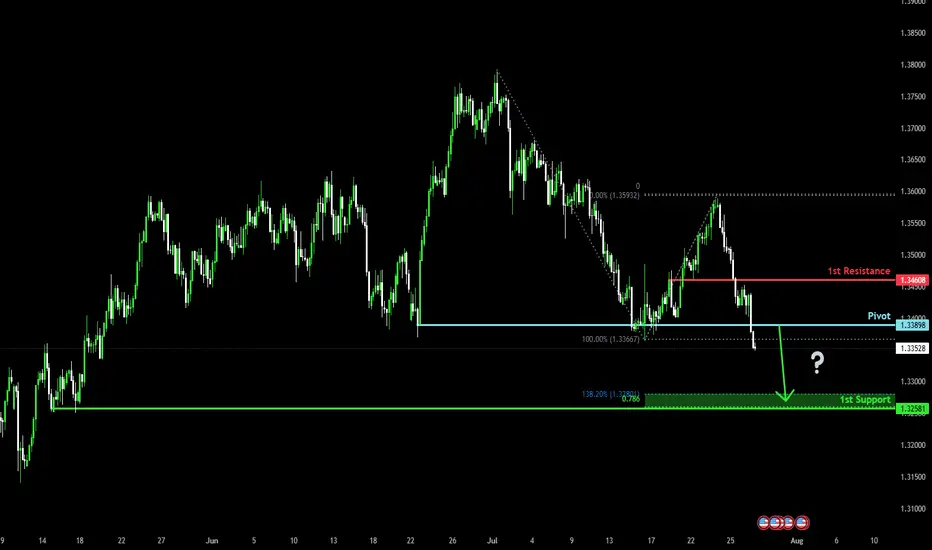
Potential bearish drop?The Cable (GBP/USD) has broken below the support level, which is a multi-swing low support. A potential pullback to the pivot, followed by a rejection, could lead the price to drop to the 1st support.
Pivot: 1.3389
1st Support: 1.3258
1st Resistance: 1.3460
Risk Warning:
Trading Forex and CFDs carries a high level of risk to your capital and you should only trade with money you can afford to lose. Trading Forex and CFDs may not be suitable for all investors, so please ensure that you fully understand the risks involved and seek independent advice if necessary.
Disclaimer:
The above opinions given constitute general market commentary, and do not constitute the opinion or advice of IC Markets or any form of personal or investment advice.
Any opinions, news, research, analyses, prices, other information, or links to third-party sites contained on this website are provided on an "as-is" basis, are intended only to be informative, is not an advice nor a recommendation, nor research, or a record of our trading prices, or an offer of, or solicitation for a transaction in any financial instrument and thus should not be treated as such. The information provided does not involve any specific investment objectives, financial situation and needs of any specific person who may receive it. Please be aware, that past performance is not a reliable indicator of future performance and/or results. Past Performance or Forward-looking scenarios based upon the reasonable beliefs of the third-party provider are not a guarantee of future performance. Actual results may differ materially from those anticipated in forward-looking or past performance statements. IC Markets makes no representation or warranty and assumes no liability as to the accuracy or completeness of the information provided, nor any loss arising from any investment based on a recommendation, forecast or any information supplied by any third-party.
Bullish bounce off pullback support?The Fiber (EUR/USD) is falling towards the pivot, which is a pullback support and could bounce to the 1st resistance.
Pivot: 1.1537
1st Support: 1.1456
1st Resistance: 1.1655
Risk Warning:
Trading Forex and CFDs carries a high level of risk to your capital and you should only trade with money you can afford to lose. Trading Forex and CFDs may not be suitable for all investors, so please ensure that you fully understand the risks involved and seek independent advice if necessary.
Disclaimer:
The above opinions given constitute general market commentary, and do not constitute the opinion or advice of IC Markets or any form of personal or investment advice.
Any opinions, news, research, analyses, prices, other information, or links to third-party sites contained on this website are provided on an "as-is" basis, are intended only to be informative, is not an advice nor a recommendation, nor research, or a record of our trading prices, or an offer of, or solicitation for a transaction in any financial instrument and thus should not be treated as such. The information provided does not involve any specific investment objectives, financial situation and needs of any specific person who may receive it. Please be aware, that past performance is not a reliable indicator of future performance and/or results. Past Performance or Forward-looking scenarios based upon the reasonable beliefs of the third-party provider are not a guarantee of future performance. Actual results may differ materially from those anticipated in forward-looking or past performance statements. IC Markets makes no representation or warranty and assumes no liability as to the accuracy or completeness of the information provided, nor any loss arising from any investment based on a recommendation, forecast or any information supplied by any third-party.

Bullish bounce off swing low support?The Bitcoin (BTC/USD) is falling towards the pivot and could bounce to the 1st resistance.
Pivot: 115,415.51
1st Support: 113,466.96
1st Resistance: 120,573.43
Risk Warning:
Trading Forex and CFDs carries a high level of risk to your capital and you should only trade with money you can afford to lose. Trading Forex and CFDs may not be suitable for all investors, so please ensure that you fully understand the risks involved and seek independent advice if necessary.
Disclaimer:
The above opinions given constitute general market commentary, and do not constitute the opinion or advice of IC Markets or any form of personal or investment advice.
Any opinions, news, research, analyses, prices, other information, or links to third-party sites contained on this website are provided on an "as-is" basis, are intended only to be informative, is not an advice nor a recommendation, nor research, or a record of our trading prices, or an offer of, or solicitation for a transaction in any financial instrument and thus should not be treated as such. The information provided does not involve any specific investment objectives, financial situation and needs of any specific person who may receive it. Please be aware, that past performance is not a reliable indicator of future performance and/or results. Past Performance or Forward-looking scenarios based upon the reasonable beliefs of the third-party provider are not a guarantee of future performance. Actual results may differ materially from those anticipated in forward-looking or past performance statements. IC Markets makes no representation or warranty and assumes no liability as to the accuracy or completeness of the information provided, nor any loss arising from any investment based on a recommendation, forecast or any information supplied by any third-party.

BUY TRADE SETUP ON XAGUSDCheck this buy trade setup i got on SILVER.
Anticipate a retest of the demands zone at 37.45 zone and plan for a buy entry there.
A Swing Trade Plan.
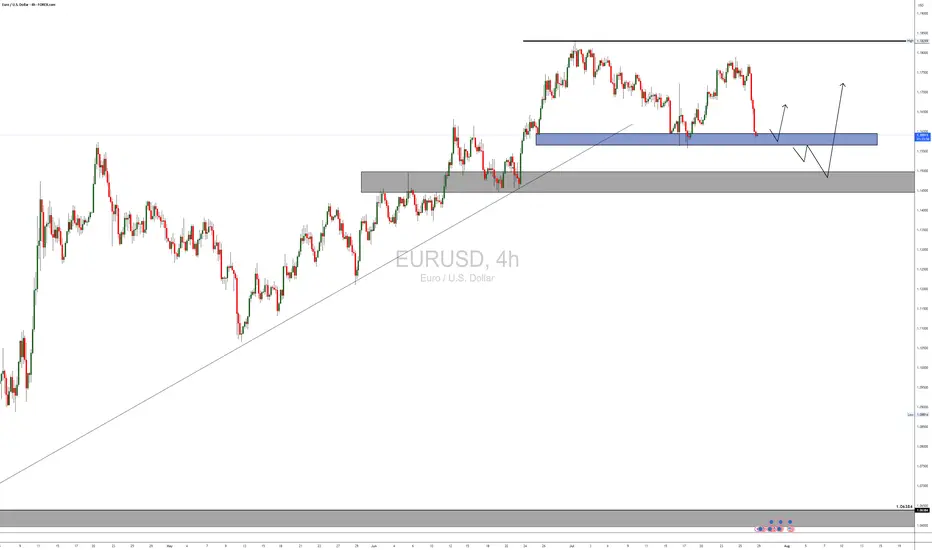
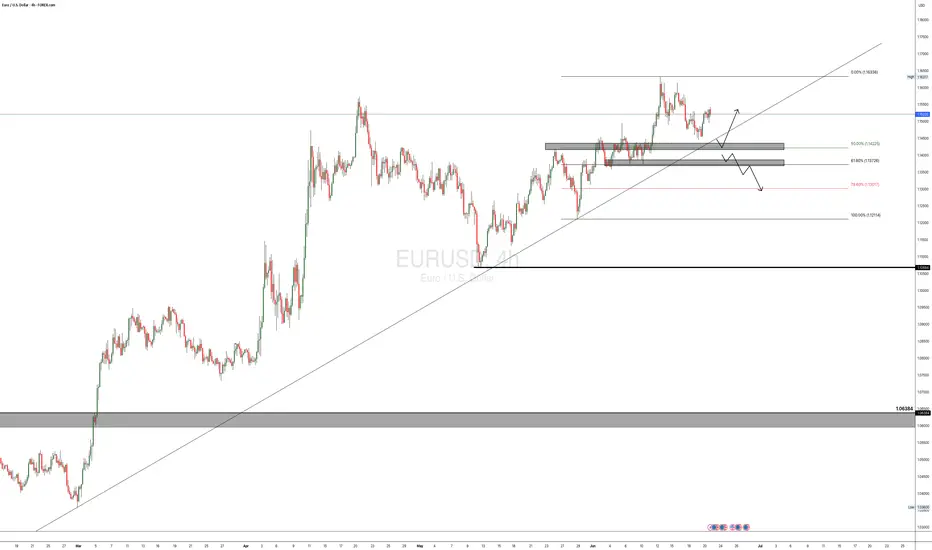
EURUSD POSSIBLE TRADE SETUP💶 Potential Trade Setup on EURUSD
Overview:
Since March, EURUSD has shown consistent bullish momentum, especially after breaking through the key 1.0600 supply zone.
The pair has maintained higher highs and higher lows, suggesting continued strength in the medium term.
That said, I am still quite anticipating for a possible continuation of the bullish momentum that started a long time ago, and moving forward, I will anticipate for a clear retest of the 50% fib at the 1.1425 region, then I go in for the kill.
Alternatively, there is a clear short opportunity, provided that, the bullish trendline is broken and the 1.1370 region is broken to the downside, this is a bit far a stretch, but it is in play. "IF" the DXY keeps the bullish momentum going.
🧭 Trading Plan:
✅ BUY Bias (Primary Plan):
Look for a retest of the 50% Fibonacci retracement zone around 1.1425. This aligns with the ongoing momentum on the 4H timeframe.
🔻 SELL Bias (Alternative Scenario):
If price breaks the bullish trendline and the 1.1370 support zone, a short opportunity opens up.
This is only valid if DXY continues to strengthen, shifting sentiment.
🎯 Targets & Risk Management: Targeting 1:2 R:R on both setups.
Ensure entries are backed by price action signals and confluences.
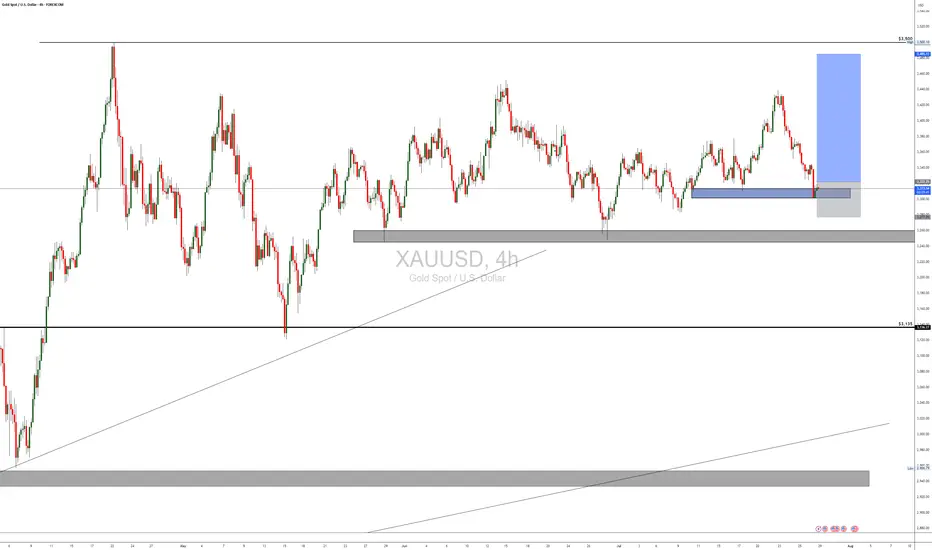
BUY TRADE SETUP ON XAUUSDA Quick Trade setup on Gold for Gold traders who are crazy about Gold!
Swing Trade.
Check it out!
EURUSD Will the 1D MA50 hold?The EURUSD pair has been trading within a Channel Up pattern since the April 21 2025 High. The price is right now on a strong pull-back and is about to test the 1D MA50 (blue trend-line) for the first time since May 12.
As long as the 1D candle closes above the 1D MA50, it will be a buy signal, targeting 1.19250 (a standard +3.20% rise).
If the candle closes below the 1D MA50, the buy will be invalidated and we will switch to a sell, targeting the 1D MA100 (green trend-line) at 1.14100.
-------------------------------------------------------------------------------
** Please LIKE 👍, FOLLOW ✅, SHARE 🙌 and COMMENT ✍ if you enjoy this idea! Also share your ideas and charts in the comments section below! This is best way to keep it relevant, support us, keep the content here free and allow the idea to reach as many people as possible. **
-------------------------------------------------------------------------------
Disclosure: I am part of Trade Nation's Influencer program and receive a monthly fee for using their TradingView charts in my analysis.
💸💸💸💸💸💸
👇 👇 👇 👇 👇 👇

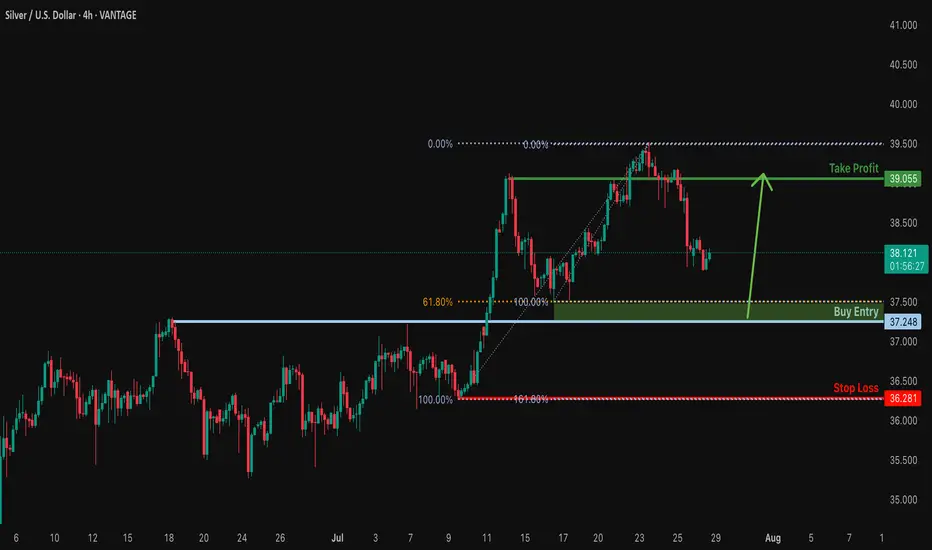
Bullish bounce for the Silver?The price is falling towards the support level whch i anoverlap support that is slighly below the 61.8%Fibonacci retraecment and could bounce from this level to our takeprofit.
Entry: 37.24
Why we like it:
There is an overlap support that is slightly below the 61.8% Fibonacci retracement.
Stop loss: 36.28
Why we like it:
There is a swing low support that aligns with the 161.8% Fibonacci extension.
Take profit: 39.05
Why we like it:
There is a pullback resistance.
Enjoying your TradingView experience? Review us!
Please be advised that the information presented on TradingView is provided to Vantage (‘Vantage Global Limited’, ‘we’) by a third-party provider (‘Everest Fortune Group’). Please be reminded that you are solely responsible for the trading decisions on your account. There is a very high degree of risk involved in trading. Any information and/or content is intended entirely for research, educational and informational purposes only and does not constitute investment or consultation advice or investment strategy. The information is not tailored to the investment needs of any specific person and therefore does not involve a consideration of any of the investment objectives, financial situation or needs of any viewer that may receive it. Kindly also note that past performance is not a reliable indicator of future results. Actual results may differ materially from those anticipated in forward-looking or past performance statements. We assume no liability as to the accuracy or completeness of any of the information and/or content provided herein and the Company cannot be held responsible for any omission, mistake nor for any loss or damage including without limitation to any loss of profit which may arise from reliance on any information supplied by Everest Fortune Group.
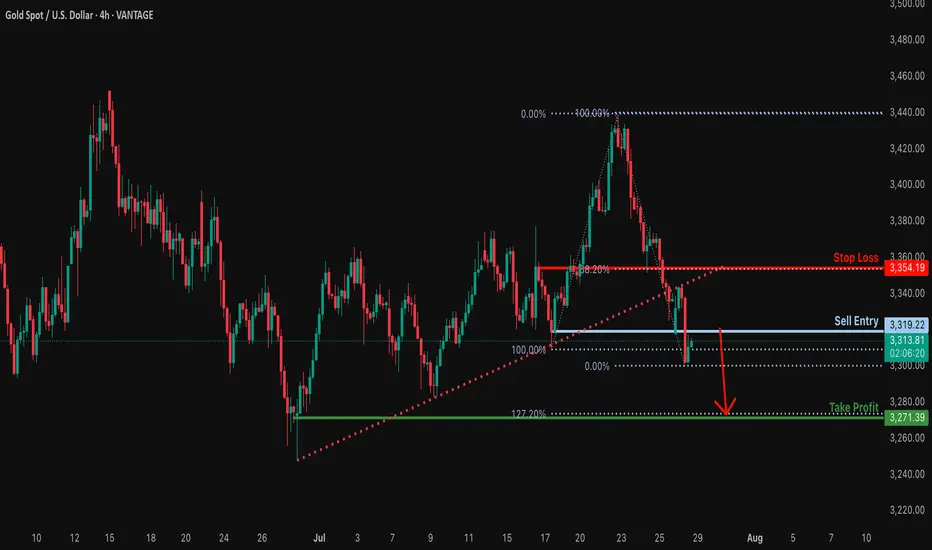
Bearish reversal?XAU/USD is rising towards the resistance level, which serves as a pullback resistance and could drop from this level to our take-profit target.
Entry: 3,319.22
Why we like it:
There is a pullback resistance.
Stop loss: 3,354.19
Why we like it:
There is a pullback resistance that aligns with the 38.2% Fibonacci retracement.
Take profit: 3,271.39
Why we like it:
There is a swing low support that lines up with the 127.2% Fibonacci extension.
Enjoying your TradingView experience? Review us!
Please be advised that the information presented on TradingView is provided to Vantage (‘Vantage Global Limited’, ‘we’) by a third-party provider (‘Everest Fortune Group’). Please be reminded that you are solely responsible for the trading decisions on your account. There is a very high degree of risk involved in trading. Any information and/or content is intended entirely for research, educational and informational purposes only and does not constitute investment or consultation advice or investment strategy. The information is not tailored to the investment needs of any specific person and therefore does not involve a consideration of any of the investment objectives, financial situation or needs of any viewer that may receive it. Kindly also note that past performance is not a reliable indicator of future results. Actual results may differ materially from those anticipated in forward-looking or past performance statements. We assume no liability as to the accuracy or completeness of any of the information and/or content provided herein and the Company cannot be held responsible for any omission, mistake nor for any loss or damage including without limitation to any loss of profit which may arise from reliance on any information supplied by Everest Fortune Group.
EURUSD Potential UpsidesHey Traders, in today's trading session we are monitoring EURUSD for a buying opportunity around 1.16 zone, EURUSD is trading in an uptrend and currently is in a correction phase in which it is approaching the trend at 1.16 support and resistance area.
Trade safe, Joe.

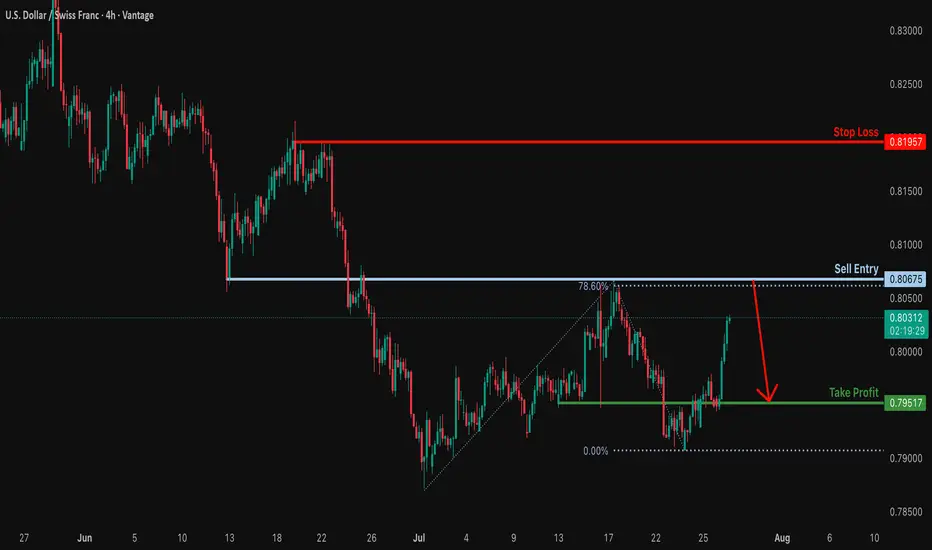
Heading into overlap resistance?The USD/CHF is rising towards the resistance level, which is an overlap resistance that aligns with the 78.6% Fibonacci projection and could potentially reverse from this level to our take-profit.
Entry: 0.8067
Why we like it:
There is an overlap resistance that aligns with the 78.6% Fibonacci projection.
Stop loss: 0.8195
Why we like it:
There is a swing high resistance.
Take profit: 0.7951
Why we like it:
There is a pullback support.
Enjoying your TradingView experience? Review us!
Please be advised that the information presented on TradingView is provided to Vantage (‘Vantage Global Limited’, ‘we’) by a third-party provider (‘Everest Fortune Group’). Please be reminded that you are solely responsible for the trading decisions on your account. There is a very high degree of risk involved in trading. Any information and/or content is intended entirely for research, educational and informational purposes only and does not constitute investment or consultation advice or investment strategy. The information is not tailored to the investment needs of any specific person and therefore does not involve a consideration of any of the investment objectives, financial situation or needs of any viewer that may receive it. Kindly also note that past performance is not a reliable indicator of future results. Actual results may differ materially from those anticipated in forward-looking or past performance statements. We assume no liability as to the accuracy or completeness of any of the information and/or content provided herein and the Company cannot be held responsible for any omission, mistake nor for any loss or damage including without limitation to any loss of profit which may arise from reliance on any information supplied by Everest Fortune Group.
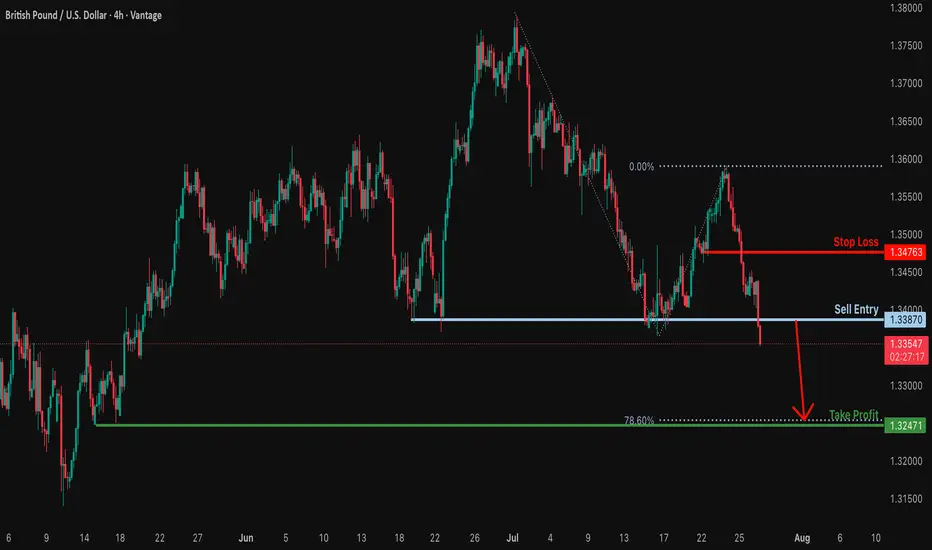
Potential bearish drop?GBP/USD has reacted off the support level which is a multi swing low support and could drop from this levle to our take profit.
Entry: 1.3387
Why we like it:
There is a multi swing low support.
Stop loss: 1.3476
Why we like it:
There is a pullback resistance.
Take profit: 1.3247
Why we like it:
There is a multi swing low support that aligns with the 78.6% Fibonacci projection.
Enjoying your TradingView experience? Review us!
Please be advised that the information presented on TradingView is provided to Vantage (‘Vantage Global Limited’, ‘we’) by a third-party provider (‘Everest Fortune Group’). Please be reminded that you are solely responsible for the trading decisions on your account. There is a very high degree of risk involved in trading. Any information and/or content is intended entirely for research, educational and informational purposes only and does not constitute investment or consultation advice or investment strategy. The information is not tailored to the investment needs of any specific person and therefore does not involve a consideration of any of the investment objectives, financial situation or needs of any viewer that may receive it. Kindly also note that past performance is not a reliable indicator of future results. Actual results may differ materially from those anticipated in forward-looking or past performance statements. We assume no liability as to the accuracy or completeness of any of the information and/or content provided herein and the Company cannot be held responsible for any omission, mistake nor for any loss or damage including without limitation to any loss of profit which may arise from reliance on any information supplied by Everest Fortune Group.
Potentially, A Safer Way To Long The EURUSDIn contrast to my previous outlook, the current price action suggests an increased probability of a deeper bearish move—potentially invalidating the buy zone marked out in the previous analysis. This sudden change is largely driven by the prospect of untapped liquidity residing beneath that zone, reinforcing the well-known market principle that price seeks out liquidity before committing to directional moves.
Given this development, the newly identified zone on the chart emerges as a more technically sound and reliable area from which to anticipate bullish interest. It aligns better with the broader liquidity profile and offers a stronger base for accumulation. Traders may opt to wait for confirmations within this zone or, depending on their risk appetite, consider executing buy positions upon price entry.
As always, patience and clarity are key as we allow price to reveal its intention.
Fingers crossed 🤞
Wishing you all a focused and profitable trading week.
Catch you on the next one. 🫡

GOLD - SHORT TO $2,880 (UPDATE)Gold 'Sell Trade' running 1,130 PIPS in profit to start the week. I hope you are all taking advantage of this free analysis & profiting from Gold's downside. Amazing move to start the new week, with much more downside expected.
Drop me a message @XTBCAP for Account Management & Investment opportunities✅
