Usdcad1hr

USDCAD Long (Another Trade confirmation)Another confirmation to go long, nice levels
Disclaimer:
This does not represent a trade signal, or constitute any form of Investment advice. but rather my ideas on how i view the markets, I am not responsible for any losses or gains made from this. Please use your own discretion

USDCAD BUYGoing Long on Point B(1.3055) , or better yet for double confirmation go long on 1.29489 Both are excellent places for longs. The Monthly uptrend is still intact . SL @ 1.29215 Targeting point C.
Crude Oil is in a declining state and Gold and Silver will follow BRENT as well.
USDCAD Long
Disclaimer:
This does not represent a trade signal, or constitute any form of Investment advice. but rather my ideas on how i view the markets, I am not responsible for any losses or gains made from this. Please use your own discretion

Long USDCAD : Counter-trend ABCD Pattern As we can understand from the above chart USDCAD is moving down towards our support region.
And the exact support region marks the completion of ABCD pattern, it depends on individual to decide where to enter the trade based on ratio's. Thats why marked it as Entry zone instead of particular price level in USDCAD.
Even if you enter around the same levels which I have marked, you will be getting risk:reward around 1.5 which is good for countertrend trade opportunities. Lets decide where our orders go in entry zone for USDCAD & put some orders & let's wait till it gets filled.
Hit Likes if you agree...
Thanks for your Support... Happy Trading !


USDCADUSDCAD has had a great short run today and possibly more, currently in a downtrend channel from 2 hours ago


USDCAD : tea time waitingMy first forex is GBPJPY, but, it is going up and i miss it..
So during waiting GJ. I am scout new forex and found this USDCAD.
Maybe it will make the 1-2nd wave and going up to 3rd wave.
My plan:
IF it not Lower low than 1.26253, I am waiting to break Trend line and BUY.
After break 1.275, I will put another BUY.
Plan B:
If it going down , Let it be....

Forex Market Analysis And Trading Tips - USDCAD 15th Feb 2016RECOMMENDATION: SELL
SUMMARY:
The secondary trend of USD/CAD is bearish on charts and price is trading below the trend line in its daily chart. In daily chart the price is sustaining above 200 day SMA and taking resistance of 50 day SMA indicating downtrend of the pair. It is having an important resistance at the level of 1.4100 and support at the level of 1.3640. If it breaks its support level on the downside and sustains below it then we can expect it to show further bearish movement in the pair.
INDICATORS:-
MACD is sustaining in its negative territory indicating the bearish trend in the pair.
RSI is sustaining in its selling zone indicating the upcoming bearish trend in the pair.
STRATEGY:
USD/CAD is looking bearish on charts for next few trading session. One can go for sell on higher level strategy for this pair for intra day to mid term positions in it.
All the best and happy trading!
www.tradingsignalreviews.com

USD/CAD bombed out this year, until now - how 2 trade next1.41022 USD/CAD: 3.Target (2576 Chance)
1.40162 USD/CAD: 2.Target (1716 Chance)
1.39771 USD/CAD: 1.Target (1325 Chance)
1.38446 USD/CAD: last Price
1.36369 USD/CAD: last Support (2077 Risk)
You can use the support levels as stop-loss price level.
And alle 3 targets also even as take profit price leves too, if you want.
But take care! Think about it - and create your own opinion! It`s your own decision...
C/R Ratios are 0.64 C/R Ratio (1st), 0.83 C/R Ratio (2nd) & 1.24 C/R Ratio (3rd)
Change/Risk Ratio = 1.Target/Support, 2.Target/Support & 3.Target/Support
Best regards!
Aaron

Forex Market Analysis and Trading Tips - USDCADSUMMARY:
The secondary trend of USD/CAD is bullish on charts and price is trading above the trend line in its 4 hourly chart. In 4 hourly chart the price is sustaining below 200 day SMA and taking support of 50 day SMA indicating uptrend of the pair. It is having an important resistance at the level of 1.3997 and support at the level of 1.3883. If it breaks its resistance level on the upside and sustains above it then we can expect it to show further bullish movement in the pair.
INDICATORS:-
MACD is sustaining in its positive territory indicating the bullish trend in the pair.
RSI is sustaining in its buying zone indicating the upcoming bullish trend in the pair.
STRATEGY:
USD/CAD is looking bullish on charts for next few trading session. One can go for buy on lower level strategy for this pair for intra day to mid term positions in it.
www.tradingsignalreviews.com

Forex Market Analysis and Trading Tips 9th Feb 2016
SUMMARY:
The secondary trend of USD/CAD is bullish on charts and price is trading below the trend line in its hourly chart. In hourly chart the price is sustaining above 50 day SMA and taking support of 200 day SMA indicating uptrend of the pair. It is having an important resistance at the level of 1.3980 and support at the level of 1.3840. If it breaks its resistance level on the upside and sustains above it then we can expect it to show further bullish movement in the pair.
INDICATORS:-
MACD is sustaining in its positive territory indicating the bullish trend in the pair.
RSI is sustaining in its buying zone indicating the upcoming bullish trend in the pair.
STRATEGY:
USD/CAD is looking bullish on charts for next few trading session. One can go for buy on lower level strategy for this pair for intra day to mid term positions in it.
www.tradingsignalreviews.com


USDCAD (6C) - GLOBAL FORECAST!Hello Traders!
Suggest you, take a look at the USDCAD (6C) currency pair, in terms of the Elliotte Waves, Fibonacci, Market Profile, Volume, Cluster&Delta analysis! We hope that our modest work, will help many traders in the World to find the way of truth in future market prices! (We are sure, that you can predict better, than this one)
Have a Nice Trades & Happy New Year!
Best regards, Powerful Traders!

USDCAD wave analysis - 1H view on the current wave structure Here's a bit of a drill down to the 1H to analyze the current market structure.
USDCAD trade analysis on the daily chart
Wait for for C wave of minor degree completion to go for a possible short, what could be a possible 3rd wave of a 5 wave sequence down.

Short USDCAD – sell at role reversal lineTrading idea on 1h chart:
Short USDCAD – sell at role reversal line
After an impressive run USDCAD seems to be exhausted and needs at least a larger consolidation.
-price broke under support line at 1.2670, which now is resistance (= role reversal) AND
-price on 4h chart is under 20EMA, so for me on that time frame it is not more in an uptrend
Often the price action is to run up towards the last support to test it as a new resistance.
Here that area also aligns with the Fib 50%-Retracement and there is where I would like to short.
_______________________________
Trading idea: limit sell order at 1.2670, Risk-Reward = 3.0
SL@ 1.2720 (-50), TP@ 1.2520 (+150)
_______________________________
Things to remember:
1. Important data for CAD on Wednesday and Thursday (higher volatility possible).
2. Friday is USD Non-Farm Employment Change and CAD Employment Change, so will not trade 1 hour before until 30 minutes after the data, as the volatility could be huge.
3. If price fall below 1.2510 the idea will be not valid anymore and I would not enter this trade
Disclaimer: There is a very high degree of risk involved in trading forex. I assume no responsibility or liability for any trading or investment results. My posted statements and charts may unintentionally include inaccuracies. All content posted is for educational purposes only and is not a financial advice. The presented set-ups are not solicitations of any order to buy or sell.

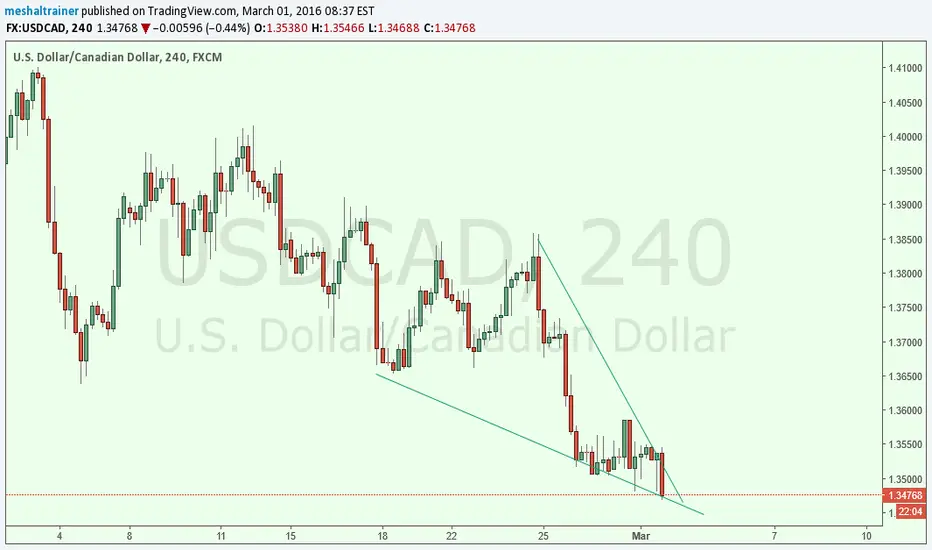
USDCAD VERY BEAUTIFUL SETUP :)THIS IS VERY SIMILAR TO MY RECENT EURUSD TRADE SETUP. NICE DEFINE STOP, WITH CLEAR TARGET AT THE TOP WHERE STRUCTURE HAS FAILED TO BREAK THROUGH TWICE. I'M MORE CONFIDENT OF THIS PAIR BREAKING STRUCTURE AFTER A SHORT PULLBACK BECAUSE OF THE PREVIOUS PRICE ACTION. WE HAD 3 LOWER LOWS (LL) AND NOW A HIGHER HIGH (HH). EVEN WITH THE LOWER LOWS, THE STRENGTH OF THE BULLS WERE PHENOMENAL, KEEPING THE BEARS ABOVE OUR NOW ENTRY LEVEL DENOTED BY THE RED RECTANGLE. I BELIEVE ANY MOVE UPWARD WILL BE A STRONG MOVE. SO IT IS NOT IMPOSSIBLE FOR US TO SEE 1.348 FOR A NEW HIGHER HIGH.
AS ALWAYS, TELL ME WHAT YOU THINK JUST IN CASE I MIGHT HAVE MISSED OUT ON SOMETHING.
HAVE A SUCCESSFUL DAY! CHEERS!

USDCAD SHORT TERM MOVEMENTLIKE MOST OF THE PAIRS, I'M LOOKING FOR THIS TO FALL A BIT AND RISE, HOPEFULLY IF I GET SIGNALS I CAN GET ALL 3 MOVES. I'LL HAVE TO DETERMINE THE THIRD MOVE AFTER.
FOLLOW UPS IN COMMENT!
