USD/CAD SHORT from 1.3725My positions SHORT EUR/USD and GBP/USD have been closed as its evident that SELLERS are now pushing the USD south.
With that in mind, I'mnow SHORT USD/CAD.
I was looking for this pair to reach the WR1 weekly pivot at 1.3744 but it now looks like this was a level too far and price has reversed 9 pips short of that target.
RSI on H1 has been over 70 for several hours and in the last 2 hours we've seen it fall to its current level of 55.
MACD has crossed south on H1 and the Andean Oscillator red SELL line has lifted away fro zero and is now reading .0005.
All the signs are that we are headed lower and hopefully I can get a decent + pip STOP on this trade before key news is released at 13:30 this being Prelim GDP and Unemployment Claims followed by Pending Home Sales 90 mionutes later.
If these number come out green then the USD will rise and this trade will exit for a profit but if the numbers come out red then this trade will accelerate to the downside and may reach the main target which is 1.3660 where there is a band of support.
The overall structure of USD/CAD remains BULLISH whilst we remain above 1.3660.
Should 1.3660 break then 1.3600 wil come into play.
Usdcadanalysis

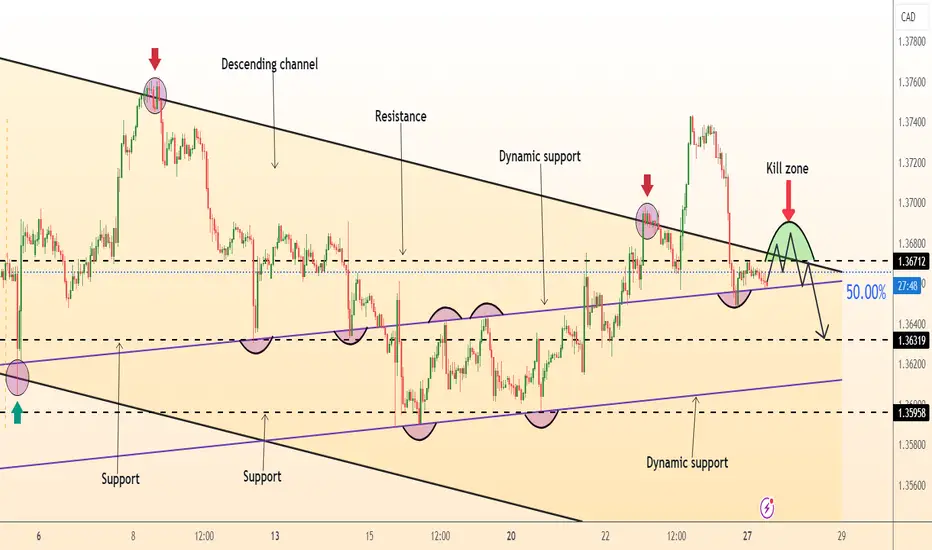
DeGRAM | USDCAD decline from the border in the channelUSDCAD is moving above the trend line in a descending channel.
After a false breakout of the upper boundary, the price has returned to the channel.
The chart is holding under the 50% retracement level of the last bullish impulse.
We expect a decline in the channel after a retest of resistance.
-------------------
Share your opinion in the comments and support the idea with like. Thanks for your support!
USD/CAD SHORT from 1.3660USD/CAD has been declining since last week and shows not sign of finding support.
The Andean Oscillator on the H1 time frame turned BEARISH towards the end of last week and with no obvious levels of support we can expect to see the price of USD/CAD drift lower to 1.3588 area where BUYERS may well lie.
A look at the H4 time frame is revealing.
All 4 EMA's (25/50/100/200) are grouped together and the price is now below this group.
This means that USD/CAD BULLS would have to push through all these EMA's to head north and this seems unlikely in the absence of key drivers.
THe only news on the horizon comes at 15:00 tomorrow with the CB Consumer Confidence which is not generally a big move so if this print disappoints then we can expect to see USD/CAD decline at a faster rate.
The D1 time frame suggests we could be headed for the 200 EMA at 1.3570.
If this key level breaks then there's nothing to stop USD/CAD heading much lower but any significant CAD or USD news would set the agends for this pair.
With the Bank Holiday price action will be slow so I expect to see a gradual but steady decline with this pair.

USD/CAD Trend reset - Buy ContinuationMomentum preceeds prices!
The USDCAD has had a trend reset (Secondary Trend), which is key to the Up-trend continuation.
The structural point for trend reversal is 1.3656, we want to see a second breakdown below the structure without breaking below 1.3624. A trade back above 1.3656 will be the first buy, confirmation will be a trade above 1.3671.
In terms of Target, we will use the Fibonacci retracement from the low to the high of 3.
Target 1: 1.3780
Target 2: 1.3838
Initial Stop Loss: 1.3624

USDCAD moving lower this week**Monthly Chart**
USDCAD is moving within a large range between 1.30000 and 1.40000 level since Oct 2022 as per monthly chart range.
**Weekly Chart**
The pair is still moving within the range after creating a weekly key reversal around the relative equal highs. The obvious move is to downside at least to test demand zone around 1.32000 level.
**Daily Chart**
The expectation for this week is that USDCAD will push lower from previous swing high level. We need to see a pullback reaction before taking the price lower. Next target will be to break the previous swing low below 1.36000 level.

USDCAD Trading plan - 25/may/2024Hello Traders,
Hope you all are doing good!!
I expect USDCAD to go Up correctively.
Look for your BUY setups.
Please follow me and like if you agree or this idea helps you out in your trading plan.
Disclaimer: This is just an idea. Please do your own analysis before opening a position. Always use SL & proper risk management.
Market can evolve anytime, hence, always do your analysis and learn trade management before following any idea.

USDCAD - Long from bullish order block ✅Hello traders!
‼️ This is my perspective on USDCAD.
Technical analysis: Here we are in a bullish market structure from 4H timeframe perspective, so I look only for long position. I expect price to make a retracement to fill that huge imbalance and then to reject from bullish order block.
Like, comment and subscribe to be in touch with my content!

USDCAD : Short Trade , 4hHello traders, we want to check the USDCAD chart. The price is moving in a descending channel and has pulled back to the ceiling of the channel and the specified key level. We expect the price to maintain its downward trend and the price will fall to around 1.36000. Good luck.

USDCAD swing tradeHere is my analysis for USDCAD, It is creating Lower Low and Lower High in 4 hours Time Frame and it has hit resistance zone on daily Time Frame and started downward movement, i am expecting price to keep on going downward. This is a swing trade, expecting 1:21RR.

USDCAD Rally towards 1.3695We can see a clear price run for the upside in the USDCAD pair after running Sellstops. i am expecting price to reach above the retail resistane above 1.3690 level in the short term.
Entry is around @ current market price @ 1.3650 with a stoploss at 1.3620 with a ultimate of 1.3690+

USDCAD Bank Money Heist Plan To Become a Rich TraderMy Dear Robbers / Traders,
This is our master plan to Heist USDCAD Bank based on Thief Trading style Technical Analysis.. kindly please follow the plan I have mentioned in the chart. Our target is Red Zone that is High risk Dangerous Level, market is overbought / Consolidation / Trend Reversal at the level Bearish Robbers / Traders gain the strength. Be safe and be careful and Be rich.
Note: If you've got a lot of money you can get out right away otherwise you can join with a swing trade robbers and continue the heist plan,
Loot and escape on the target 🎯 Swing Traders Plz Book the partial sum of money Use Trailing Stop To Protect Looted Money and wait for next breakout of dynamic level / Order Block, Once it is cleared we can continue our heist plan to next new target it will update after the Breakouts.
support our robbery plan we can easily make money & take money 💰💵 Join your hands with US. Loot Everything in this market everyday.

USDCAD Top-down analysis Hello traders, this is a complete multiple timeframe analysis of this pair. We see could find significant trading opportunities as per analysis upon price action confirmation we may take this trade. Smash the like button if you find value in this analysis and drop a comment if you have any questions or let me know which pair to cover in my next analysis.

USD/CAD Buys Active. 1.36000 Swing Trade Bullish Continuation I am currently in a Buy position on USD/CAD looking for a bullish continuation.
1.36000 is a very strong area of resistance now turning support.
If you go to the monthly timeframe you can see that we are in a bullish market.

UsdcadWell!!! well!!! well!!!
My bias on usdcad is nothing other than a bullish scenario which you could see from the chart that it is😁
So let long cad to the moon

USDCAD BUY | Idea Trading AnalysisUSDCAD is trading along the rising support
And as the pair will soon retest it I am expecting the price to go up To retest the supply levels above at
Hello Traders, here is the full analysis.
Price reversal going up, levels for BUY. Great BUY opportunity USDCAD. ! GOOD LUCK!
I still did my best and this is the most likely count for me at the moment.
-------------------
Traders, if you liked this idea or if you have your own opinion about it, write in the comments. I will be glad 🤝

USDCHF DThe chart shows the price history of the US dollar (USD) against the Canadian dollar (CAD), also known as the USDCAD currency pair. The date at the top of the chart is May 15, 2014, but it is not clear if this is the date the chart was created or the date to which the data reflects.
Based on the limited information in the image, it appears that the chart might be showing a triangle pattern. A triangle pattern is a technical analysis chart pattern that forms when the price action creates a series of highs and lows that converge into a narrow range. There are different types of triangle patterns, but in general, they are seen as continuation patterns, meaning they suggest that the price is likely to break out of the triangle and continue its trend in the direction it was moving before the pattern formed.
However, it is important to note that technical analysis is not an exact science, and triangle patterns do not guarantee a particular outcome. Other factors, such as economic news and events, can also affect the price of a currency pair.
Here are some additional details about the chart that you can see in the image:
The y-axis shows the exchange rate between the USD and CAD. The scale is not shown in the image, but it appears that the exchange rate is around 1.36 CAD per 1 USD.
The x-axis shows the time period over which the chart is displaying data. Again, the specific time period is not shown in the image.

USDCAD - Bearish continuation ✅Hello traders!
‼️ This is my perspective on USDCAD.
Technical analysis: Here we are in a bearish market structure from 4H timeframe perspective, so I look for a short. I expect bearish price action to continue after price rejected from bearish order block + trendline. My target is imbalance lower.
Fundamental news: Tomorrow (GMT+3) we will see results of Unemployment Rate on CAD, news with high impact on currency.
Like, comment and subscribe to be in touch with my content!

USDCAD (Bearish idea)USDCAD appears to be going bearish at this time. Due to the 2 strong impulses and small correction. I will go short on this pair ONLY if the following criteria is met.
- Price returns to the previous level of support with candlestick confirmation
- Fibonacci levels enter the 61.8% zone.
*always remember to use proper RISK MAANGEMENT*

the price is trading below the Ichimoku cloud USDCAD SHORTThe sell zone seems solid as the price has been rejected multiple times in the past. I do notice that the price is trading below the Ichimoku cloud, which is a good sign of bearish momentum. Let's see how this plays out.
Potential Trade Opportunity:
Currency Pair: USDCAD
Position: long
Risk to Reward Ratio: 3R
Trade Parameters:
SellLimit:
Entry Point: 1.37301
Stop Loss: 1.37363
Take Profit: 1.37107
Disclaimer:
This trade signal is provided for informational purposes only and does not constitute financial advice. Trading in the forex market involves substantial risk, and past performance is not necessarily indicative of future results. The provided entry, stop loss, and take profit levels are based on analysis at the time of publication, but market conditions may change rapidly, leading to losses. Traders should conduct their own research and consider their risk tolerance before executing any trades. We do not guarantee the accuracy or completeness of the information provided, and we shall not be liable for any losses incurred in connection with this trade signal. It is recommended to consult with a qualified financial advisor before making any investment decisions.

USDCAD has hammered a base.After reaching a demand zone, this pair has hammered a base today (see the Daily chart).
We should get a small retrace (better price + smaller stop) and then move up to the trendline in the 1.38 region.
Being prepared for the unexpected is always good in trading, so please use sound money and risk management and stay patient in all your trades. If you like my content, please give it a “thumbs up” and follow me to get even more.
What do you think about this trade idea? Please comment and share your thoughts!!

Canada’s Ivey PMI and Employment Data: Impact on USD/CAD OutlookThe USD/CAD pair faces headwinds due to a strengthening Canadian dollar fueled by rising crude oil prices. This week's release of April employment statistics and Canada's Ivey PMI will provide insights into inflation and economic trends. Additionally, Fedspeak from Thomas Barkin and John Williams will be monitored closely. Recent US data suggesting a cooling labor market could prompt Fed rate cuts, contrasting with expectations of a possible Bank of Canada policy shift in June. The article concludes with a bullish stance on USD/CAD, recommending long positions with entry at 1.36989 and targets up to 1.39110, with a stop-loss at 1.34875.

USDCAD Pair : USDCAD ( U.S Dollar / Canadian Dollar )
Description :
Break of Structure
Head and Shoulder
Bullish Channel as Corrective Pattern in Short Time Frame
RSI - Divergence
Completed " 1234 " Impulsive Waves

USDCAD
In the 4-hour timeframe, USD/CAD is exhibiting a bullish trend following a breakout from a falling wedge pattern. This breakout typically suggests a reversal of the prior downward momentum. Traders may anticipate further upward movement in the pair, potentially targeting resistance levels as the bullish sentiment strengthens. However, it's prudent to monitor for confirmation signals and manage risk accordingly.
