usdcad idea for swingThere are important areas of interest. It could be that we are now in decline and then make the original price movement. I would like to look for purchases in the indicated areas.
Usdcadanalysis

USDCAD - Confluence for a buy ✅Hello traders!
‼️ This is my perspective on USDCAD.
Technical analysis: Here we are in a bullish market structure from daily timeframe perspective, so I look for a long. There is a confluence of arguments for a buy, is if price continue the retracement to fill the imbalance and then rejects from trendline + S/R zone + institutional big figure 1.36000.
Like, comment and subscribe to be in touch with my content!

USDCAD | LT Short D1 | Oil to power CAD StrengthPair: FX:USDCAD
Timeframe: D1 - Long Term (LT)
Direction: Short
Technical Confluences for Trade:
- Stochastics are in Overbought Conditions on D1, H4 and H1 time-frames
- Price action is at the top-end resistance of a parallel channel
- Horizontal trendline looks like a supply zone across few periods
- Aiming for the 32.8% Fibo Retracement with 23.6% as the TP 1 level
Fundamental Confluences for Trade:
- A strong oil story from ongoing geopolitical risks is a strong story for CAD's economy to remain their hold on interest rates while US's reflation story has been priced in by markets
- Risk is further war escalation from the Israel-Iran tension which continue the rush to safe-havens like USD or JPY.
Suggested Trade:
Entry @ Area of Interest 1.3750 - 1.3850
SL @ 1.3898
TP 1 @ 1.3640 (TP Half-Position & move SL to Entry level for B/Even once TP1 is achieved)
TP 2 @ 1.3567
Risk-to-Reward @ Approx. 2.08 (Depending on Entry Level)
May the pips move in our favor! Good luck! :D
*This trade suggestion is provided on an advisory basis. Any trade decisions made based on this suggestion is a personal decision and am not responsible for any losses derived from it.

USDCAD- Short IdeaEntry: Price broke through the swing low and the trendline with volume. Entry at the bearish zone.
Stop Loss: Slightly above the bearish zone. Give stop loss some room to breathe.
Take Profit: At TP, the nearish bullish zone.

USDCAD is Ready to Go Up(➡️RR=2.48)🏃♂️ USDCAD is moving in a Descending Channel and is currently near the Uptrend line and🟢 Support zone(1.3704 CAD_1.3618 CAD) 🟢.
💡Also, we can see Regular Divergence(RD+) between two Consecutive Valleys .
🔔I expect USDCAD to rise to at least 1.384 CAD after breaking the upper line of the descending channel.
--------------------------------------------------------------------------
USDCAD
🟢Position: Long
✅Entry Point: 1.37163 CAD (Limit Order)
⛔️Stop Loss: 1.36660 CAD
💰Take Profit:
🎯1.38047 CAD👉Risk-To-Reward: 1.76
🎯1.38411 CAD👉Risk-To-Reward: 2.48
⚠️Please don't forget to follow capital management.
⚠️Please pay attention to the style of opening the position.
--------------------------------------------------------------------------
U.S.Dollar/Canadian Dollar (USDCAD), 1-hour time frame ⏰.
Do not forget to put Stop loss for your positions (For every position you want to open).
Please follow your strategy; this is just my idea, and I will gladly see your ideas in this post.
Please do not forget the ✅' like '✅ button 🙏😊 & Share it with your friends; thanks, and Trade safe

USD/CAD Sell Trade Analysis: Exploring Short OpportunitiesThe USD/CAD currency pair presents an intriguing opportunity for a sell trade, with technical indicators suggesting a potential downward movement in price.
Technical Analysis:
Resistance Level: The pair is currently approaching a significant resistance level, which has historically acted as a barrier to further upside movement. This resistance level indicates a potential area for initiating a sell trade.
Trade Recommendation:
Entry: Consider entering a short position as the price approaches the resistance level, ideally after confirmation of bearish price action such as a bearish engulfing candlestick pattern or a rejection from the resistance level.
Stop Loss: Place a stop loss above the resistance level to manage risk in case of a breakout.
Target: The initial target could be set at a support level or a previous swing low, with potential for further downside if the bearish momentum strengthens.
Disclaimer:
Trading forex involves substantial risk of loss and is not suitable for all investors. The analysis provided here is for informational purposes only and should not be construed as investment advice or a recommendation to trade. Always perform your own due diligence and consult with a qualified financial advisor before making any investment decisions. Past performance is not necessarily indicative of future results. Trading carries risks, and it's essential to only trade with capital you can afford to lose.

USDCAD Buys1 HR and 4 HR time frames are Bullish
There is 1 HR and 4 HR Demand zones
Price Broke Structure and is retesting Demand Zones for possible Bullish Run
Wait for Your favorite Entry signal in Demand Zone
Place SL below Demand Zone

Will The Loonie SELL OFF Again, Or Break Up to 1.40??The Loonie has been hovering between 1.31 and 1.39 for the past two years, and we're quickly approaching the upper boundary of this weekly range. Will there be another sell-off?
Let's dive into what the price charts reveal. We're riding a 17-week uptrend on the weekly chart, with last week's candle showing an especially bullish move—over 200 pips—pushing us near the top of the range. Historically, the final push to the range's peak tends to be the most bullish, as shown in the chart below.
This pattern suggests that it might be a good time to consider selling once the right signal appears. On the daily chart, we see a similar pattern: the last leg up to the range top is usually the most significant.
Below is the sell zone chart, indicating where I plan to look for sell signals between 1.38 and 1.39 using my TRFX indicator.
I anticipate that the market will reach this sell zone in the next few days. Then, I'll wait for a sell signal on the 4-hour charts or higher.
The target for this trade is the bottom of the range at 1.31. Based on past patterns, the price should drop to this level fairly quickly.
This trade idea would be void if there's a clear break and a weekly close above 1.39. If that happens, expect a move up to the significant monthly SUPPLY/SELL zone starting at 1.40.
Would love to hear your thoughts in the comments below

USDCAD I Correction of recent bullish impulse in progressWelcome back! Let me know your thoughts in the comments!
** USDCAD Analysis - Listen to video!
We recommend that you keep this pair on your watchlist and enter when the entry criteria of your strategy is met.
Please support this idea with a LIKE and COMMENT if you find it useful and Click "Follow" on our profile if you'd like these trade ideas delivered straight to your email in the future.
Thanks for your continued support!

USDCAD Bullish side Looting plan to make 💰💵 moneyDear Robbers,
This is our Day Trade master plan to Heist Bullish side of USDCAD Bank. My dear Robbers U can enter at the any point above my entered area, Our target is Red Zone that is High risk Dangerous area. Be safe and be careful and Be rich. Loot and escape near the target 🎯

USDCAD : Short Trade , 4hHello traders, we want to check the USDCAD chart. The price is moving in an ascending channel and has reached the specified resistance level. We expect this level to stop the upward trend of the price and the price will fall to around 1.36600. Good luck.

USDCAD - Long from support zone ✅Hello traders!
‼️ This is my perspective on USDCAD.
Technical analysis: Here we are in a bullish market structure from daily timeframe perspective, so I look only for long position. My point of interest is if price makes a retracement to fill the imbalance lower and then to reject from trendline + S/R zone + institutional big figure 1.36000.
Like, comment and subscribe to be in touch with my content!

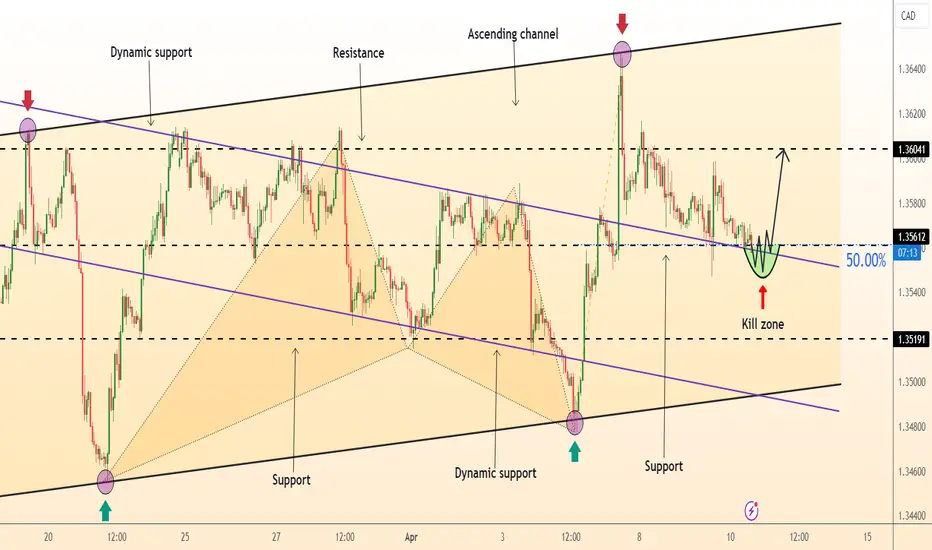
DeGRAM | USDCAD rebound from the retracement levelUSDCAD is moving in an ascending channel.
The volatility of price movement has decreased.
The chart has reached the 50% retracement level of the last upward impulse.
The price is above the level of dynamic support.
We expect a rebound after a retest of the current support.
-------------------
Share your opinion in the comments and support the idea with like. Thanks for your support!
UsdCad- New rise to 1.39?Towards the end of last year, FX:USDCAD found itself testing the crucial support zone at 1.32. Subsequently, the pair reversed its course and, as of the beginning of February, has been consistently forming higher lows on our daily chart while pressing the significant resistance level at 1.36.
I anticipate that this resistance will ultimately be breached, paving the way for a rise towards 1.39. My bullish stance on this pair remains intact as long as the sequence of lower highs is not violated.

USDCAD⚠️ Reaction From Hedger Premium Zone Out✔️USDCAD is expected to rise
✔️Recommended to consider buying
🟢 Try to BUY🔼 all the Dips !!!
✔️Confirmation Buyer Limit Area
Trade active:
Now try to go up with new buyers...
✔️Buy the dips!!!

USDCAD SELL | Idea Trading AnalysisHello Traders, here is the full analysis.
I think we can soon see more fall from this range! GOOD LUCK! Great SELL opportunity USDCAD
I still did my best and this is the most likely count for me at the moment.
Support the idea with like and follow my profile TO SEE MORE.
Traders, if you liked this idea or if you have your own opinion about it, write in the comments. I will be glad 🤝
Patience is the If You Have Any Question, Feel Free To Ask 🤗
Just follow chart with idea and analysis and when you are ready come in THE GROVE | VIP GROUP, earn more and safe, wait for the signal at the right moment and make money with us💰

USDCAD next MovePair : USDCAD ( U.S Dollar / Canadian Dollar )
Description :
Bullish Channel as an Corrective Pattern in Long Time Frame
Break of Structure
RSI - Divergence
Completed " 12 " Impulsive Waves
Demand Zone

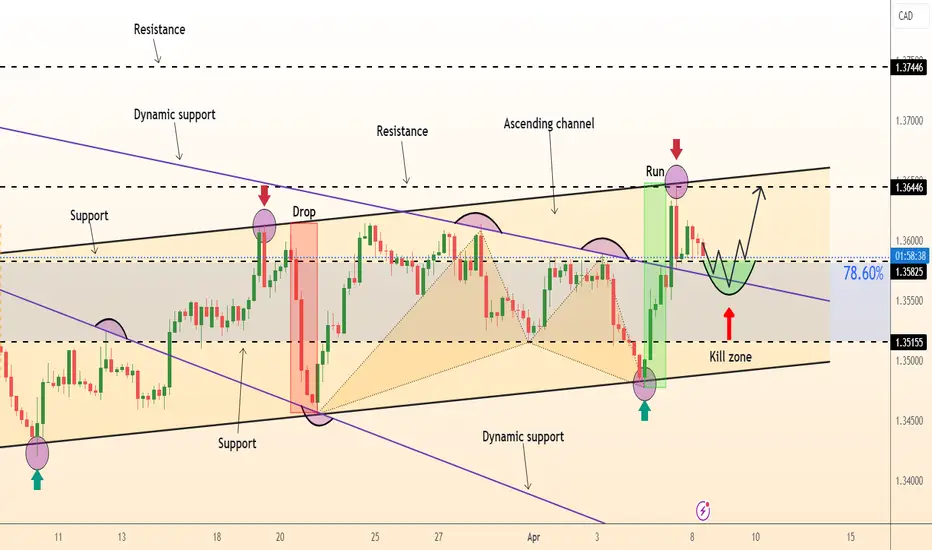
DeGRAM | USDCAD dynamic resistance breakoutUSDCAD has reached the retracement level of 78.6%.
The price broke through the level of dynamic resistance, which will now act as support.
The chart worked out the growth of the previously formed harmonic pattern "Bat".
We expect a retest of the nearest level followed by a rebound from it.
-------------------
Share your opinion in the comments and support the idea with like. Thanks for your support!
DeGRAM | USDCAD correction in the local channelUSDCAD is moving in the local descending channel.
The chart reacted 4 times with an immediate decline on reaching the upper boundary of the channel.
The price is still under strong resistance coinciding with the 88.6% retracement level.
We expect a pullback from the upper boundary of the channel.
-------------------
Share your opinion in the comments and support the idea with a like. Thanks for your support!

DeGRAM | USDCAD under resistanceUSDCAD has failed to break the resistance level more than 6 times.
The price formed a bearish takeover from the level.
We expect a pullback from resistance and a retest of the 50% retracement.
-------------------
Share your opinion in the comments and support the idea with a like. Thanks for your support!

SELL TRADE SETUP ON USDCADHey Traders,
Check out this technical analysis on USDCAD; it appears to be undergoing a small pullback, potentially indicating a rejection from the previous resistance area. provided that the resistance are is broken then we can assume for the continuation of the bullish momentum
However, I would recommend waiting for a proper retest of the broken key level before considering a buy-trade entry.
Alternatively, there may be an opportunity for a sell trade if the market breaches the evident support area.
Keep a close eye on this.

Wyckoff Higher Timeframe Distribution Schematic 12M/6M timeframe is a possible distribution Schematic that I think is currently in phase B.
Phase C,D and E are yet to form.
We shouldn't trade a distribution schematic till phase E but if a distribution Schematic 1 forms then we can trade phase C once a UTAD has been created(still risky and should wait for phase E as this is a more conservative approach).
If no UTAD then wait for phase E as you would have had more confirmation and without this you would be guessing the top.

DeGRAM | USDCAD in consolidationUSDCAD made a double top at resistance in the ascending channel.
It consolidated around the psychological level at 1.36000, then dropped below it.
The market is consolidating at the D chart, and it created a bearish, engulfing candle.
We expect a pullback from resistance and further moves south.
-------------------
Share your opinion in the comments and support the idea with a like. Thanks for your support!
