#USDCAD: Two Major Buying Zones, Patience Pays! As previously analysed, USDCAD is expected to decline towards our predetermined entry point. We anticipate a bearish US Dollar for the remainder of the week, which will ultimately lead USDCAD to reach the entry zone. Three distinct target areas exist, collectively worth over 1100 pips. Each entry point, stop loss, and take profit is clearly defined.
We wish you the best of luck and safe trading.
Thank you for your support.
If you wish to assist us, we encourage you to consider the following actions:
- Like our ideas
- Provide comments on our ideas
- Share our ideas
Kind Regards,
Team Setupsfx_
Much Love ❤️🚀
Usdcadanalysis

USDCAD BUYBy utilizing Fibonacci retracement levels, historical patterns, , we can formulate a hypothesis that the market might follow a similar trajectory if bullish sentiment prevails.

USDCAD Bearish OutlookTrend: Bearish (Lower highs and lower lows)
Key Resistance / Invalidation Level: 1.38121
Current Price: ~1.3700–1.3750 range
Expected Move: Further downside towards the 1.3500–1.3420 area unless price breaks and closes above 1.38121.
---
🎯 Trade Plan
Setup: Look for bearish entries on retracements towards the 1.3700–1.3750 area.
Invalidation: A confirmed breakout and close above 1.38121.
Target: 1.3500–1.3420 range.
--
⚡️ Summary
USDCAD remains in a downtrend, making lower highs and lower lows. As long as price stays below 1.38121, the bearish outlook is favored.
---
⚠️ Disclaimer
This is NOT financial advice. All trading involves significant risk, and you should only trade with money you can afford to lose. Always do your own analysis or consult with a qualified financial advisor before making any trading decisions.

Market Analysis: USD/CAD Breaks HigherMarket Analysis: USD/CAD Breaks Higher
USD/CAD is rising and might aim for more gains above the 1.3765 resistance.
Important Takeaways for USD/CAD Analysis Today
- USD/CAD is showing positive signs above the 1.3720 support zone.
- There is a key bullish trend line forming with support at 1.3740 on the hourly chart at FXOpen.
USD/CAD Technical Analysis
On the hourly chart of USD/CAD at FXOpen, the pair formed a strong support base above the 1.3540 level. The US Dollar started a fresh increase above the 1.3600 resistance against the Canadian Dollar.
The bulls pushed the pair above the 1.3640 and 1.3700 levels. The pair cleared the 50-hour simple moving average and climbed above 1.3750. A high was formed at 1.3766 and the pair is now consolidating.
Initial support is near the 1.3740 level. There is also a key bullish trend line forming with support at 1.3740. The next major support is near the 1.3710 level or the 23.6% Fib retracement level of the upward move from the 1.3539 swing low to the 1.3766 high.
The main support sits near the 1.3650 zone on the USD/CAD chart. It is near the 50% Fib retracement level.
A downside break below the 1.3650 level could push the pair further lower. The next major support is near the 1.3595 support zone, below which the pair might visit 1.3540.
If there is another increase, the pair might face resistance near the 1.3765 level. A clear upside break above 1.3765 could start another steady increase. The next major resistance is the 1.3800 level. A close above the 1.3800 level might send the pair toward the 1.3880 level. Any more gains could open the doors for a test of the 1.4000 level.
This article represents the opinion of the Companies operating under the FXOpen brand only. It is not to be construed as an offer, solicitation, or recommendation with respect to products and services provided by the Companies operating under the FXOpen brand, nor is it to be considered financial advice.

USDCAD SELL TRADESell opportunity on USDCAD NOW.
ENTRY: 1.37600
STOPLOSS: 1.37700
TAKEPROFIT: 1.36900
Comment your opinion pls 🙏
For Account management. Pls Contact me via X @shajudeakinoba1

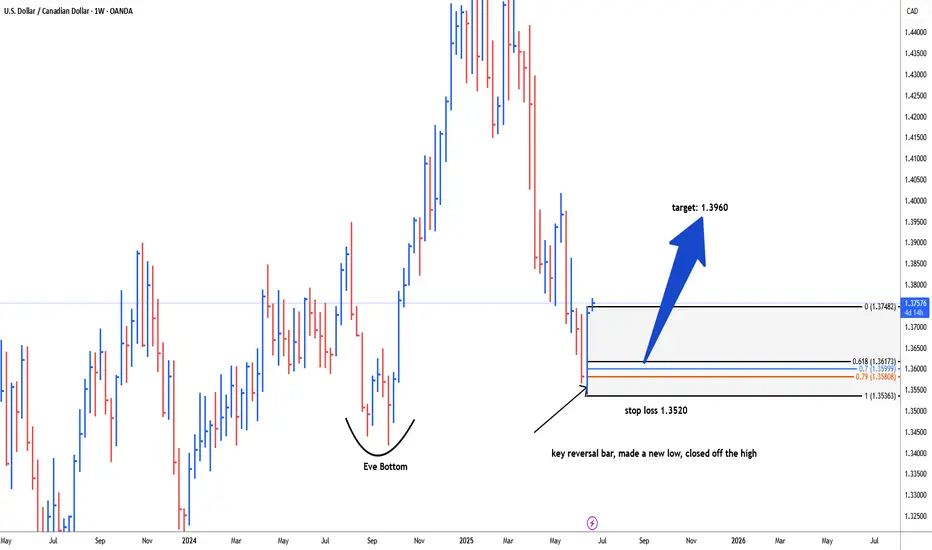
USDCAD possible bullish reversal for 1.3960#usdcad weekly key reversal bar, made a new low, closed off the high, early indication for reversal. It's better to wait for correction 61.8 fib level, 79.0 fib level and 79.0 fib level to reduce/secure drawdwon i.e. 1.3622-1.3585 is the area of interest for long trade. stop loss below key reversal bar i.e. 1.3520. target level: 1.3960
USDCAD H4 AnalysisUSDCAD Showing a Bearish Flag. If it breaks this zone above, Most probably can fly up to 1.37836 and higher to 1.38654. If no, Can rally between 1.36359, 1.35415 or even lower. Trading Analysis from 23-06-25 to 27-06-25. Take your risk under control and wait for market to break support or resistance on smaller time frame. Best of luck everyone and happy trading.🤗

USDCAD LONG SETUPI am expecting the US Dollar to be bullish this week.
Weekly closed as a bullish engulfing.
Expecting price to make a minor pull back on the daily before taking making another bullish push.
Price is also showing a bullish divergence on the daily, which furthers strengthens my perspective.
The 2H TF also illustrates somewhat of a Cup-and-Handle Candle Stick Formation
Will look to enter longs on the lower TFs (1-4h)

USDCAD Analysis – Breaking the Chains, Eyeing 1.38+USDCAD Price broke out from a long descending channel, followed by two bullish continuation flags – classic breakout-retest pattern.
Price is now pushing above 1.3720, aligning with the 38.2% Fib level of the prior drop.
Next upside targets:
🔹 1.3833 (Fib 61.8%)
🔹 1.3913 (Fib 78.6%)
Clear stop level: below 1.3625 (channel breakout support)
Structure Bias: Bullish continuation. Clean breakout + consolidation = probable impulse toward 1.3830/1.39.
📊 Current Bias: Bullish
🔍 Key Fundamentals Driving USDCAD
USD Drivers (Neutral to Bullish):
Fed held rates, dot plot shows only 1 cut in 2025, but Powell's tone leaned dovish.
US Retail Sales + PPI were weak, but safe-haven USD demand persists due to geopolitical risks and equity volatility.
Market reassessing Trump election risk, Fed independence, and inflation stickiness.
CAD Drivers (Bearish):
Oil prices are volatile due to Middle East tensions, but weak demand caps upside.
Canada’s CPI softened, BoC already delivered a dovish cut earlier this month.
CAD under pressure due to dovish BoC outlook and fiscal concerns (gov't budget deficits expanding).
CAD is also suffering from reduced foreign investment flows.
⚠️ Risks to Watch
Oil price spikes (especially if Strait of Hormuz risk escalates) may boost CAD short-term.
A sharp reversal in DXY or Fed commentary shift toward aggressive easing.
Weak US data next week (Core PCE especially) could unwind USD momentum.
🗓️ Upcoming Events to Watch
US Core PCE (June 28) – critical inflation gauge for the Fed
BoC Business Outlook Survey
Oil Inventories + Global energy sentiment
Geopolitical: Israel–Iran updates and Canada’s fiscal signals
🏁 Which Pair Leads the Move?
USDCAD is leading commodity crosses as CAD weakness broadens. Watch USDCAD and GBPCAD for signs of CAD softness before others like AUDCAD/NZDCAD follow.

Bearish USD/CAD Presents a Selling Opportunity Now.FenzoFx—USD/CAD surged to 1.3686, a resistance zone backed by a bearish Fair Value Gap. Stochastic shows 81.0, signaling short-term overpricing. The market remains bearish below 1.3729, with fundamentals pointing to a stronger CAD.
A decline toward 1.362 is likely if USD/CAD stays below 1.3729.

USD/CAD)) Bearish Trand analysis Read The captionSMC trading point update
Technical analysis of USD/CAD on the 3-hour timeframe, using Smart Money Concepts (SMC) and classic technical analysis. Here's a breakdown
---
Key Technical Insights:
Overall Trend:
The pair is in a clear downtrend, confirmed by:
Lower highs and lower lows
Price trading below the 200 EMA (currently at 1.37402)
Respect for the downtrend channel
---
Resistance Zones:
1. Upper Resistance Zone (~1.38400 – 1.38750):
Strong historical sell area (price sharply reversed here in late May)
2. Mid Resistance Zone (~1.36450 – 1.36750):
Price reacted twice here and dropped.
Aligns with the downtrend line and was recently tested again (red arrow).
---
Bearish Projections:
After the latest pullback into the resistance zone, price is expected to:
Reject the zone
Continue following the descending structure
Target marked around 1.35034, which coincides with:
Previous low
Lower boundary of the descending channel
Mr SMC Trading point
---
Chart Tools & Features Used:
Trendlines: Clearly marking the downtrend channel
200 EMA: Used as dynamic resistance
Fib-like measured move: Mirrored previous impulse moves (-1.61%) suggesting a symmetric drop
Arrows: Indicating reaction points from resistance
---
Conclusion:
Bias: Bearish
Invalidation: Break and hold above 1.36500 would weaken the bearish outlook.
Next Move: Potential sell setups on lower timeframe retests or bearish confirmations within the resistance zone.
Please support boost 🚀 this analysis)

USDCAD Bearish Bias: Beware Liquidity Traps & Reversal Risks.I'm currently keeping a close eye on USDCAD, which has been in a strong bearish trend. 📉
In this video, I explain how the market is unfolding across both the higher and lower timeframes, and why it’s critical to watch them in conjunction. On the lower timeframes, we often see a clean sequence of lower highs and lower lows, as the algos set up a seemingly a smooth trend. But traders should be cautious ⚠️
Why? Because on the higher timeframes, the market can easily pull back, triggering a liquidity hunt. This is often when the algorithm targets stop orders above recent highs, before resuming the trend 🧠💥
While my bias remains bearish, I'm also aware of the risk that the market could shift gears unexpectedly to run stops and shake out weak hands. This concept is fully broken down in the video — with examples of how to spot these traps and prepare accordingly 🎯

USDCAD Under Pressure: Chart Signals & Macro Forces Point South!The USDCAD pair is under clear pressure, as illustrated in this chart 📊. The visual structure highlights a persistent bearish trend, with price action consistently forming lower highs and lower lows. The chart is reinforcing the idea that sellers are dominating the market. Notably, the drawn arrow in the chart points toward previous higher timeframe lows, suggesting that these areas could be the next logical targets for price action if the current trend persists.
On the fundamental side, the US dollar has been weakened by dovish signals from the Federal Reserve and softer economic data, fueling expectations of potential rate cuts later this year 🏦. In contrast, the Canadian dollar has been buoyed by strong commodity prices—especially oil—and a relatively hawkish Bank of Canada. The bearish structure seen in the chart aligns with these macro drivers, as the CAD continues to benefit from both domestic strength and global demand for commodities.
Geopolitically, ongoing global trade tensions and shifting risk sentiment have further supported the Canadian dollar, as investors seek stability in commodity-backed currencies 🌍. The combination of these factors, as reflected in the chart, suggests that USDCAD remains vulnerable, and a move down to retest previous higher timeframe lows is a real possibility unless there’s a significant shift in the underlying fundamentals.
Traders should keep an eye on the key support zones highlighted in the chart, as these could provide clues for potential exhaustion or reversal in the current trend 🔎.
Disclaimer: This analysis is for informational purposes only and does not constitute financial advice. Please conduct your own research or consult a professional before making any trading decisions.

Will CAD bulls eventually fade away?During the North American session, the USD/CAD exchange rate continued its downward trend and is currently trading above 1.3600, approaching the support zone at 1.3600. If the exchange rate effectively holds the 1.3600 support zone, accompanied by RSI bottom divergence and MACD death cross repair signals, there may be a short-term technical rebound. The initial resistance above is still at 1.3700. If it can break through, it may open up space to 1.3800.
Humans need to breathe, and perfect trading is like breathing—maintaining flexibility without needing to trade every market swing. The secret to profitable trading lies in implementing simple rules: repeating simple tasks consistently and enforcing them strictly over the long term.

USDCAD Hits Support as Fed-Hawkish & BoC Cuts! Big Bounce ComingUSDCAD ( OANDA:USDCAD ) is trading at the Potential Reversal Zone(PRZ) and near the important Support line and Support lines .
In terms of Elliott Wave theory , it seems that USDCAD has managed to complete 5 main down waves and we can expect more up waves .
Also, we can see the Regular Divergence(RD+) between Consecutive Valleys .
I expect USDCAD to rise to at least 1.37860 CAD.
Fundamental View:
The Bank of Canada initiated its rate-cutting cycle , while the Federal Reserve remains firm with no immediate plans to ease.
Strong NFP data on Friday reinforced USD ( TVC:DXY ) strength .
Oil prices( BLACKBULL:BRENT ) may offer temporary support to CAD , but macro divergences clearly favor the dollar .
Note: Stop Loss(SL)= 1.36110 CAD
U.S Dollar/Canadian Dollar Analyze (USDCAD), 4-hour time frame.
Be sure to follow the updated ideas.
Do not forget to put a Stop loss for your positions (For every position you want to open).
Please follow your strategy; this is just my idea, and I will gladly see your ideas in this post.
Please do not forget the ✅' like '✅ button 🙏😊 & Share it with your friends; thanks, and Trade safe.

USD/CAD) Down Trand analysis Read The captionSMC trading point update
Technical analysis of USD/CAD (U.S. Dollar / Canadian Dollar) currency pair on the 2-hour timeframe, and it suggests a potential sell setup based on price action, key levels, and momentum indicators.
---
Chart Summary
Pair: USD/CAD
Timeframe: 2H
Current Price: 1.36432
EMA 200: 1.37436
Direction Bias: Bearish
Volume: 6.92K
Key Tool: EMA 200, RSI, Support/Resistance Zones
---
Technical Breakdown
1. Resistance Zone / Supply Area (~1.3680 - 1.3700)
The yellow box highlights a strong resistance zone.
Marked by three red arrows, where price has repeatedly rejected.
Indicates clear seller dominance in this area.
2. Break of Support Level
Price broke below the yellow support area and is now trading below it.
This signals a bearish breakout from a consolidation zone.
3. EMA 200 Trend Confirmation
EMA 200 (blue line) is sloping down.
Price is below the EMA, confirming bearish trend bias.
Acts as dynamic resistance.
4. Bearish Flag/Channel Break
A bearish flag or wedge pattern seems to have been broken downward.
The measured move (blue vertical line) suggests the projected drop.
---
Target Point
Target Price: 1.34951
This is based on the measured move from the resistance zone.
It aligns with the previous demand/support zone.
---
RSI (Relative Strength Index)
RSI (14) is 36.37, approaching the oversold zone.
This shows strong bearish momentum, but it also means price may stall or bounce slightly before continuing downward.
---
Trade Setup Idea
Entry: After confirmation of breakout below 1.3640
Stop Loss: Above 1.3700 (resistance zone)
Take Profit: 1.34951
Risk-to-Reward: ~1:2+
---
Risk Management & Caution
If price moves back into the yellow zone or breaks above 1.3700, the setup is invalidated.
Watch for high-impact news events (marked on the chart with U.S. flags) that may trigger volatility.
Mr SMC Trading point
---
Conclusion
This is a well-structured bearish idea based on:
Resistance rejections
Break of support
Downward EMA slope
Bearish RSI reading
It reflects strong downside potential toward 1.3495, offering a clean shorting opportunity for swing traders
Please support boost 🚀 this analysis)

THE USD CAD PAIR USD/CAD 1H Chart – Busy with Levels but the Bias is Clear 📊✨
Multiple confluences pointing to bullish intent: trendline support, key demand zones, and clean higher lows. Despite the clutter, price is respecting structure. Watching for a clean break above recent highs to ride the buy-side liquidity sweep. Eyes on 1.38+ 📈
#ForexTrading #USDCAD #SmartMoney #TechnicalAnalysis"

USD/CAD Holds Near 2025 LowUSD/CAD Holds Near 2025 Low
When we last analysed the USD/CAD chart on 4 June, we identified a descending channel that remains relevant.
On 5 June, the pair reached a new low for 2025, and it is possible that bears will attempt to extend this move further over the course of the month.
Why is USD/CAD declining?
The Canadian dollar appears to be strengthening amid speculation that a trade agreement between the US and Canada could be finalised soon — possibly on 15 June, when the G7 summit is due to be held in Canada.
Media reports highlight several indicators supporting this view:
→ Prime Minister Mark Carney stated that Canada will meet its NATO spending target of 2% of GDP.
→ Canada refrained from retaliatory tariffs on steel and aluminium.
→ The US ambassador to Canada confirmed that “secret” negotiations are ongoing.
Technical Analysis of the USD/CAD Chart
Note that the R-line, which divides the lower half of the descending channel into two equal parts, acted as resistance — price reversed downward from this line and accelerated lower (as indicated by the arrow). This reinforces the view that bears currently dominate the USD/CAD market.
For now, the 1.3650 level appears to be a support zone for bulls, but its strength may be tested today as markets react to US inflation data. The Consumer Price Index (CPI) report is scheduled for release today at 15:30 GMT+3. Be prepared for potential spikes in volatility.
This article represents the opinion of the Companies operating under the FXOpen brand only. It is not to be construed as an offer, solicitation, or recommendation with respect to products and services provided by the Companies operating under the FXOpen brand, nor is it to be considered financial advice.
Can 1.3633 Construct a Bottom?The USD/CAD exchange rate continues to maintain a (sideways) pattern, currently trading around 1.37. Although the US dollar is fundamentally supported by the boost from the US non-farm payroll data and the optimistic expectations of trade negotiations in major economies, the overall market sentiment remains cautious. The Canadian dollar is supported by the strengthening of crude oil prices, and the exchange rate trend presents a complex pattern of mixed long and short positions. In the short term, if the exchange rate can effectively break through 1.3800 and stabilize above this level, it will open up further upward space. The next targets may point to the middle track of Bollinger Bands at 1.3823 and the previous platform resistance area at 1.3900. However, if it is blocked again at the 1.3800 line and falls back, it will increase the market expectation of "making a new low after a technical rebound". At that time, the supports will focus on 1.3640 and the low point of 1.3633. If the latter is broken, it will open up the downward space to 1.3600 or even 1.3550.
Humans need to breathe, and perfect trading is like breathing—maintaining flexibility without needing to trade every market swing. The secret to profitable trading lies in implementing simple rules: repeating simple tasks consistently and enforcing them strictly over the long term.

USDCAD WILL DELIVER BY FIREThe USD/CAD trended lower in a volatile manner this week, declining 0.29% on a weekly basis, reflecting the relative resilience of the Canadian dollar supported by the Bank of Canada's (BoC) policy and economic data. The BoC maintained its interest rate at 2.75%, in line with market expectations. The BoC's concerns about Trump's tariff policies mirror the widespread anxieties among global central banks regarding the impact of trade wars. The central bank is likely to remain on hold in the short term to observe the effects of trade policies. If employment data turns out to be robust, the Canadian dollar may gain further support.
Humans need to breathe, and perfect trading is like breathing—maintaining flexibility without needing to trade every market swing. The secret to profitable trading lies in implementing simple rules: repeating simple tasks consistently and enforcing them strictly over the long term.

#USDCAD: 500+ Pips Big Buy Opportunity!Dear Traders
Hope you are doing great, we have a great buying opportunity on USDCAD, our first entry is in profit of 250+ pips, however, we expect price to grow steadily after reconfirming the same area. USDCAD tends to reconfirm the order block area many times before a big bull move. Good luck.

USDCAD SHORT TERM BULLISH CORRECTIONGenerally, the US Dollar is losing ground against major currencies. The decline is stemming from pending tariffs equilibrium and looming Fed rate cuts. On the USDCAD daily chart, the US Dollar is poised to decline further to the unmitigated zone. Once this demand zone is contacted we are likely to clearer price action direction on whether to buy or sell further. Our bias is a short term bullish market correction outlook once the unmitigated zone is contacted.
USD/CAD Holds Near 2025 LowUSD/CAD Holds Near 2025 Low
As the chart shows, the USD/CAD exchange rate hit its lowest level of 2025 on 2nd June, nearing the 1.3680 mark. Although there was a partial recovery on 3rd June, it was not substantial.
These fluctuations reflect market participants’ cautious sentiment ahead of key announcements scheduled for today, 4th June:
→ At 15:15 (GMT+3), the ADP Employment Change figures will be released, offering insight into the US employment situation. Traders are concerned as the previous reading was only +61K — a sharp contrast to the consistent triple-digit increases seen throughout 2024.
→ At 16:45 (GMT+3), the Bank of Canada will announce its interest rate decision. According to ForexFactory, analysts expect the overnight rate to remain unchanged at 2.75%, though surprises cannot be ruled out.
Technical Analysis of USD/CAD
Since the second half of April, the price has been moving within a downward channel (marked in red), largely influenced by tariff-related developments in US-Canada trade relations.
Bulls are attempting to prevent further decline, taking advantage of the support provided by the channel’s lower boundary. Note the sharp rebound following a failed bearish breakout (marked with an arrow), which suggests strong demand around the 1.3700 level.
On the other hand, bears have gained control over the 1.3800 level, based on the following:
→ The exchange rate found local support at this level on 29th May, but it was breached on 30th May.
→ The drop from 30th May was notably aggressive, indicating strong selling pressure.
Given the above, it is reasonable to assume that if, following today’s news, the USD/CAD rate remains within the 1.3700–1.3800 range, it may signal that supply and demand have reached a stable balance. This could suggest that the pair is ready to stabilise after the intense volatility seen in the first half of April.
This article represents the opinion of the Companies operating under the FXOpen brand only. It is not to be construed as an offer, solicitation, or recommendation with respect to products and services provided by the Companies operating under the FXOpen brand, nor is it to be considered financial advice.
