USDCAD Strong Bearish Breakout!
HI,Traders !
USD-CAD keeps going down
After the strong bearish
Breakout of the key horizontal
Level of 1.42823 which is
Now a resistance and as
We are bearish biased we will
Be expecting a further
Bearish move down!
Comment and subscribe to help us grow !
Usdcadforecast

USDCAD consolidation could turn bearish below 1.4300 level.The USDCAD currency pair sentiment appears neutral, supported by the longer-term sideways consolidation trading range. However, since the spike caused by the possible tariff announcement on 03rd February 2024, the USDCAD price action is starting to display some signs of bearish behaviour. Today, Thursday 13th February 2025 USDCAD is testing psychologically important support around the 1.4300 level. The price action is triggered by the increase in optimism over the Russia and Ukraine truce. The USD currency remains strong on the expectations that the Fed will hold interest rates at the current levels for longer. On the other hand, the market expectation for BoC is to continue gradually reducing the interest rates further.
The key trading level is at 1.4300, the current swing low range from 18th December 2024 until 04th February 2025. A continuation of the selling pressure below the 1.4300 level and a daily close below the 1.4250 support level could target additional downside support at 1.4200 followed by the 1. 4250 and 1.4110 levels over the longer timeframe.
Alternatively, an oversold rally from the current levels and a confirmed breakout above 1.4380 resistance and a daily close above that level would negate the bearish outlook opening the way for a further rally and a retest of 1.4430 resistance followed by 1.4450 levels.
This communication is for informational purposes only and should not be viewed as any form of recommendation as to a particular course of action or as investment advice. It is not intended as an offer or solicitation for the purchase or sale of any financial instrument or as an official confirmation of any transaction. Opinions, estimates and assumptions expressed herein are made as of the date of this communication and are subject to change without notice. This communication has been prepared based upon information, including market prices, data and other information, believed to be reliable; however, Trade Nation does not warrant its completeness or accuracy. All market prices and market data contained in or attached to this communication are indicative and subject to change without notice.

Scenario on USDCAD 13.2.2025USDCAD and for this market, I have several alternatives as to how it could probably take place, so first I would look at the long where we have the first sfp below the low at the price level of 1.424 and then there is the last sfp for me if this does not last, then we go to lower values, the value is 1.41850 short in this market I would take the value of 1.43810 where there is resistance and then I have 2 more interesting levels for reaction the last one is for me the monthly level at the value of 1.45792, if we overcome this level, it is quite likely that we will look higher.

USDCAD Long BaisUS Dollar against Canadian Dollar
The USD/CAD pair is currently on a structural support line that has historically demonstrated its ability to hold the pair. Based on this observation, it is reasonable to anticipate that the pair may respect this support level and potentially reverse to the upside, presenting a possible opportunity to enter a long position.
I would be interested in hearing your perspective on the future price action of this pair. As always, it is important to consider conducting further analysis and implementing appropriate risk management strategies before making any trading decisions.

USD/CAD "The Loonie" Forex Market Bullish Heist PlanDear Money Makers & Robbers, 🤑 💰
Based on 🔥Thief Trading style technical and fundamental analysis🔥, here is our master plan to heist the USD/CAD "The Loonie" Forex market. Please adhere to the strategy I've outlined in the chart, which emphasizes long entry. Our aim is the high-risk Red Zone. Risky level, overbought market, consolidation, trend reversal, trap at the level where traders and bearish robbers are stronger. Be wealthy and safe trade.💪🏆🎉
Entry 📈 : "The heist is on! Wait for the breakout (1.45100) then make your move - Bullish profits await!"
however I advise placing Buy limit orders within a 15 or 30 minute timeframe. Entry from the most recent or closest low or high level should be in retest.
Stop Loss 🛑: Using the 4H period, the recent / nearest low or high level.
Goal 🎯: 1.48000 (or) Escape Before the Target
Scalpers, take note 👀 : only scalp on the Long side. If you have a lot of money, you can go straight away; if not, you can join swing traders and carry out the robbery plan. Use trailing SL to safeguard your money 💰.
📰🗞️Fundamental, Macro, Sentimental Outlook:
🟣 Fundamental and Macroeconomic Analysis
US Dollar (USD):
The USD remains strong due to the Federal Reserve's hawkish stance. The Fed has signaled potential rate hikes or prolonged higher rates to combat inflation, which supports the USD.
Recent US economic data (e.g., strong labor market, resilient GDP growth) reinforces the Fed's tightening bias.
Upcoming US CPI and PPI data will be critical. Higher-than-expected inflation could further boost the USD.
Canadian Dollar (CAD):
The CAD is influenced by oil prices (Canada is a major oil exporter). Crude oil prices have been volatile due to geopolitical tensions and OPEC+ production cuts, but recent stabilization around
80−85/barrel provides some support.
The Bank of Canada (BoC) has paused rate hikes, citing slowing inflation and economic growth. This dovish stance weakens the CAD relative to the USD.
Canada’s upcoming employment and GDP data will be key. Weakness in these metrics could further weigh on the CAD.
Key Drivers:
Interest Rate Differential: The Fed’s hawkishness vs. the BoC’s dovishness favors USD strength.
Oil Prices: A sustained rise in oil prices could support the CAD, but current levels are not enough to offset USD strength.
Economic Data: Strong US data vs. weaker Canadian data could widen the USD/CAD upside.
🟢 Commitments of Traders (COT) Report
The latest COT data shows:
Commercial Traders (Hedgers): Increasing long positions in the CAD, suggesting they expect some CAD strength or USD weakness in the medium term.
Non-Commercial Traders (Speculators): Net long on USD, reflecting bullish sentiment toward the USD.
Retail Positioning: Retail traders are heavily short on USD/CAD, which often acts as a contrarian indicator, suggesting further upside potential for USD/CAD.
🔵 Market Sentiment and Positioning
Sentiment:
The market is broadly bullish on the USD due to the Fed’s stance and strong US economic data.
The CAD is viewed as vulnerable due to the BoC’s pause and reliance on oil prices, which are not currently providing enough support.
🟤 Positioning:
Institutional investors are net long USD/CAD, aligning with the fundamental outlook.
Retail traders are net short, which could lead to a squeeze higher if the USD continues to strengthen.
🔴 Market Sentiment and Positioning:
COT Data:
Non-commercial traders (speculators) are net long on USD, reflecting bullish sentiment.
Retail traders are net short on USD/CAD, which often acts as a contrarian indicator (bullish for USD/CAD).
Institutional Positioning:
Institutional investors are net long USD/CAD, aligning with the fundamental outlook.
⚠️Trading Alert : News Releases and Position Management 📰 🗞️ 🚫🚏
As a reminder, news releases can have a significant impact on market prices and volatility. To minimize potential losses and protect your running positions,
we recommend the following:
Avoid taking new trades during news releases
Use trailing stop-loss orders to protect your running positions and lock in profits
📌Please note that this is a general analysis and not personalized investment advice. It's essential to consider your own risk tolerance and market analysis before making any investment decisions.
📌Keep in mind that these factors can change rapidly, and it's essential to stay up-to-date with market developments and adjust your analysis accordingly.
💖Supporting our robbery plan will enable us to effortlessly make and steal money 💰💵 Tell your friends, Colleagues and family to follow, like, and share. Boost the strength of our robbery team. Every day in this market make money with ease by using the Thief Trading Style.🏆💪🤝❤️🎉🚀
I'll see you soon with another heist plan, so stay tuned 🤗

USDCAD SHORT: Divergence in employment data!Canada's January employment change 76.0K vs 25.0K estimate.
US January non-farm payrolls +143K vs +170K expected
NFP data came in lower than expected while employment data came in stronger than expected for the CAD. Due to the result, we expected the pairs to move in opposite directions with the USD being the weaker of the two pairs.

USDCAD, NFP impact. lets know the setup with targetHello Everyone as we have seen a shift in USDCAD rally from upside to downside, so I am expecting a selloff in the USDCAD further with very easy clean and clear setup for the downside.
As today is the NFP, keep the risk less, but the setup has high probability to perform and DELIVER THE TARGET.

USDCAD Could move 1,064pips up the next month.The reasons why I strongly believe this move will happen are the following:
According to the CFTC non-commercials are shorting CAD.
Non-commercials have 20,388 positions long and 68,914 positions shorts. This means that they are selling more CAD than they actually buying it. According to this info we could expect a move to the upside.
From a monthly perspective there is plenty of buy side liquidity in USDCAD.
If you look at the chart you will see two blue circles and a dollar bill between them . Those highs have not been liquidated yet. The price is aggressively chasing those highs. According to the explanation provided the price is extremely bullish because is moving to a strong liquidity area.
From monthly perspective the price already liquidates sell side liquidity.
If look at the chart you will see a yellow circle . The yellow circle represents the sell side liquidity that was liquidated by the price.
The price has bullish structure.
The price is making higher highs will doing so liquidating sell side liquidity.
There is a lot of optimists about the dollar getting stronger in the near future.
DXY has bullish structure.
The DXY is currently making a retracement. It is currently at 50%. We could assume that is very close to be ready because it took sell side liquidity as well.
In other words, the CAD is getting weaker and the USD stronger.

USDCAD, Is 1.47 available ?Hello Traders, Happy new year in advance, I Hope you have a great year ahead with your family.
let's go for USDCAD analysis:
for upcoming weeks, we'll probably see a downward correction to Specified level at first and then it will start another Rally. so with a proper trigger we can open a short position at first and after that a long position with TP around 1.4700.
And finally tell me what do you think ? UP or DOWN ? leave your comment below this post.
If this post was helpful to you, please like it and share it with your friend.
THANKS.

UCAD BullishUCAD broke above and retested around 1.44150 and made a new high.
I'm looking for this to push higher.
High-impact news is set to release at 2pm EST.

USDCAD IdeaThis pair is retesting the ascending trendline so we enter a sell (short ) position
follow us or more ides and updates

USD/CAD "The Loonie" Forex Market Heist Plan on Bullish🌟Hi! Hola! Ola! Bonjour! Hallo!🌟
Dear Money Makers & Robbers, 🤑 💰
Based on 🔥Thief Trading style technical and fundamental analysis🔥, here is our master plan to heist the USD/CAD "The Loonie" Forex market. Please adhere to the strategy I've outlined in the chart, which emphasizes long entry. Our aim is the high-risk Red Zone. Risky level, overbought market, consolidation, trend reversal, trap at the level where traders and bearish robbers are stronger. Be wealthy and safe trade.💪🏆🎉
Entry 📈 : Traders & Thieves with New Entry A bull trade can be initiated on the MA level breakout of 1.44900
However I advise placing Buy limit orders within a 15 or 30 minute timeframe. Entry from the most recent or closest low or high level should be in retest.
Stop Loss 🛑: Using the 2H period, the recent / nearest low or high level.
Goal 🎯: 1.26000 (or) Escape Before the Target
Scalpers, take note 👀 : only scalp on the Long side. If you have a lot of money, you can go straight away; if not, you can join swing traders and carry out the robbery plan. Use trailing SL to safeguard your money 💰.
Fundamental Outlook 📰🗞️
A bullish scenario for the USD/CAD pair would involve a combination of factors that would lead to an increase in the value of the US dollar relative to the Canadian dollar. Here are some possible factors that could contribute to a bullish scenario:
Strong US Economic Growth: A strong US economy, with rising GDP growth, low unemployment, and increasing consumer spending, could lead to an increase in the value of the US dollar.
Interest Rate Hikes: If the Federal Reserve raises interest rates more aggressively than expected, it could lead to an increase in the value of the US dollar, as higher interest rates would make the US dollar more attractive to investors.
Weak Canadian Economic Growth: A weak Canadian economy, with slow GDP growth, high unemployment, and decreasing consumer spending, could lead to a decrease in the value of the Canadian dollar.
Commodity Price Decline: A decline in commodity prices, such as oil and gold, could lead to a decrease in the value of the Canadian dollar, as Canada is a major exporter of these commodities.
Bank of Canada Dovishness: If the Bank of Canada takes a dovish stance on monetary policy, it could lead to a decrease in the value of the Canadian dollar, as investors would expect lower interest rates and a more accommodative monetary policy.
The USD/CAD pair is looking interesting right now. Based on the latest analysis, it seems that the pair is likely to grow, Some experts are predicting a bullish continuation, with the price potentially breaking above the range's resistance. However, others are warning of a potential reversal, with the pair showing signs of exhaustion and a possible shift in momentum.
In terms of fundamentals, the US CPI for May is predicted to rise 0.7% monthly and 8.3% annualized, which could impact the USD/CAD pair. Additionally, the Canadian Employment Report for May is predicted to show the addition of 30.0K jobs and an Unemployment Rate of 5.2%, which could also affect the pair.
Overall, it's a bit of a mixed bag, but it seems that the bullish scenario is gaining traction. Of course, it's always important to keep an eye on the latest news and analysis, as things can change quickly in the forex market...........................
Trading Alert⚠️ : News Releases and Position Management 📰 🗞️ 🚫🚏
As a reminder, news releases can have a significant impact on market prices and volatility. To minimize potential losses and protect your running positions,
we recommend the following:
Avoid taking new trades during news releases
Use trailing stop-loss orders to protect your running positions and lock in profits
Please note that this is a general analysis and not personalized investment advice. It's essential to consider your own risk tolerance and market analysis before making any investment decisions.
Keep in mind that these factors can change rapidly, and it's essential to stay up-to-date with market developments and adjust your analysis accordingly.
💖Supporting our robbery plan will enable us to effortlessly make and steal money 💰💵 Tell your friends, Colleagues and family to follow, like, and share. Boost the strength of our robbery team. Every day in this market make money with ease by using the Thief Trading Style.🏆💪🤝❤️🎉🚀
I'll see you soon with another heist plan, so stay tuned 🫂

USDCAD LONG: CAD CPI ON TAP Canada December CPI 1.8% y/y versus 1.9% expected.
Due to the above result, we are looking to buy the USDCAD due to potential weaker Canadian dollar.

USD/CAD "The Loonie" Forex Market Heist Plan on Bullish🌟Hi! Hola! Ola! Bonjour! Hallo!🌟
Dear Money Makers & Robbers, 🤑 💰
Based on 🔥Thief Trading style technical and fundamental analysis🔥, here is our master plan to heist the USD/CAD "The Loonie" Forex market. Please adhere to the strategy I've outlined in the chart, which emphasizes long entry. Our aim is the high-risk Red Zone. Risky level, overbought market, consolidation, trend reversal, trap at the level where traders and bearish robbers are stronger. 👀 Be wealthy and safe trade.💪🏆🎉
Entry 📈 : You can enter a Bull trade at anypoint,
however I advise placing Buy limit orders within a 15 or 30 minute timeframe. Entry from the most recent or closest low or high level should be in retest.
Stop Loss 🛑: Using the 2h period, the recent / nearest low or high level.
Goal 🎯: 1.44850 (or) Escape before the target
Scalpers, take note : only scalp on the Long side. If you have a lot of money, you can go straight away; if not, you can join swing traders and carry out the robbery plan. Use trailing SL to safeguard your money 💰.
Warning⚠️ : Our heist strategy is incompatible with Fundamental Analysis news 📰 🗞️. We'll wreck our plan by smashing the Stop Loss 🚫🚏. Avoid entering the market right after the news release.
Fundamental Outlook 📰🗞️
The USD/CAD pair is expected to move in a bullish trend, driven by several fundamental factors:
US Economy: The US economy is expected to grow, driven by a strong labor market and increasing consumer spending.
Canadian Economy: The Canadian economy is expected to slow down, driven by a decline in crude oil prices and a decrease in housing market activity.
Interest Rate Divergence: The Federal Reserve (Fed) is expected to keep interest rates steady, while the Bank of Canada (BOC) is expected to cut interest rates, which could lead to a widening of the interest rate differential between the two currencies.
Commodity Prices: Canada is a major commodity exporter, and a decline in commodity prices could hurt the Canadian economy and support the USD.
UPCOMING NEWS:
US Retail Sales: The US retail sales for July are expected to increase by 0.3% monthly, which could lead to a strengthening of the USD.
Canadian Retail Sales: The Canadian retail sales for July are expected to decrease by 0.2% monthly, which could lead to a weakening of the CAD.
US Consumer Price Index (CPI): The US CPI for July is expected to increase by 0.2% monthly, which could lead to a strengthening of the USD.
Canadian CPI: The Canadian CPI for July is expected to decrease by 0.1% monthly, which could lead to a weakening of the CAD.
Please note that this is a general analysis and not personalized investment advice. It's essential to consider your own risk tolerance and market analysis before making any investment decisions.
Take advantage of the target and get away 🎯 Swing Traders Please reserve the half amount of money and watch for the next dynamic level or order block breakout. Once it is resolved, we can go on to the next new target in our heist plan.
Keep in mind that these factors can change rapidly, and it's essential to stay up-to-date with market developments and adjust your analysis accordingly.
💖Supporting our robbery plan will enable us to effortlessly make and steal money 💰💵 Tell your friends, Colleagues and family to follow, like, and share. Boost the strength of our robbery team. Every day in this market make money with ease by using the Thief Trading Style.🏆💪🤝❤️🎉🚀
I'll see you soon with another heist plan, so stay tuned 🫂

USDCAD Will Keep Growing!
HI,Traders !
USD-CAD is trading in an
Uptrend and the pair just
Made a strong bullish
Breakout so we are
Bullish biased now and
We will be expecting a
Further bullish move up!
Comment and subscribe to help us grow!

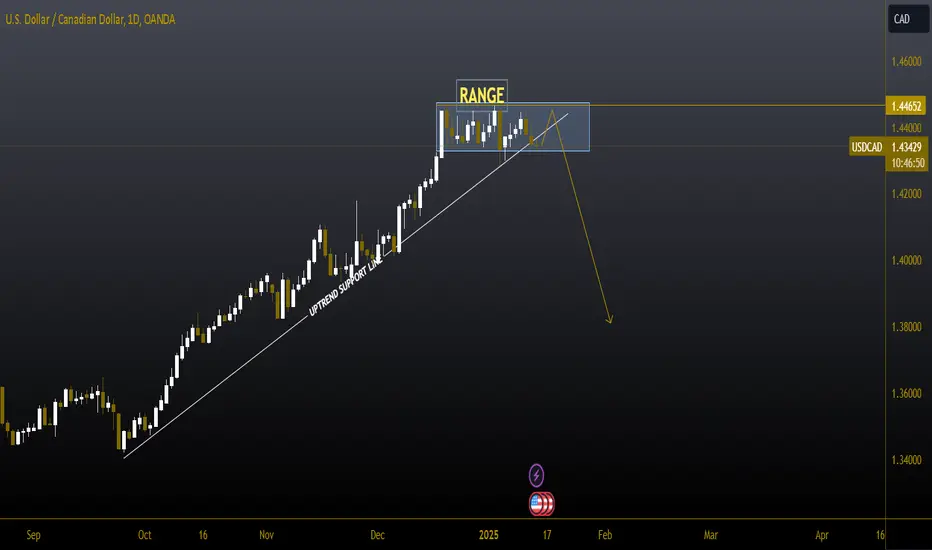
#USDCAD 1DAYUSDCAD (1D Timeframe) Analysis
Market Structure:
The price was supported by a trendline, but after forming a consolidation range near this Resistance, it has broken down, indicating potential bearish momentum. The breakdown suggests that the buyers were unable to hold the trendline, and selling pressure has increased.
Forecast:
A sell opportunity is anticipated as the breakdown below the trendline and range indicates a shift in market sentiment toward the downside.
Key Levels to Watch:
- Entry Zone: Consider entering a sell position after a retest of the broken trendline or consolidation range as resistance.
- Risk Management:
- Stop Loss: Placed above the retest level or recent swing high to manage risk.
- Take Profit: Target the next support levels or Fibonacci retracement areas for potential downside targets.
Market Sentiment:
The breakdown of the trendline support signals bearish sentiment, with further downside likely if the price remains below the retest level. Proper confirmation is recommended before entering the trade.
Massive Reversal Incoming? USDCAD Showing Exhaustion Signals!(Apologies if the video is hard to understand—I bit my tongue during boxing sparring this morning!)
USDCAD has been on an incredible 17-week rally, but the price now appears extremely overextended and is showing signs of exhaustion.
Yesterday's NFP report brought a huge upside surprise, fueling a strong USD rally against all major currencies. While EURUSD, GBPUSD, NZDUSD, and AUDUSD all hit multi-year lows, USDCAD initially spiked higher but then sold off sharply, closing the day just above 1.44.
This marks the first clear sign of buying exhaustion—despite USD strength across the board, USDCAD failed to make new highs.
Additionally, this week’s candle formation caught my eye. It looks like a classic hanging man pattern, which typically appears at the top of a move, signaling an imminent reversal.
Zooming into the daily charts, we can see a clear distribution range forming, with sideways price action after a strong rally. The MACD is showing divergence, and recent price increases have been accompanied by negative volume—another strong indicator of a potential reversal.
As explained in the video, I see two likely scenarios for entering this trade:
False Breakout: A spike above the distribution range, potentially towards or just above 1.45, followed by a sharp sell-off. This would be my preferred entry.
Big Red Candle: A strong bearish candle early next week, signaling it’s time to enter short.
For this position, my first target is the previous monthly resistance at 1.405, and my second target—more likely—is 1.385, which is now a support level.
While I expect some bounce at these levels, I believe the longer-term move will see USDCAD fall back into its range, with a potential drop toward 1.32 very much on the cards.
Let me know your thoughts below!

USDCAD Possible LongW1 : Bullish
D1 : Bullish
4H : Bullish Market Structure
1H : Currently Bearish
Narrative : Price is currently Coming out of weekly IMB by sweeping Previously weekly low > We had a Daily IMB in the way that got violated by 4H PA and retracing back to the 4H OB after tapping into 4H Area of struggle > 1H is currently Bearish
Entry Pattern : Currently Hourly Price action is bearish retracing back to 4H OB, after coming inside the OB we can look for some sort bullish sign to enter long position. First context target can be simply 1:2RR / Weak High. Eventually Price can attack Realtive Equal Highs on Top since there are no AOS upside.

USDCAD - ShortUSDCAD Analysis - SHORT 👆
In this Chart USDCAD DAILY Timeframe: By Nii_Billions.
❤️This Chart is for USDCAD market analysis.
❤️Entry, SL, and Target is based off our Strategy.
This chart analysis uses multiple timeframes to analyze the market and to help see the bigger picture on the charts.
The strategy uses technical and fundamental factors, and market sentiment to predict a BEARISH trend in USDCAD, with well-defined entry, stop loss, and take profit levels for risk management.
🟢This idea is purely for educational purposes.🟢
❤️Please, support our work with like & comment!❤️

USDCAD Scenario 1.1.2025In this market, I only see that if we maintain the monthly level around the price level of 1.43 and if the price wants to head towards this level, we will watch the sfp below the low and there a possible entry into long at the price where the next monthly level is located at the price of 1.45800.

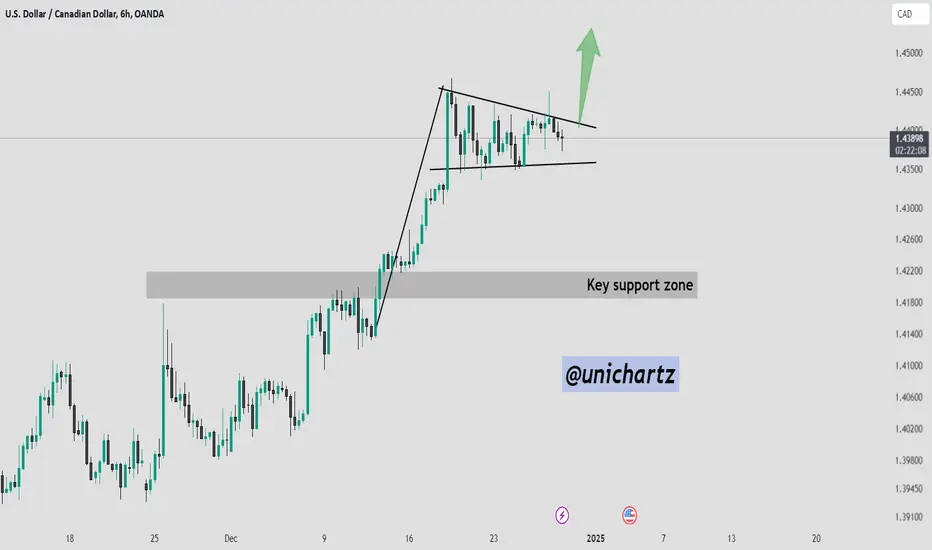
USD/CAD Bull Flag: Is 1.4500 the Next Stop?The USD/CAD 6-hour chart shows a bull flag pattern, a continuation setup that typically signals the resumption of the prior bullish trend.
Following a strong upward rally, the price has consolidated in a downward-sloping channel, characteristic of a bull flag.
A breakout above the resistance (~1.4410) would confirm the pattern, potentially driving the price higher toward the next target of 1.4500 or beyond.
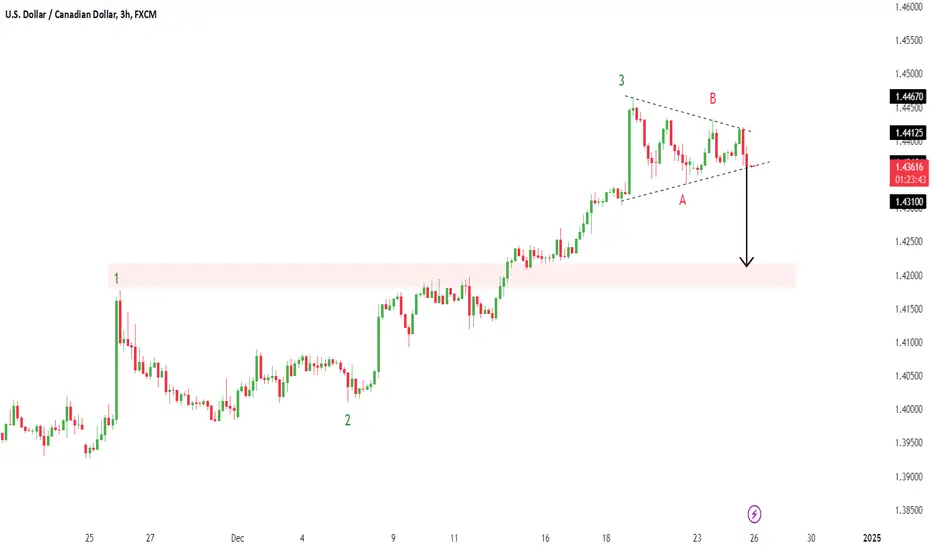
USDCADUSDCAD ( U.S Dollar / Canadian Dollar )
Symmetrical Triangle as an corrective pattern in Short Time Frame
Break of Structure
RSI - Divergence
Completed " 123 " Impulsive Waves
Change of Characteristics
USD/CAD "The Loonie" Forex Market Bullish Heist Plan🌟Hi! Hola! Ola! Bonjour! Hallo!🌟
Dear Money Makers & Robbers, 🤑 💰
Based on 🔥Thief Trading style technical analysis🔥, here is our master plan to heist the USD/CAD "The Loonie" Forex market. Please adhere to the strategy I've outlined in the chart, which emphasizes long entry. Our aim is the high-risk Red Zone. Risky level, overbought market, consolidation, trend reversal, trap at the level where traders and bearish robbers are stronger. 👀 So Be Careful, wealthy and safe trade.💪🏆🎉
Entry 📈 : You can enter a Bull trade at any point,
however I advise placing Buy limit orders within a 15 or 30 minute timeframe. Entry from the most recent or closest low or high level should be in retest.
Stop Loss 🛑: Using the 4H period, the recent / nearest low or high level.
Goal 🎯: 1.46500
Scalpers, take note : only scalp on the Short side. If you have a lot of money, you can go straight away; if not, you can join swing traders and carry out the robbery plan. Use trailing SL to safeguard your money 💰.
Warning⚠️ : Our heist strategy is incompatible with Fundamental Analysis news 📰 🗞️. We'll wreck our plan by smashing the Stop Loss 🚫🚏. Avoid entering the market right after the news release.
Take advantage of the target and get away 🎯 Swing Traders Please reserve the half amount of money and watch for the next dynamic level or order block breakout. Once it is resolved, we can go on to the next new target in our heist plan.
💖Supporting our robbery plan will enable us to effortlessly make and steal money 💰💵 Tell your friends, Colleagues and family to follow, like, and share. Boost the strength of our robbery team. Every day in this market make money with ease by using the Thief Trading Style.🏆💪🤝❤️🎉🚀
I'll see you soon with another heist plan, so stay tuned 🫂
