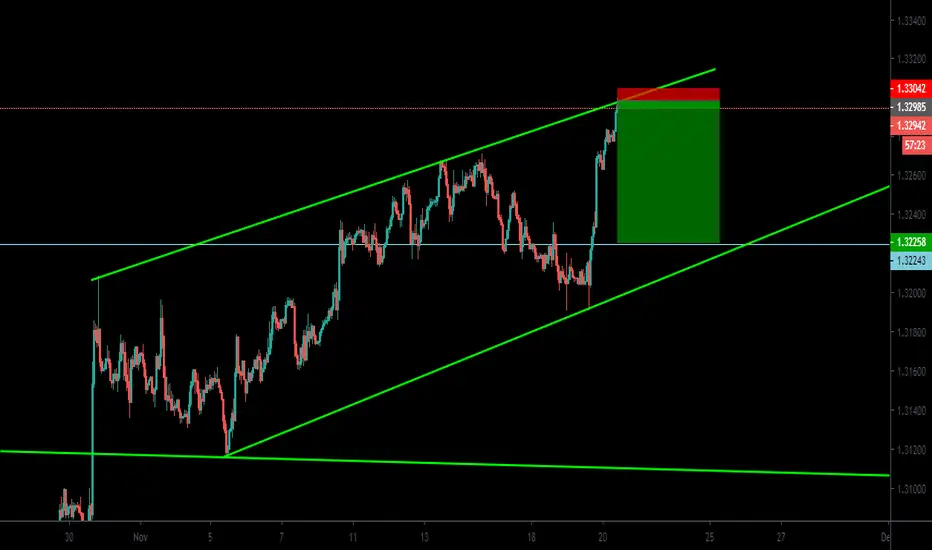
USDCAD might reverse very soonUSDCAD is facing stiff resistance at the 1.3300-1.3340 area which is expected.
At this point, both the sellers and buyers are on the sidelines waiting for a move to happen.
In my opinion, price will reverse very soon. However, there might be a fake breakout of the resistance level to generate some liquidity before dropping.
I have already executed sell orders and I will look to add some more if I see rejection or a fake breakout at the resistance
Usdcadidea

Trading Pathways Analysis of USDCAD H4 Chart
The outlined white arrow pathway is the predicted pathway that the USDCAD will follow in the coming days or weeks. Using my unique charting methods, I have been able to arrive at HIGH PROBABILITY turning points where USDCAD will turn.
PLEASE NOTE THE ABOVE ANALYSIS IS FOR EDUCATIONAL PURPOSES ONLY. THEY ARE NOT DIRECT INSTRUCTIONS TO TRADE AND ANY LOSS INCURRED BY FOLLOWING THIS ANALYSIS IS AT YOUR OWN RISK.
Eiseprod of Trading Pathways


USDCAD Sell Plan after a successful 320 pip Buy TradeAfter a 300+ pip profitable Buy Trade on USDCAD(idea link attached), I am back with a sell set-up.
As you can see, USDCAD is approaching a strong Resistance Area. So, it's a good idea to be prepared with sell scenarios.
My plan is to watch the daily price action in the 1.3300-1.3350 area.
If I see an exhaustion of the bullish move or a sharp bearish impulse in this area in the 1H/4H timeframe, I will go short.
Traders can look for sell entries between 1.3300-1.3350 with SL above 1.3400.
Sellers can take profit at 1.32, 1.3110 and 1.2980 respectively.

USDCAD - Waiting...I think we have to wait for a correction, then make a decision, because we are in a huge downtrend in 1D.

My Idea on USDCAD for the weekIm looking for buys but first Im specting price to reach heavy zones of rejection also keeping on mind the reversal patterns

USDCAD Break and retestThis Pair has broken out of a strong support zone with a bearish engulfing with a retest happening on the h1 where dojo candles are forming showing rejection of the zone.
Confirmations for trade:
Bearish engulfing breaking support.
Retest candles on H1
H4 and H1 MA showing bearish volume in market
NY open under support becoming resistance.

USDCAD LONG TERM SELL-WEEKLY CHARTUSDCAD
This pair felled more then 4% in 2019 and the bearish trend will continue in 2020 also and the recent tensions in middle east also supports the oil prices and this will benefits the CAD pairs also. We can sell after the short term pullback at 1.30970 and potential take profit will be 1.28930. Stop lose may placed at 1.32020.
This pair trading in a downtrend channel

USDCAD (Potential 40 pips - 70 pips)USDCAD (Potential 40 pips - 70 pips)
This my personal view for USDCAD..MY VIEW in DOWN
Red Line = Stop Loss
Green Line = Best Entry Sell
Green Line = Take Profit

USDCAD Long | Wait for break and retestHello Bunny's, here is my analysis for this pair. This pair will be in my watchlist you guys should too. Let me know in the comment section if you guys have any questions.
FX:USDCAD

USDCAD Possible PULLBACK - Short-term Trade Idea - BUYMy thoughs on USDCAD.
Included below is a rough chart on a 4H Timeframe, including possible areas of resistance;

USDCAD LONG @ DAY CHARTUSDCAD
Due to the trade deal truce the oil prices are shoot up because of that the CAD also gaining some positive momentum at this time
In day chart the 100EMA and 200EMA has crossed towards downward this will attract more sell
The next target for bear is 1.30400 level
From this pint we can initiate the buy orders
And the potential take profit will be 1.33300 its around 290 pips
Stop lose may placed at 1.29900 level for high risk reward ratio
leave your valuable comments..

The Looney Continues to Bargain in FlatThe technical picture on the USD/CAD currency pair is still ambiguous.
A temporary low is formed at 1.3115 in USD/CAD and intraday bias is turned neutral first. Further fall is expected as long as 1.3205 holds. A clear break below 1.3115 (38,2% Fibo retracement on the daily chart) will resume the decline from 1.3327 and target 1.3042 key support. Sustainable move there will bring larger bearish implication.
On the upside, above 1.3205 (Friday high) minor resistance will turn bias back to the upside for re-test of 1.3327 resistance instead.
Our Buy trading is still active. Do you trade that pair and how?


Bullish positioning on CAD is slowly diminishingUSD still enjoys high carry 2.6% vs EUR over, making short USD positioning unattractive. No currency in the G10 FX space offers a higher yield than the dollar.
Market expectations earlier in the year that policymakers will not be able to fulfill their tightening ambitions turned to bets that the next move in interest rates will be down as the economic outlook deteriorated while the trade war saga dragged on.


USDCAD: Triangle Completion Could Indicate Long TradeWe may have a possible contracting triangle scenario if price drops from 1.3310. Price is still on the trajectory to reach the TP projection of the Garltey pattern @ 1.3415. A clear uptrend and with clear structure formation. Wait for confirmation before looking for any buy setups.


USDCAD Short > H3USDCAD short setup
> Wait for bearish price action
> Short
Trading CFDs on margin carries high risk.
Please ensure you fully understand the risks.

#USDCAD, Despite the increases...The above model speaks for itself but we will add some points anyway!
We already had 3 encounters with the diagonal resistance line and everyone responded in descents, and at this moment we are a few pips from the resistance!
The Stochastic indicates Overbought
We have a start of a red Ichimoku cloud that warns of a downward trend.
Target: 1.32
If usdcad breaks the resistance this signal will be canceled


USDCAD - Forex Majors | Elliott Wave Patterns | November 2019USD/CAD - Elliott Wave Technical Analysis
Structure & Degree: Primary Degree B (red) Complex Structure, Double Three
- Intermediate (W) (purple): Semi Complex Flat within Minors ABC (blue)
- Intermediate (X) (purple): Complex Flat within Minors WXY (pink):
Semi-Impulsive Minor A (blue)
Bull-Flag (Double Three) Correction in Minor B (blue)
Bullish Impulse in Minor C (blue)
Current Position & Pattern:
- 3 of 3's within Minor C (blue)
Expected Swing:
- Bullish Impulse in Minute iii (green)
Technicals & Confirmations:
- Double Top on Intermediate (W) (turquoise) starting points
- 50% or 61.8% Fibonacci Retracements of Minuettes (i) & (ii) (black)
- 61.8% Fibonacci Extensions of Minors A & B (blue)
- Reversed Bullish Divergence on the Ascending Channel
- Bullish Harmonic Structure
