USDCAD Analysis# USDCAD
> Chart: H4
> Trendency: Down
> Rtrench Fibo 0.50 level
> Toward to Lower Low
Usdcadidea

USCAD: Are the buyers coming inthe daily time frame has built a falling wedge.
are we expecting a reversal or a breakdown.
keep an eye on the pair.
do not miss out


pullback and continue of uptrendits good opportunity to buy USD at this level
in dip and its near strong upward Trendline

My Idea on USDCAD for the following weekOn USDCAD I'm looking for a long BUY, but first If we respect the 50% will be placing SELLS to go retest the .31500 zone, then swinging all the way back to .3211 there will wait for confirmation to the upside or downside

My Idea on USDCAD for a couple of days Im seeing a bearish trend on USDCAD but we also got a wick fill at .33821 on Daily so untill I see confirmation of a reversal Ill be entering sales ( Feel free to leave a comment )

USDCAD SELL TP_1.3073_1.42%_0.0188pips_SL_1.3327_0.49%_0.0065pipUSDCAD SELL TP_1.3073_1.42%_0.0188pips_SL_1.3327_0.49%_0.0065pip


Potential 140 Pips Ride South!(Trade Idea)Lets hope the major news releases for this pair on Wednesday don't make a mess of things.

START OF THE WEEK (9 Sep - 13 Sep 2019) GUIDE | DOWN!See chart for illustration.
This is a follow up ( see link below for reference purposes)


USDCAD OBEYS SELL OPPORTUNITYDon't miss tomorrow's opportunity. Whatsapp me for great signals, +254748235744


USDCAD - EDUCATION - 25. AUGU. 2019Welcome to our weekly market Breakdown (USDCAD)!
1 HOUR
Sideways waving market structure.
4 HOUR
Slowly rising market with several pullbacks and low pressure.
DAILY
Bullish market found its resistance in my opinion.
OVERALL
Two very likely scenarios in usdcad this week, depending on price action on monday
prices should fake a breakout either to the upside or below previous week support zone.
I will update you about everything, be patient :)
Good luck
-
Leave us a comment or like to keep our content for free and alive.
Have a great week everyone!
ALAN

#USDCAD, Analysis+SignalBear trend.
You can see in the graph above that the average line moves 200 very reliable which means that the usdcad above the line is worth buying and when the usdcad below is worth selling.
This is already the second time that usdcad is trying to rise above the trend line with no success.
Target: 1.3175


USDCAD, pullback to cloudD1
-->> resistance spotted
-->> pullback to cloud
--->> expect huge downward movement if it fail to break the cloud


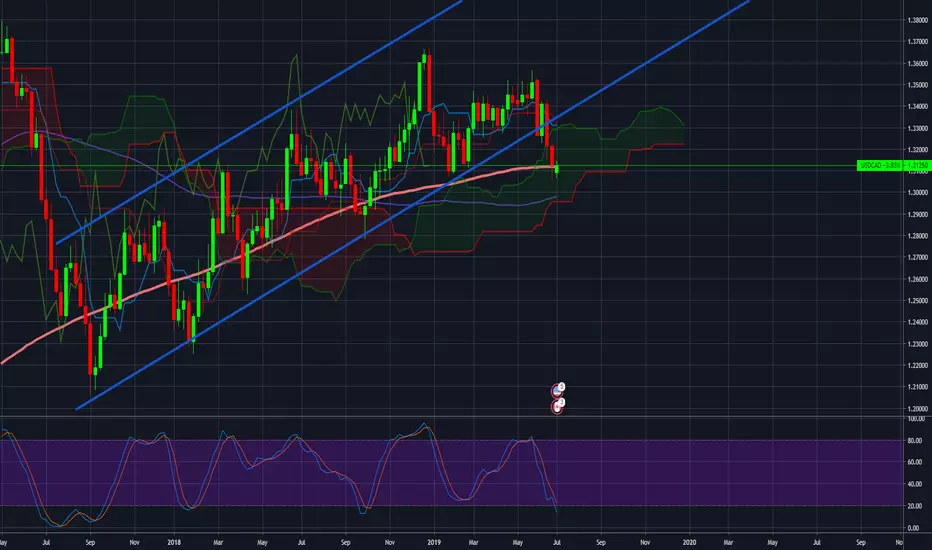
The bulls coming back? #USDCADSo it's true that the usdcad has gone out of the rising channel but you can not ignore the current situation.
In the weekly chart, the USDCAD is still on the rise.
You can see that currently the usdcad is supported by the support of the Ichimoku cloud, so long as we stay above the cloud it is a positive sign.
And in the end, we left the most important point- crossing of the Stochastic in the zone which indicates an oversold with the potential reversal of the trend.
Target: 1.32-1.3280

USDCAD LongUCAD is in a clear sell on the weekly timeframe. However, the daily MACD shows the moving averages touches with a possible crossover to the upside. The 4hr shows a slight move to the upside but closely approaching the 50EMA zone at 1.311. Will look to see what price does here. Will take long position if price breaks the EMA and retests. Also, divergence on the 4HR starting at 062019 til current. Price has broken the 1HR and 15MIN EMA's but has not retested, therefore this breakout could be a fakeout. Will continue to watch price.

The last increase is a change in trend or just correction#USDCADOnly in the weekly graph are we still on the upward trend, in all other chart times (H4, D1, MN), the model has changed to a bearish model.
The USDCAD was stopped at 1.3090 because of the support we have there.
The Stochastic is currently at Oversold.
Short term: The USDCAD can rise to 1.3170 / 80
Long term: 1.2950