Usdcadidea

USDCAD: Buy at DIPS near SUPPORTWill be looking at the PRICE ACTION near support. There are two SUPPORTS, one at 1.3380 and the other at 1.3338.
I will be looking for BUYs if price reaches these SUPPORT LEVELS and target 1.3520 as TP.

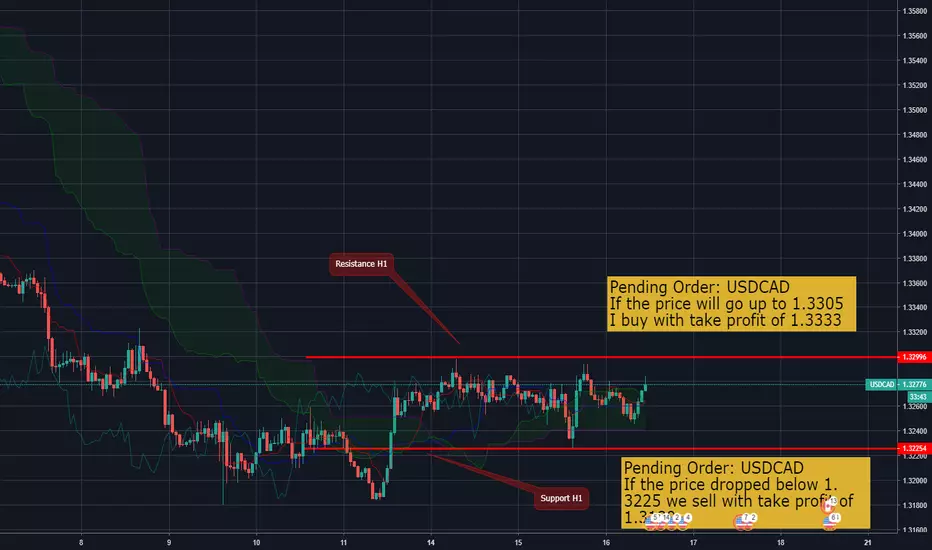
USDCAD Potential Short From Current Level?Hi everyone. Please refer to the image. Beware of CAD news coming out tonight (SEA time). It might move the pairs then. For now its still not moving much. Maybe waiting for news data.
TAYOR and all the best traders!
KHALID HAMID

USDCAD 4H Long Now?Hello guys. Please refer to the image. This is what I see for USDCAD.
After a nice drop following my previous analysis, I'm going for a long because the resistance has been retested multiple times, making it weaker. Usually, price will go back there to break it.
Let's see. Don't forget to put a risk on your trade. TAYOR!
KHALID HAMID @ tfspriceaction


USDCAD Quick ScalpPrice has been pushing down while forming LHs and LLs on the smaller time frame, my entry was based on the H4 close which broke 1.34200 and pushed up for liquidity forming another LH on H1 as it retested it's broken support. My goal is to ride the current market momentum to the daily demand zone for a 1:3.

USD/CAD Technical Analysis: Short Bullish Mood 1.3400 and 1.3440 In the H4 chart, USDCAD is expected to test the 3/8 level, rebound from it, and then falling towards the support at the 0/8 one.The lines in the H4 and H1 charts are completely the same and confirm the scenario described above. 50-day and 100-day simple moving average (SMA) near 1.3350/40 could restrict the pair’s near-term declines, a break of which can recall sub-1.3300 area on the chart.
On the upside, 1.3445/50 and 1.3470 seem nearby resistances to overcome in order to aim for 1.3520 number to the north.
USDCAD H4 200 ma 1.3370 level and Strong Technical level so take a short buy position Target 1.3400 and 1.3440 Area.
Down side of USDCAD Sell Position is 1.3460/1.3520 and 1.3660 level .Broad USD selling ahead of FOMC pleases Loonie bears. Comments from BOC’s Poloz and PMI are also in the limelight.
Upbeat industrial production and comments from the Bank of Canada’s (BOC) Governor Stephen Poloz helped the Canadian Dollar (CAD) take better advantage of the US Dollar’s (USD) weakness and ignore sluggish GDP figure from Canada.
News:
======
The USD/CAD pair rose to a session high of 1.3468 with the loonie coming under strong selling pressure after the data published by Statistics Canada showed that the Canadian economy contracted by 0.1% in February. However, the pair lost its bullish momentum in the last hour following some optimistic comments from Bank of Canada Governor Poloz and was last seen trading at 1.3416, losing 0.31% on a daily basis.
Technical Level:
==============
Previous Weekly High 1.3522
Previous Weekly Low 1.3335
Previous Monthly High 1.3469
Previous Monthly Low 1.313
Daily Fibonacci 38.2% 1.3455
Daily Fibonacci 61.8% 1.3465

USDCAD - Buy Opportunity - Rejection of D SupportFX_IDC:USDCAD
I am demo trading and documenting my progress. This is not intended to be a sell signal !
Wedge Structure on 1H
Retest of Daily Support and bounce off 1.3330 - Buy prediction on 4H and 1HR with SL set at daily support
Buy at CMP - 1.3340
SL - 1.3330
TP - 1.3370

USDCAD - Ascending Structure H4 - BUY At Support ZoneOANDA:USDCAD
I am demo trading and documenting my progress. This is not intended to be a buy signal !
Ascending Trendline Structure on 4H
Possible Retest of 4H Support - Currently Competing M Structure - Buying At Support Zone
Buy Limit - 1.33200
SL - 1.3247
TP - 1.3617

USD/CAD Respecting more UP-TREND momentum to come? (DAILY)I can see this move play out on USD/CAD Daily chart, slight pull back nothing major and a retest at trend line resistance and Daily resistance zone!

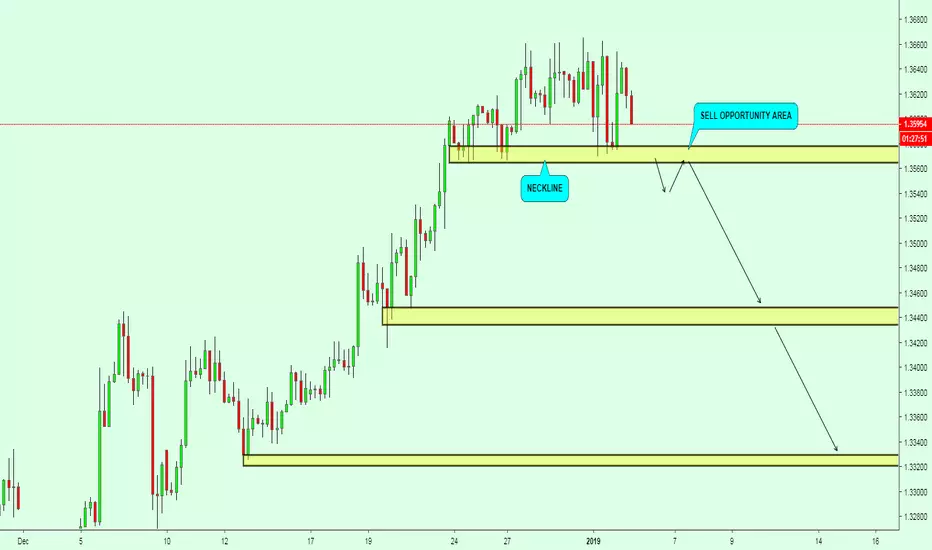
Beware SqueezeBoth fundamental and technical analysis confirm an imminent downward move. Beware the short squeeze as the institutional traders try to vacuum up all the 'dumb money'.


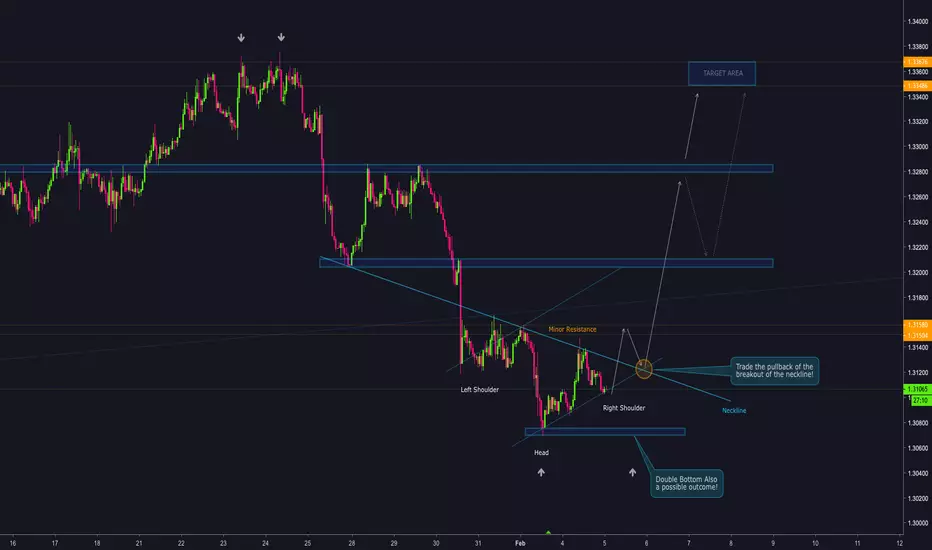
INV HEAD AND SHOULDER! (BUY)Inverted Head and Shoulders in USDCAD!
-Wait for the breakout of the neckline for confirmations!
ALSO:
Possible outome #2: DOUBBLE BOTTOM!
- Be carefull with bear traps ;)
USDCAD Completed Bullish Bat PatternUSDCAD Completed Bullish Bat Pattern
Hi Guys. Watch bottom for long. Good luck. Please support the setup with your likes, comments and by following on TradingView.

USDCAD 4HR/D Buy SetupPull back is expected and therefore enter when price is in between 1.32000 and 1.32300
I will place a partial entry now as well, just in case if pull back do not occur.
TP1 1.33250
TP2 1.34400
TP3 & TP4; see charts
SL 1.31500 + your broker spread

USDCAD is setting up for big bullish rideWait for my updates.
Please support the setup with your likes, comments and by following on Trading View thanks


USD/CAD, still on his strong bullish trendHi guys !
USDCAD is on bullish way and is about to break clearly the 1.32 resistance. Since two weeks, the price is closing above all the MA (10, 20, 50, 100 & 200) on D3 scale.
My first target for USDCAD is 1.35 with a potential rejection there.
Thanks for your time guys !

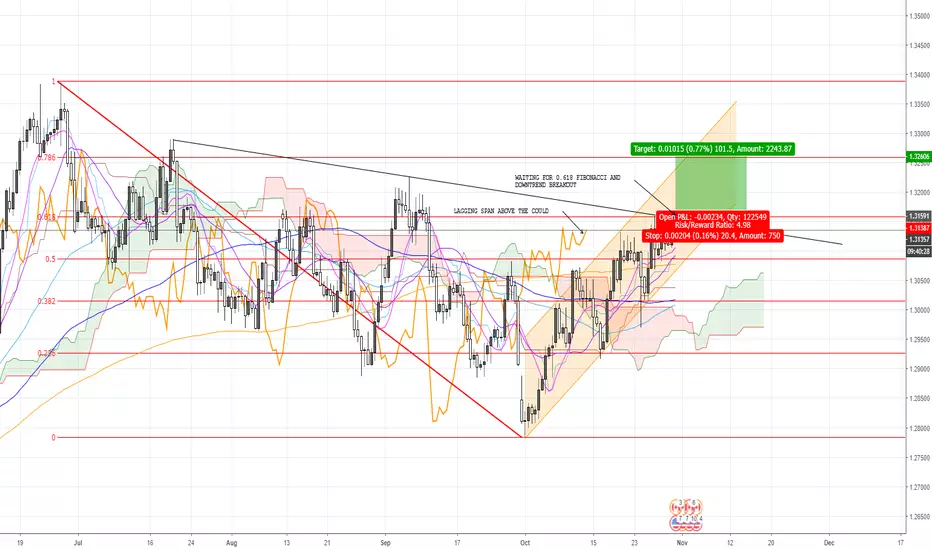
USD/CAD, waiting for 0.618 Fibonacci Hi guys !
USDCAD looks bullish with indicators on green. My entrys is only if the price reach the 0.618 Fibonacci retracement with a target at 1.3260 (0.786 Fibonacci).
Currently, the support is at 1.30850, with 50 % Fibonacci and above MA10, 20, 50, 100, 200.
Furthermore, the lagging span is above the cloud and confirm an eventual new run.
Thanks !