USDCAD testing major support, potential bounce!USDCAD is testing major support at 1.2636 which is a fibonacci retracement, extension and overlap support level. We can see good price action at that area too. What is nice to see is that multiple RSI bounces has occurred that corresponded with price bouncing around this level too.
Our major resistance is at 1.2726 which is a major swing high resistance level and a fibonacci extension level.
Usdcadidea

USDCAD has broken major resistance, potential bullishness!USDCAD has broken a major resistance-turned-support line at 1.2559 which now serves as major support for a potential bounce towards 1.2645 (100% ABC Fibonacci extension, 78.6% Fibonacci retracement, horizontal swing high resistance).
RSI (55) also sees a recent bullish exit signalling a change in momentum from bearish to bullish. This is in line with the potential rise in price.

Buy USDCAD Longterm Based on Multi Timeframe Trend ContinuationThis research is for informational purposes and should not be construed as personal advice. Trading any financial market involves risk. Trading on leverage involves risk of losses greater than deposits.
Please comment below and Like if you agree with my analysis.
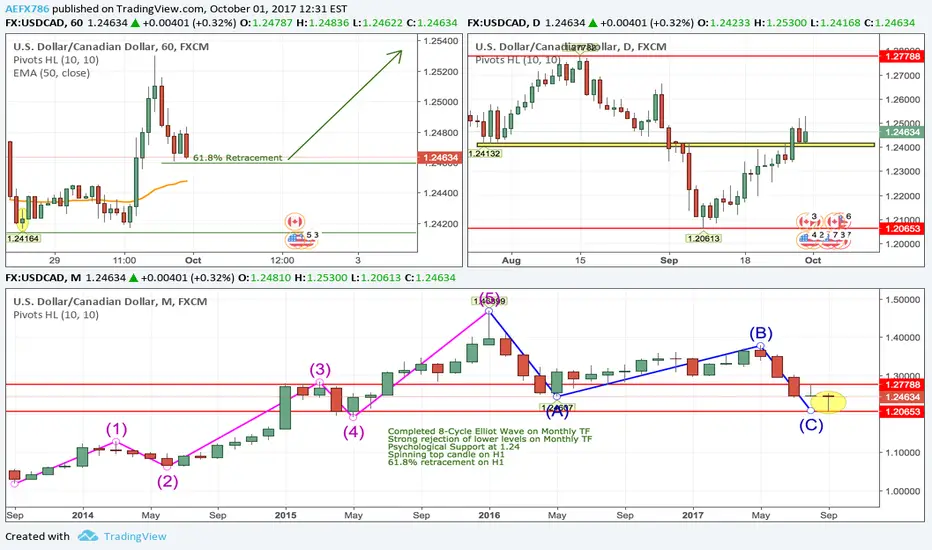
Short USDCAD Longterm Based on Multiple TimeframesThis research is for informational purposes and should not be construed as personal advice. Trading any financial market involves risk. Trading on leverage involves risk of losses greater than deposits.
Please comment below and Like if you agree with my analysis.

Buy USDCAD Short Term Based on 15min TF Bullish Harmonic GartleyThis research is for informational purposes and should not be construed as personal advice. Trading any financial market involves risk. Trading on leverage involves risk of losses greater than deposits.
Please comment below and Like if you agree with my analysis.

USDCAD Short Long Term Based On H4 + Daily Timeframe BreakoutThis research is for informational purposes and should not be construed as personal advice. Trading any financial market involves risk. Trading on leverage involves risk of losses greater than deposits.
Please comment below and Like if you agree with my analysis.

Buy USDCAD Short Term Based On H4 Consolidation BreakoutThis research is for informational purposes and should not be construed as personal advice. Trading any financial market involves risk. Trading on leverage involves risk of losses greater than deposits.
Please comment below and Like if you agree with my analysis.


USDCAD approaching major support, prepare to buyBuy above 1.2966. Stop loss at 1.2893. Take profit at 1.3164.
Reason for the trading strategy (technically):
Price is dropping strongly towards major support at 1.2966 (multiple Fibonacci extensions, horizontal swing low support, Elliott wave theory) and we expect a bounce above this level to at least 1.3164 resistance (Fibonacci retracement, horizontal pullback resistance).
Stochastic (34,5,3) is seeing major support above 1% where we expect a bounce from.


USDCAD dropping perfectly, remain bearishSell below 1.3482. Stop loss at 1.3543. Take profit at 1.3387.
Reason for the trading strategy (technically):
Price continues to drop perfectly towards our profit target and has made a nice bearish exit signalling that a change in momentum is expected. We remain bearish looking to sell below 1.3482 resistance (Fibonacci retracement, pullback resistance, swing high resistance) for a further push down to 1.3387 support (Fibonacci extension, horizontal swing low support, Elliott wave theory).
RSI (55,5,3) is seeing strong resistance below the 55% level where we expect to see further bearish movement. We also see a recent bearish exit signalling that a change in momentum to bearish is expected.

USDCAD remain bearish below major resistanceSell below 1.3540. Stop loss at 1.3595. Take profit at 1.3431.
Reason for the trading strategy (technically):
Price is seeing major resistance below 1.3540 (Fibonacci retracement, Fibonacci extension, horizontal swing high resistance, Elliott wave theory) and we expect to see further bearish movement below this level to at least 1.3431 support (Fibonacci retracement, horizontal swing low support).
RSI (55,5,3) is seeing strong resistance below the 55% level where we expect to see further bearish movement.

USDCAD - COMING DOWNTOWN! Price just this past week hit a key support area on the daily chart, now we just need a little bit of patience for price to give us the right confirmation for it to come to show signs of continuation to the downside. BE DISCIPLINED AND WAIT!
Click to join: t.me
Need one on one guidance? Let a trader help!
www.blueprintforex.com


USDCAD Weekly View: Remain bearishSell below 1.3180. Stop loss at 1.3600. Take profit at 1.2500.
Reason for the trading strategy:
We remain bearish below 1.3180 resistance (Fibonacci retracement, bearish pullback) especially with the break of our long term ascending-turned-resistance line signalling a bearish exit to be seen for a drop towards at least 1.2500 support (major swing low support, Fibonacci projection).
MACD has broken a key support-turned-resistance line signalling a drop is expected.

USDCAD: Profit target reached perfectly, time to buy againBuy above 1.3200. Stop loss at 1.2990. Take profit at 1.3600.
Reason for the trading strategy:
USDCAD made a bounce up as expected and reached our profit target once again. We remain bullish above 1.3200 support (Fibonacci retracement) for a push up to major resistance level at 1.3600 (horizontal resistance, Fibonacci retracement).
Stochastic (21,5,3) is displaying strong bullish divergence vs price.

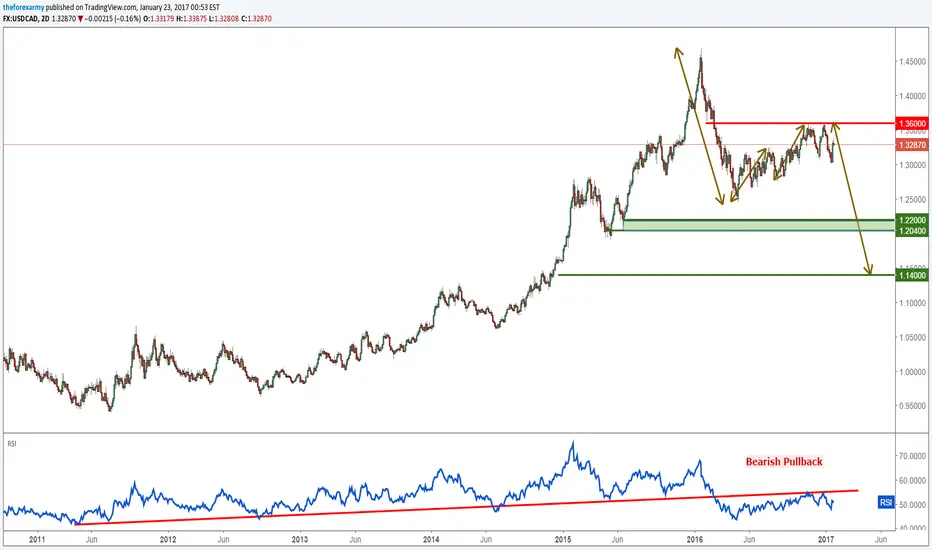
USDCAD Daily Key ElementsUSDCAD major levels of resistance:
1.3600 (Fibonacci projection, Fibonacci retracement, horizontal overlap resistance, swing high resistance)
USDCAD major levels of support:
1.2200 (Fibonacci retracement, swing low support)
1.2040 (Fibonacci retracement, Fibonacci projection, swing low support)
1.1400 (Fibonacci projection)
USDCAD technical indicators:
RSI (34) has made a bearish pullback to its resistance line where we expect another reaction from.