USDCAD Trading plan - 25/may/2024Hello Traders,
Hope you all are doing good!!
I expect USDCAD to go Up correctively.
Look for your BUY setups.
Please follow me and like if you agree or this idea helps you out in your trading plan.
Disclaimer: This is just an idea. Please do your own analysis before opening a position. Always use SL & proper risk management.
Market can evolve anytime, hence, always do your analysis and learn trade management before following any idea.
Usdcadidea

USDCAD Top-down analysis Hello traders, this is a complete multiple timeframe analysis of this pair. We see could find significant trading opportunities as per analysis upon price action confirmation we may take this trade. Smash the like button if you find value in this analysis and drop a comment if you have any questions or let me know which pair to cover in my next analysis.

USDCAD (Bearish idea)USDCAD appears to be going bearish at this time. Due to the 2 strong impulses and small correction. I will go short on this pair ONLY if the following criteria is met.
- Price returns to the previous level of support with candlestick confirmation
- Fibonacci levels enter the 61.8% zone.
*always remember to use proper RISK MAANGEMENT*

USDCAD Pair : USDCAD ( U.S Dollar / Canadian Dollar )
Description :
Break of Structure
Head and Shoulder
Bullish Channel as Corrective Pattern in Short Time Frame
RSI - Divergence
Completed " 1234 " Impulsive Waves

USDCAD- Short IdeaEntry: Price broke through the swing low and the trendline with volume. Entry at the bearish zone.
Stop Loss: Slightly above the bearish zone. Give stop loss some room to breathe.
Take Profit: At TP, the nearish bullish zone.

USDCAD next MovePair : USDCAD ( U.S Dollar / Canadian Dollar )
Description :
Bullish Channel as an Corrective Pattern in Long Time Frame
Break of Structure
RSI - Divergence
Completed " 12 " Impulsive Waves
Demand Zone

USDCAD is going to Tank down but when..So to break this trade down down properly I started by looking on the daily time frame and saw there was a bullish liquidity purge, came down to our 1H time frame to confirm that we are indeed inside of a order block and to be clear about this particular setup its the "Holy Grail" or Elliot wave pattern. To see things a little more clear I've used the 15 or 5 MIN time frame to spot out the distribution and accumulation phases and liquidity has been swept from March 19th. I'd look for a 5 Min entry at 1.36127 and target the very bottom consolidation at 1.34558. SL at 1.36146. To maximize any profits trail stop losses!! secure the BAG and good luck!

USDCAD H4 ProjectionPrice moving near supply zone area Initiate short positions near the zone after confirmation by bearish price action structure.GOOD LUCK.

USDCAD Short Term Sell IdeaD1 - Bearish trend pattern followed by a pullback.
Price reached a strong resistance zone and is bouncing lower.
Bearish divergence.
H1 - Lower lows.
No opposite signs.
Until the strong resistance zone holds I expect the price to move lower further after pullbacks.

USDCAD Trade IdeaMarket Analysis: USDCAD on the Daily Time Frame
The USDCAD currency pair has exhibited a notable upward trend on the daily time frame. This trend is characterized by a consistent pattern of higher highs and higher lows, indicating bullish momentum. Additionally, there is a clear breakout (BoS) to the upside, further supporting the bullish bias.
As we anticipate a retracement in price, it’s essential to consider the impact of upcoming calendar events throughout the week. These events can introduce volatility and potentially influence the pair’s movement.
Given the technical context, my bias leans strongly toward a bullish entry near the fifty percent Fibonacci retracement level. I recommend placing a wide stop-loss at 1.34400 to allow for market fluctuations. Our target should align with the previous highs as we capitalize on the ongoing bullish trend.
Remember to monitor the economic calendar closely and adjust your strategy accordingly. Happy trading!

USDCAD Trading Plan - 20/Feb/2024Hello Traders,
Hope you all are doing good!!
I expect USDCAD to go Down after completing this correction.
Look for your SELL setups.
Please follow me and like if you agree or this idea helps you out in your trading plan.
Disclaimer: This is just an idea. Please do your own analysis before opening a position. Always use SL & proper risk management.
Market can evolve anytime, hence, always do your analysis and learn trade management before following any idea.

USDCAD Short From Resistance!USD-CAD will soon hit
The horizontal resistance
Of 1.35257 from where
We are likely to see
A local bearish correction !

USDCAD BUY | Day Trading AnalysisHello Traders, here is the full analysis.
The completed correction, recovery and formation of a pre-breakout set-up hint at the continuation of growth. GOOD LUCK! Great BUY opportunity USDCAD
I still did my best and this is the most likely count for me at the moment.
Support the idea with like and follow my profile TO SEE MORE.
Traders, if you liked this idea or if you have your own opinion about it, write in the comments. I will be glad 🤝
Patience is the If You Have Any Question, Feel Free To Ask 🤗
Just follow chart with idea and analysis and when you are ready come in THE GROVE | VIP GROUP, earn more and safe, wait for the signal at the right moment and make money with us💰

USDCAD Pair : USDCAD ( U.S Dollar / Canadian Dollar )
Description :
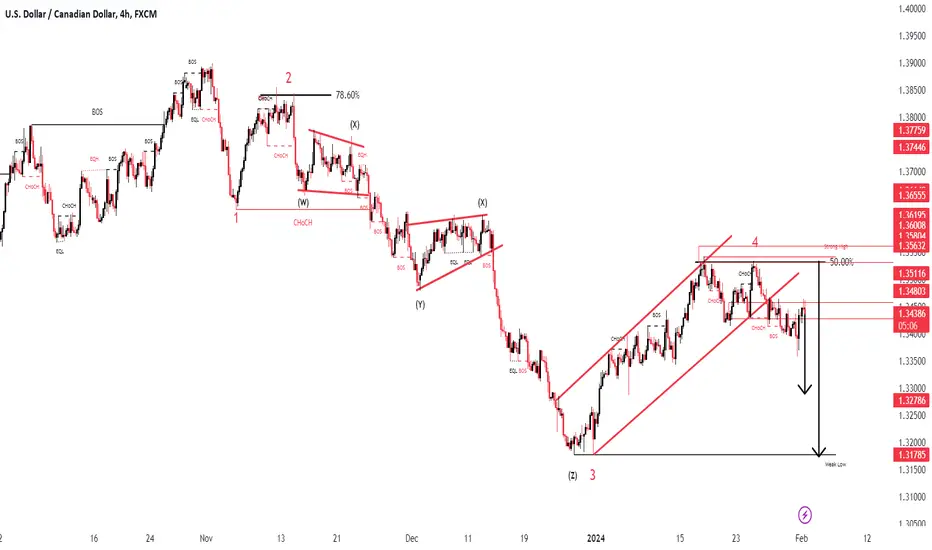
Completed " 1234 " Impulsive Waves and Rejection from Daily Demand Zone or Fibonacci Level - 50.0%. Bullish Channel as an Corrective Pattern in Short Time Frame with the Breakout of the Lower Trend Line. Strong Divergence in RSI and Break of Structure
USDCAD Local Short! USD-CAD went up to retest
The horizontal resistance
Of 1.34272from where
I think we will see
A local move down !

USDCAD - Short IdeaThe USDCAD pair has overbought conditions and Canadian dollar gains strength on strong crude oil prices, which indicates a potential downside move for USDCAD.

USDCAD 23/01 Pair : USDCAD ( U.S Dollar / Canadian Dollar )
Description :
Completed " 12345 " Impulsive Waves and " A - 1234 " Impulsive Waves. Falling Wedge as an Corrective Pattern in Short Time Frame with the Breakout of the Upper Trend Line and Retracement. Break of Structure and Retracement.

USDCAD H4 / PERFECT HIT OF THE OB / SHORT TRADE ACTIVE ✅Hello Traders!
This is my idea related to USDCAD H4. I see a small accumulation at the moment, I expect a bearish move taking into consideration this accumulation in the area of the OB.
The target is before the FVG.
Follow, like, and comment to see my content:
www.tradingview.com

USDCAD Trade IdeaThe USDCAD has reached a pivotal juncture,reaching into a critical resistance level. While the larger trend remains firmly bullish, I anticipate a temporary pullback before seeking an optimal entry point.
1D Balance Area: As you can see on the attached chart, price has formed a significant balance area on the daily timeframe at the accumulation phase. A Fibonacci retracement drawn from the low to the high reveals a confluence zone around the 61.8% level potentially offering a high-probability entry point for opportunistic longs. Note: This analysis is for educational purposes only, and I'm not dispensing financial advice. Always conduct your own due diligence before making any trading decisions.

USDCAD: New Year 2024, New Outlook! Merry Christmas Everyone,
Dear Traders,
This week we waited USD to reverse and show some strong bullish momentum though it did not, however, this week we may see some bullish price movement. It is advisable that we may see uncertain price action due to low liquidity and low volume which is result of holidays worldwide.
Good Luck and Trade Safe.

USDCAD Looking BullishIn the existing downtrend of the USDCAD currency pair, there is a distinct possibility that the exchange rate may approach and test the support level at 1.31142, unless there is a significant breakthrough in market dynamics. The technical analysis of the market structure points towards a potential pullback, implying a temporary reversal in the prevailing downward movement.
This setup could be viewed as an opportunity for traders to consider initiating buy positions. Buying at the support level involves anticipating a rebound or a corrective move in the exchange rate. Traders often look for confirmation signals, such as candlestick patterns or other technical indicators, to strengthen the rationale for entering a trade.
It's important to note that trading decisions should be made based on a comprehensive analysis of various factors, including technical, fundamental, and market sentiment indicators. Additionally, risk management strategies should be employed to mitigate potential losses in case the market does not behave as anticipated.

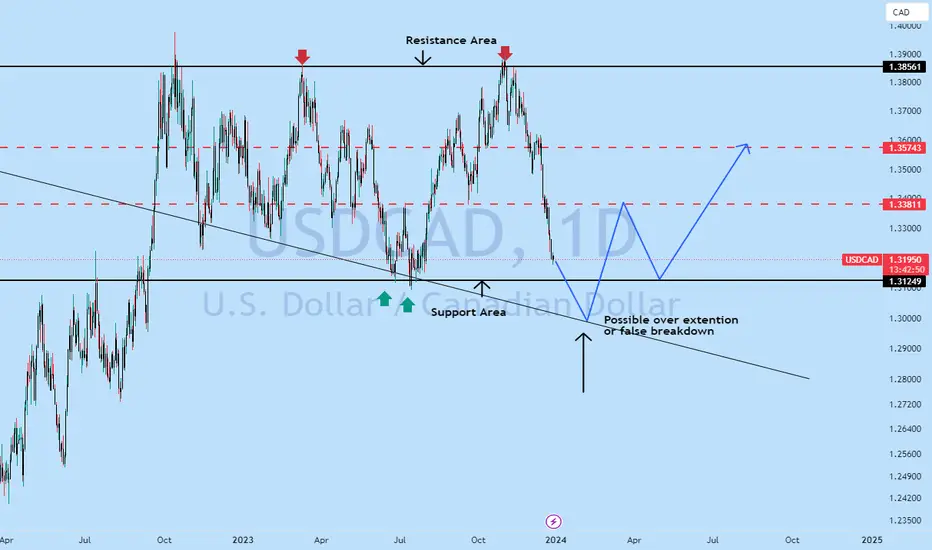
USDCAD possible buy after falsebreakdwon!The USDCAD trend remains downward, presenting a chance to test the 1.31142 support level unless a breakthrough occurs. The technical structure suggests a potential pullback, so contemplate purchasing in on Support
In the ongoing downtrend of USDCAD, there's a likelihood of testing the 1.31142 support level if no breakthrough occurs. The technical setup indicates the potential for a pullback, making it worth considering buying .
#USDCAD= Beginning of the big trade! FX:USDCAD possible downtrend to continue towards 1.3200, as price have shown significant bearish pressure in last few days of the week. while dxy remain bearish cad has gained vast majority of bullish interest and it is likely that this is just beginning of downfall for USDCAD.
Good Luck
