Usdcadlong
USDCAD: Technical rebound in short termFrom a technical point of view, it could be interesting to follow FX:USDCAD pair in the next sessions. If we look at the intraday chart Trend is bearish but at the same time, we think that at least one technical rebound around 1.3198 will happen. In conclusion, it might be interesting to accumulate long positions (buy the dip) with small sizes follow 1H Chart.
Like to support my work 💗
Trade with care!

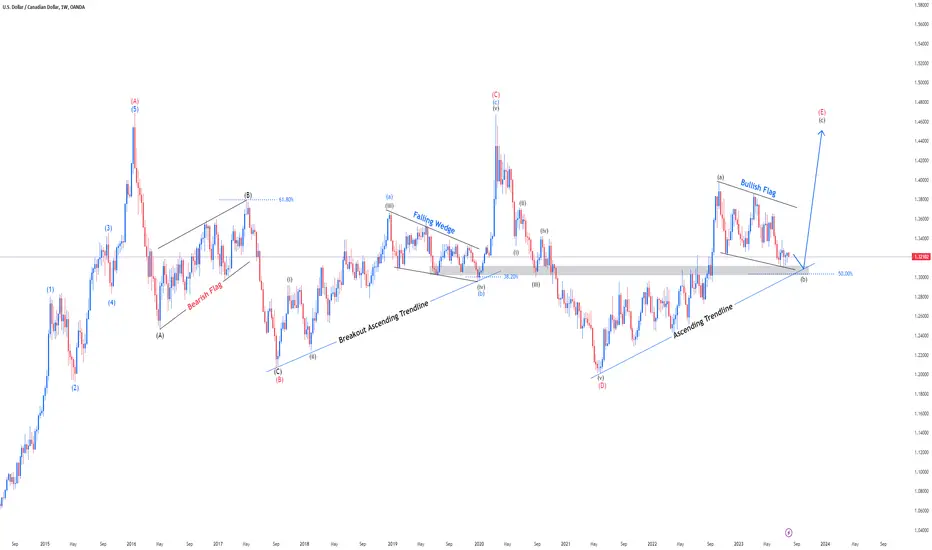
USDCAD Wedge Breakout!USD-CAD broke out of the
Narrowing wedge and
The breakout is confirmed
So I think that we will see
Some more growth !

USD/CAD Prediction on 25.07.2023In the ever-fluctuating world of foreign exchange markets, the upward trajectory of the USD/CAD pair has recently become a focal point of attention. The pair, symbolizing the value of one U.S. dollar in terms of the Canadian dollar, has embarked on an upward trend, signifying the strengthening of the U.S. dollar relative to its Canadian counterpart.
One of the principal contributors to this ascent is the contrast in the economic performance of the two nations. The U.S. economy has rebounded robustly from the COVID-19 pandemic's ravages, bolstered by an aggressive stimulus and vaccination campaign. In contrast, Canada's recovery pace has been somewhat slower, creating a divergence that has, in turn, driven the USD/CAD pair upwards.
Additionally, the different policy stances adopted by the U.S. Federal Reserve and the Bank of Canada have been influential. The Fed's ongoing monetary tightening, marked by interest rate hikes and the tapering of asset purchases, has acted as a magnet for global capital flows. In contrast, the Bank of Canada's relatively accommodative stance has resulted in a lesser demand for the Canadian dollar, further amplifying the USD/CAD uptrend.
Commodity prices, particularly oil, are another key factor impacting this pair. Canada, being a major oil-exporting country, is directly affected by oil price volatility. The recent unpredictability in oil markets and, more generally, commodity prices, has led to increased uncertainty for the Canadian dollar, providing a further boost to the USD/CAD exchange rate.
Investor sentiment and speculation also play a significant role in driving forex trends. The combination of stronger U.S. economic indicators and uncertainty about the Canadian economy has prompted investors to favor the U.S. dollar over the Canadian dollar. This has led to increased buying pressure on the USD/CAD pair, contributing to its upward trajectory.
It is worth noting that forex markets are dynamic and subject to rapid changes due to a multitude of factors. Therefore, while the USD/CAD pair exhibits an upward trend at the moment, traders and investors must remain vigilant and responsive to new economic data and geopolitical events. A clear understanding of these dynamics can help market participants anticipate potential shifts in the trend and respond accordingly.
Trading in Binary Option po7.cash

USDCAD to find support at current swing low?USDCAD - 24h expiry
Trend line support is located at 1.3125.
A lower correction is expected.
We expect a reversal in this move.
Risk/Reward would be poor to call a buy from current levels.
A move through 1.3175 will confirm the bullish momentum.
We look to Buy at 1.3125 (stop at 1.3090)
Our profit targets will be 1.3215 and 1.3240
Resistance: 1.3200 / 1.3225 / 1.3250
Support: 1.3150 / 1.3125 / 1.3100
Risk Disclaimer
The trade ideas beyond this page are for informational purposes only and do not constitute investment advice or a solicitation to trade. This information is provided by Signal Centre, a third-party unaffiliated with OANDA, and is intended for general circulation only. OANDA does not guarantee the accuracy of this information and assumes no responsibilities for the information provided by the third party. The information does not take into account the specific investment objectives, financial situation, or particular needs of any particular person. You should take into account your specific investment objectives, financial situation, and particular needs before making a commitment to trade, including seeking advice from an independent financial adviser regarding the suitability of the investment, under a separate engagement, as you deem fit.
You accept that you assume all risks in independently viewing the contents and selecting a chosen strategy.
Where the research is distributed in Singapore to a person who is not an Accredited Investor, Expert Investor or an Institutional Investor, Oanda Asia Pacific Pte Ltd (“OAP“) accepts legal responsibility for the contents of the report to such persons only to the extent required by law. Singapore customers should contact OAP at 6579 8289 for matters arising from, or in connection with, the information/research distributed.

USDCAD: What will happen next?The USD/CAD pair is hovering around 1.3175-80 after experiencing its largest daily decline in eight days. This decline can be attributed to the drop in WTI crude oil price, which is Canada's main export, as well as the stronger US Dollar. The market activity on Tuesday morning in Asia has been slow.


usdcad scalpthere is a good demand zone south the price and I think it would make the price react to it

USD/CAD continues to move higher amid a broad sell-off in commodUSD/CAD continues to move higher amid a broad sell-off in commodity-related currencies.
The Canadian dollar remained near 1.35 per USD, as investors were monitoring the latest developments on the monetary policy in both Canada and the United States. The bets increased that the Bank of Canada may be forced to resume its hiking campaign after data showed inflationary pressures remain elevated. Consumer prices rose by 4.4% annually in April, well above market estimates of 4.1% and breaking the streak of 10 consecutive months of slowing inflation amid sharp increases in mortgage costs and rent. Also, in the US, comments from several Fed officials raised expectations that the rates would remain higher for longer. Fed’s Bullard suggested the possibility of raising rates by another half-point this year, while Fed's Kashkari described the decision to pause or hike rates in June as a close call.
Canada’s government budget deficit widened to CAD 44.4 billion in March 2023, from CAD 25.7 billion in the corresponding month of the previous year. Revenues decreased by $1.8 billion, or 4.5 percent, largely reflecting the one-time Grocery Rebate announced in Budget 2023. Program expenses excluding net actuarial losses were up $15.7 billion, or 25.3 percent, largely reflecting higher provisions for contingent liabilities and loans, and increased transfers to other levels of government. Public debt charges were up $1.3 billion, or 53.3 percent, reflecting higher interest rates. Net actuarial losses were down $0.1 billion, or 9.3 percent. The government posted a budgetary deficit of CAD 41.3 billion for the April to March period of the 2022-23 fiscal year, compared to a deficit of CAD 95.6 billion reported for the same period of 2021-22.
A successful test of the resistance at 1.3640 will push USD/CAD towards the next resistance level at 1.3665. If USD/CAD climbs above this level, it will move towards the resistance at 1.3695.
R1:1.3640 – R2:1.3665 – R3:1.3695
S1:1.3600 – S2:1.3565 – S3:1.3530

USDCAD Prediction on 21.07.2023The USD/CAD pair maintains its bullish trajectory, continuing to showcase an upward trend. This signifies that market participants are expecting a rise in the value of the US Dollar against the Canadian Dollar. The bullish outlook is driven by a combination of factors, such as a robust U.S. economy, favorable interest rate decisions by the Federal Reserve, or potentially weaker Canadian economic indicators. Traders are encouraged to leverage this bullish sentiment, but also remain vigilant of any changes in market conditions, geopolitical events, or economic data releases that may affect the currency pair's trajectory.


USDCAD: stuck in a narrow range!Earlier today, the Japanese Government released updated forecasts, revealing that consumer inflation is expected to reach 2.6% in the current fiscal year. This is an increase from the previous forecast of 1.7% in January, and it surpasses the Bank of Japan's target of 2%. Additionally, the Government revised the economic growth forecast for the current year to 1.3%, down from the initial projection of 1.5% in January. It is anticipated that inflation will fall below the Bank of Japan's target range in 2024, with a forecasted rate of 1.9%.

USDCAD - Short after filling the imbalance ✅Hello traders!
‼️ This is my perspective on USDCAD.
Technical analysis: Here we are in a bearish market structure from 1H timeframe perspective, so I am looking for short. I want price to go a little bit higher to take liquidity above equal highs and to fill the imbalance, then to reject for a short position.
Like, comment and subscribe to be in touch with my content!

USDCAD: Today!The USD/CAD exchange rate is uncertain around the 1.3170-80 level early on Wednesday morning in Europe. Although the downtrend has paused for now, traders are still looking for more evidence to support buying the Canadian dollar against its US counterpart, especially after a slow Asian session.
On one hand, Canada's inflation numbers were disappointing, while the US Retail Sales data and a decline in WTI Crude Oil prices (Canada's main export) may attract buyers of the USD/CAD pair. On the other hand, positive market sentiment and concerns about the Federal Reserve's dovish stance are likely pushing the exchange rate higher.

USDCAD Top-down analysisHello traders, this is a complete multiple timeframe analysis of this pair. We see could find significant trading opportunities as per analysis upon price action confirmation we may take this trade. Smash the like button if you find value in this analysis and drop a comment if you have any questions or let me know which pair to cover in my next analysis.

USD/CAD is heading to 1.34Hello Traders
USD/CAD has sharp moves in the last few days.
We assume its an upward correction, so we treat it carefully.
Our technical view has been shown in the chart.
If you like it then Support us by Like, Following, and Sharing.
Thanks For Reading
Team Fortuna
-RC
(Disclaimer: Published ideas and other Contents on this page are for educational purposes and do not include a financial recommendation. Trading is Risky, so before any action do your research.)

USDCAD | Going UPAfter news, we can think price gonna breakout my descending line and reach 1.32.
It can go higher.

USDCAD reclaims the handle of the cup and handle...OANDA:USDCAD swept last years September lows at 1.323. As long as we remain within this yearly range again longs have the upper hand in terms of R/R.
Zooming out, USDCAD has reclaimed the handle of a very large sized cup and handle.

USDCAD selloff to stall at current levels?USDCAD - 24h expiry
Price action has stalled at good support levels and currently trades just above here (1.3150).
We expect a reversal in this move.
Risk/Reward would be poor to call a buy from current levels.
Short term RSI has turned positive.
A move through 1.3200 will confirm the bullish momentum.
We look to Buy at 1.3150 (stop at 1.3110)
Our profit targets will be 1.3250 and 1.3275
Resistance: 1.3200 / 1.3250 / 1.3275
Support: 1.3150 / 1.3125 / 1.3100
Risk Disclaimer
The trade ideas beyond this page are for informational purposes only and do not constitute investment advice or a solicitation to trade. This information is provided by Signal Centre, a third-party unaffiliated with OANDA, and is intended for general circulation only. OANDA does not guarantee the accuracy of this information and assumes no responsibilities for the information provided by the third party. The information does not take into account the specific investment objectives, financial situation, or particular needs of any particular person. You should take into account your specific investment objectives, financial situation, and particular needs before making a commitment to trade, including seeking advice from an independent financial adviser regarding the suitability of the investment, under a separate engagement, as you deem fit.
You accept that you assume all risks in independently viewing the contents and selecting a chosen strategy.
Where the research is distributed in Singapore to a person who is not an Accredited Investor, Expert Investor or an Institutional Investor, Oanda Asia Pacific Pte Ltd (“OAP“) accepts legal responsibility for the contents of the report to such persons only to the extent required by law. Singapore customers should contact OAP at 6579 8289 for matters arising from, or in connection with, the information/research distributed.

usdcad Buys This is definitely a bullish set up as this pair is still in an uptrend and has rejected from the lower key level, and once a HH close is in play on a 30m on 1h I may look for buys. Although USD is very weak on the other currencies, so In order to confirm I may wait until the NY open.

Usdcad Ready For a Bullish RunMy usdcad bullish view
FOREXCOM:USDCAD
Weekly: Usdcad is bouncing off weekly order block with old high above serving as a draw on liquidity.
4HR: Price took out sellside liquidity and created a shift in market structure leaving behind a clear order block and fair value gap.
Above price, we have multiple buyside liquidity and fair value gap which serve as a draw on liquidity for price.
I expect price to fill the fair value gaps above and take out the buyside liquidity.
Entry: I will set my buy limit order at around 1.31662 ote level.
Stop loss: My stop loss will be place around 1.31128 zone below the swing low.
Take profits: My final take profits will be at 1.36516.
But I will take partials along the way as price take out each of those swing highs on the way.
Do follow me for more updates like this.

USDCAD H1Here is my analysis for USDCAD on H1 using Order Block. The price could go bullish, you can put a pending order on the Order block or find an entry on LTF within OB Zone. Trade Safe!

USD-CAD - 4h - SHORT SETUPUSD-CAD looks nice for a short setup, but first, we need a break of support zone at 1.32659 (pointed white line ) and confirmation on 15min tf to enter in this short setup.
