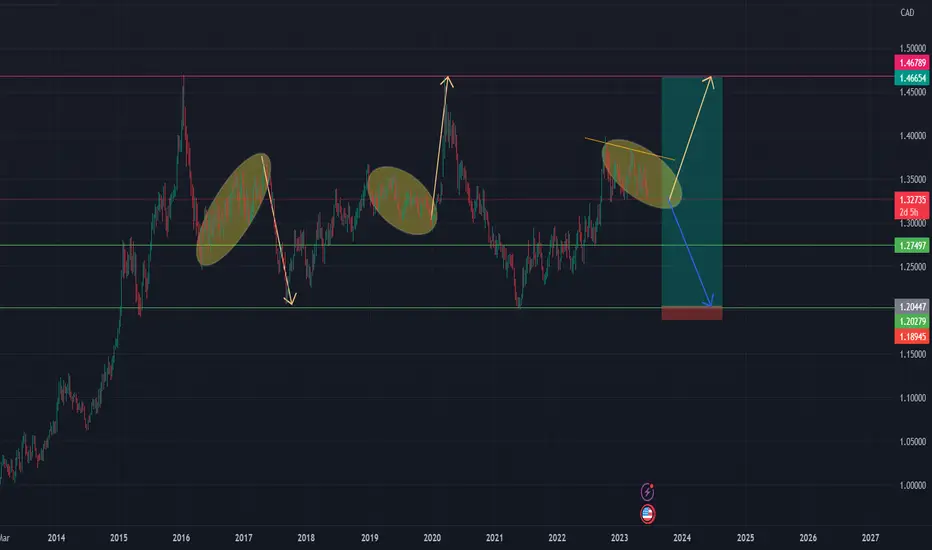
USDCAD Long Term Buying IdeaHello Traders
In This Chart USDCAD DAILY Forex Forecast By FOREX PLANET
today USDJPYD analysis 👆
🟢This Chart includes_ (USDCAD market update)
🟢What is The Next Opportunity on USDCAD Market
🟢how to Enter to the Valid Entry With Assurance Profit
This CHART is For Trader's that Want to Improve Their Technical Analysis Skills and Their Trading By Understanding How To Analyze The Market Using Multiple Timeframes and Understanding The Bigger Picture on the Charts
Usdcadlong

USDCAD TRADE IDEA : LONG (08/05/2023)Multiple breaks after reacting off of the point of interest below and purging liquidity USDCAD is pushing upside.
This trade has an RR of 9.95 - with 3 TPs: 1.33880, 1.35150 and final TP - with a probable RR of 15 - 1.35830.
This is just an idea - please use caution when entering. This is not financial advice.

USD/CAD Prediction 23.06.2023A robust bullish trend is looming on the horizon for the USD/CAD currency pair. After careful examination of the technical indicators, a clear uptrend is forming, showing signs of strengthening. This implies a potential for an upward shift, indicating the US dollar could gain ground against the Canadian dollar.
Several elements are contributing to this prospective bullish trend. On a macroeconomic level, key indicators such as strong US economic data and shifts in interest rate expectations could be driving factors. On a technical analysis level, a break above key resistance levels and the formation of bullish chart patterns may be confirming signals of the trend.
Remember, though, financial markets are inherently volatile and unpredictable. Always ensure to undertake a comprehensive analysis, considering all potential factors and risks before making any investment decisions.

USDCAD 2D TFWithin my area of interest, I have identified numerous converging factors that may prompt a reaction from the USDCAD. These confluences serve as potential buying opportunities that I will closely monitor. I am waiting for a nice candle rejection.

usdcad sell. Don't forget about stop-loss.
Write in the comments all your questions and instruments analysis of which you want to see.
Friends, push the like button, write a comment, and share with your mates - that would be the best THANK YOU.
P.S. I personally will open entry if the price will show it according to my strategy.
Always make your analysis before a trade

USDCAD possible long for short term14th September daily bullish order block with imbalance as well. Demand zone for long 1.3180, sl 1.3125, target: 1.3315

USDCAD Double Bottom Potential LongWe can see that price broke the short-term trade line, after which the low was tested, followed by a formation of a double-bottom pattern formation.

USDCAD analysis (1W time frame)On the chart we can see that the price is in the middle of the range. We expect that the price will come back down and will retest the key support at the bottom of the range. It may take some time, but we believe that it will happen in 2024. It would be our entry for a long position.
From another hand, if the price pump and reach the top of the range , it may be a good place to enter short position.
In this case the stop loss should be put above the resistance.
2 possible scenarios are shown on the chart
Good luck
USDCAD LongOANDA:USDCAD
This trade is somewhat risky due to the future news of USD and CAD. However, I expect the price to rise to the indicated areas. Otherwise, after the bottom trend line is broken, I wait for the pullback and close the position.

USDCAD BUYit seems that the strength of down-trend is getting weaker on the support zone and it's suitable for Buy (Long Position)

USDCAD Long US jobs indicator signals early signs of stress, CAD rides positive momentum after BoC hike
Bearish momentum accelerates as CAD continues positive momentum – ‘death cross’ and major support will be tested
nitial jobless claims out of the US flashed another early warning signal regarding the otherwise robust job market. 261 thousand people were newly unemployed as of the week of 3 June and represented the second time in recent prints that the data point exceeded estimates. As a result, the dollar sold-off, seeing an extended move to the downside for USD/CAD
The pair now shows renewed downside momentum and has broken beneath the longer-term channel that has contained the majority of price action. In fact, the move now tests the long-term trendline support that has witnessed multiple tests, none of which were successful.
The ‘death cross’ - circled in orange – provides further indications of a bearish continuation from here. A daily and weekly candle close below the trendline would naturally have bears looking at 1.3230 as the next level of support with the level coinciding with the November 2022 swing low. Breakouts often retrace to retest support/resistance and so a true test of a potential bearish breakdown would be a successful test of the trendline which would effectively become resistance, and subsequent selling thereafter.
Should CAD momentum wane and the US dollar look to claw back lost ground, a hold of trendline support will be key. If the bearish momentum were to falter, 1.3503 would be the next level of interest with an invalidation of the bearish viewpoint around 1.3600 and 1.3650.
The weekly chart reveals the 61.8% and 50% Fibonacci retracements of the major 2020 to 2021 sell-off - roughly the zone that has been housing price action for the last quarter of 2022 and 2023 this far.
Canadian employment data may attract a few more eyes than normal given the uptick in US initial jobless claims yesterday – which caused a notable response in the dollar and highlights FX market’s sensitivity to incoming data.
Next week crucial US inflation data provides another opportunity for core inflation to finally move below the recent 5.5% - 5.7% multi-month range. A softer inflation print could see downward revisions in future rate expectations and may see the USD/CAD head even lower from here.
After the RBA and BoC surprised markets with hikes in June, could the Fed follow suit? In my opinion I think it would be a tough ask, given how vocal prominent members of the Fed have been about voting to forgo a hike next week with the possibility of a hike in July should the data necessitate one. The Fed will also release its quarterly summary of economic projections which ought to provide markets with a better idea of the economic outlook. US PPI will also factor into the inflation conversation but any surprises there will need to be factored into next month’s FOMC meeting.
Granted USD/CAD has been sideways for months, but conditions could be getting ripe for a trend. USD/CAD is testing vital converged support around 1.3220-1.3320, a break below which could clear the way for a drop initially toward the psychological 1.3000, potentially toward the August low of 1.2725.
Moreover, the IG Client Sentiment (IGCS) shows 70% of retail traders are net-long with the ratio of long to short at 2.3 to 1. The number of traders net-long is a whopping 74% higher from last week. RSI above 200.
Trend Bullish.
The Canadian dollar may have just received the boost to extend gains against some of its peers, thanks to the Bank of Canada’s (BOC) hike on Wednesday.
BOC hiked its overnight rate to a 22-year high of 4.75%, saying “concerns have increased that CPI inflation could get stuck materially above the 2% target.” The central bank, however, dropped the April language saying it “remains prepared to raise the policy rate further”, making it more data dependent. Markets are pricing in another rate hike in July, with the terminal rate seen at 5.15% by the end of the year.

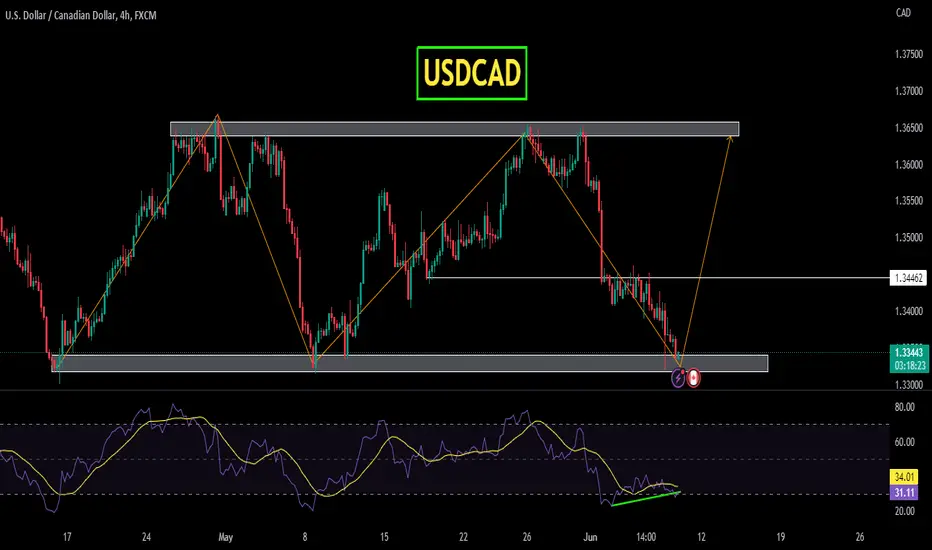
USDCAD Forecast 13June2023looks like sideways? is there an opportunity?
I like this kind of chart model, where we can make transactions with very little risk.

USDCAD Potential ReversalIn my opinion, USDCAD appears to be showing signs of a potential reversal as it forms a falling wedge pattern on the 1-hour timeframe, with the current price finding support at a specific level. The falling wedge pattern typically indicates a bullish reversal, suggesting that the downward momentum may be weakening.
Considering this pattern and the support level, traders might consider a potential long position on USDCAD. However, it's important to manage risk effectively. Setting a stop loss at 1.3276 can help limit potential losses if the market moves against the anticipated reversal. Additionally, a take profit level of 1.3439 can be considered as a target to capture potential gains.
Looking forward to read your opinion about it.

USDCAD Will Grow! USD-CAD is trading in a
Range and the pair went
Down to retest the support
Level of the range (1.33336) and we are
Seeing a bullish reaction
Already so I think that
We will see some
Further growth soon !

USD/CAD Best level to buy + 270 PipsDear traders, USD/CAD is on a support level in the daily chart.
So far, the bears have not been able to break the support level.
So, if the level continues to hold, there is possibility of going long
in USDCAD@1.33-1.3320 with SL below the support level and
TPs at 1.3470,1.2550 and 1.3650 respectively .

GOING LONG YNOTI'm feeling too generous giving away half of my setups for free haven't done this in a while so if you see this in time your welcome....If not follow the page might become a regular thing

USDCAD Long Term Buying IdeaHello Traders
In This Chart USDCAD DAILY Forex Forecast By FOREX PLANET
today USDJPYD analysis 👆
🟢This Chart includes_ (USDCAD market update)
🟢What is The Next Opportunity on USDCAD Market
🟢how to Enter to the Valid Entry With Assurance Profit
This Video is For Trader's that Want to Improve Their Technical Analysis Skills and Their Trading By Understanding How To Analyze The Market Using Multiple Timeframes and Understanding The Bigger Picture on the Charts.

USDCAD- on strong supportThe price has reached a strong support, so I expect it to return to higher levels again.

USDCAD potential reversal after Canadian data? Hello, all!
Potential reversal in USDCAD coming, with it bouncing off of 50% Fibonacci level traced back from 2020. highs.
Also, Canadian employment data are in favor of this potential move.
Targeting the 200-day Moving averages.

Possible Reversal to the Upside Expected Move: 280+ pipsCurrency Pair: USD/CAD
Trade Details:
- Entry: Buy USD/CAD at the current market price
- Stop Loss (SL): 1.33169
- Take Profit (TP): 1.36383
Trade Rationale:
Based on technical analysis, there are several factors indicating a possible reversal for USD/CAD and a potential upward move of at least 280 pips:
1. Support Level: The price has reached a significant support level, indicating a potential bounce or reversal. Traders might see this as an opportunity to buy the pair at a favorable price.
2. Bullish Candlestick Patterns: Recent candlestick patterns, such as hammer, engulfing, or bullish pin bars, have formed on the daily or weekly charts, suggesting a shift in market sentiment and a potential bullish reversal.
3. Oscillators: Momentum oscillators, such as the Relative Strength Index (RSI) or Stochastic Oscillator, are showing oversold conditions, indicating a possible exhaustion of the selling pressure and a potential rebound in prices.
Risk Management:
To protect against potential losses, it is crucial to set a stop-loss order at 1.33169. This level should be placed below the recent swing low or a significant support level, ensuring that if the trade goes against the expected reversal, losses are limited.
Profit Target:
The take-profit level is set at 1.36383, aiming for a potential gain of at least 280 pips. This target is based on previous resistance levels or Fibonacci retracement levels that may act as barriers to the upward price movement.
Note:
Please remember that trading involves risks, and past performance is not indicative of future results. It's essential to conduct your own analysis, consider market conditions, and adjust your trade management according to your risk tolerance and trading strategy.

USDCAD 8June2023there is a change in the elliot notation on this pair. if you look at the pattern that has occurred, then a complex correction has occurred and may enter the final period. I am more inclined to buy. looking at the existing history, the price always responds positively to the trend line, so the big possibility is bullish. bullish analysis can fail when the price drops deeper than the invalid area.

USDCADUSDCAD is range bound between 1.3320 to 1.3650 region. Sometime ranges are good option to trade just sell the top and buy the bottom. Will USDCAD play this scenario this time ?
Is it time to add buys in USD/CAD? Detailed analysis below!Dear traders, after Bank of Canada's rate event yesterday, USD/CAD dropped
to the 1.3321 level. However, the fall was arrested as it is a strong support level .
Based on the current price action, it seems the 1.3320 support level would continue
to hold.
So, if price action becomes bullish at this level and the support level stays
unbroken, traders can consider going long USDCAD@1.3320 with SL below 1.3250
and TP at 1.3650 .
