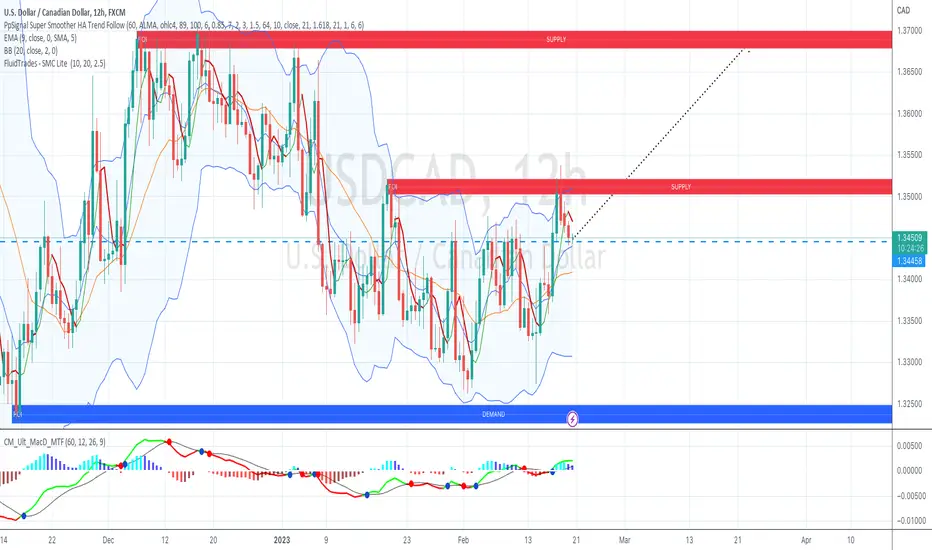
Loonie Dollar possibly aiming highAlright guys, USDCAD might be heading high, here are my reasons to expect further deterioration of CAD against USD:
1- Inverted head and shoulders pattern spotted
2- We have been long inside the falling wedge (The ABCD triangle) and we are on the brink of breaking out, although we need a daily closing price outside the upper border of the triangle
3- Let's just say that Canada felt the recession worse than USA did
When to buy USDCAD?
I will say it again, wait for the price to break out of the wedge however, we have one confirmation from the head and shoulders but it would be great if we just have another.
What are the targets?
Look at the white horizontal lines, lower one must break to pave way for the higher white line
Best of luck and happy trading :-)
Usdcadlong

USDCAD H1: Bullish outlook seen, further upside above 1.3520On the H1 time frame, prices are showing bullish order flow with higher lows and higher highs formed. A throwback to the support zone at 1.3520, in line with the 23.6% Fibonacci retracement could present an opportunity to play the bounce, with 1.3650 as the resistance target. Prices are holding above the Ichimoku cloud, and Stochastic RSI is in the oversold region below 20, supporting the bullish bias.


USDCAD - Potential Upward MovementUSDCAD will continue its upward movement until it hits the 2nd supply zone.
USDCAD - 200 EMA as support line - BUY!The price is going to jump as soon as it touches the 200 EMA line, which serves as a support line. Entry is at 1.34283, the stop loss is at 1.33142, and the take profit level is set at 1.36584, indicating a potential profit of 230 pips.
OANDA:USDCAD

USDCAD LONG - PULLBACK OVER SOON!Waiting for a pullback to retest 1.34403 or 1.33805 to long USDCAD back to 4H swing high at 1.36147
If you agree drop a like and if you have any questions leave a comment :)

USDCADThough the long term outlook is bearish, there are signs of a short term bullish correction targeting the 1.36 region. On the 4HR we have a change of character (choch) and break of structure (BOS). We anticipate a move to the downside targeting the unmitigated zone to pick buy orders then resume the bullish correction.

USDCAD - Expect bearish price action ✅Hello traders!
‼️ This is my perspective on USDCAD.
Here I am looking for shorts as price took out buy stop liquidity and filled the imbalance higher. I see price to continue bearish price action for the next days.
Like, comment and subscribe to be in touch with my content!

USDCAD LONGSUSDCAD has finally arrived at or POI after missing our sell entries. We are looking for any signs of bullishness from 1.332 and 1.33. that is our trade of the week.


USDCAD Long term BUY USDCAD is trading in a bullish flag pattern as of this week, with CPI news this week I expect a push to the upside breaking trend and becoming bullish. BUY!!

USDCAD forecastWe have seen a good fall during the Canadian dollar news previouslyproviding a fakey breakout on the uptrend channel. The price is at a fresh supply and the bottom of the channel's trend line. It's good idea to long the pair. Happy trading 🙂.

USDCAD Long - Oil Shorts About to PayI first took a short in oil back in June of 2022. This on the heals of identifying several short-equity opportunities in "household favorites" like Tesla and Bitcoin and Mickey.
It has been a long steady grind lower in oil, but opportunistic nonetheless. What oil has not yet done, is give us that really deep, nasty drop at the end of its death-grind lower (an obvious place to take profits - where everyone else tends to be too late and get burned) However, USDCAD may be telling us that move (nasty drop in oil) is nigh.
Happy hunting.
God bless!

USDCAD - Daily Trade Idea - 10-Feb-23USDCAD (LONG)- If all the support holds in place.
If we see the Support broken out then we could see the shift in the trend.
I marked the TP 1 (20 pips), TP 2 (50 pips) , TP 3 (100 pips) and EXIT (SL - 60 pips) on the chart.
(THIS IDEAS VALID NEXT 24 HOURS)
Please note this is only the Trade Idea base on S & R and not a signal, the market can react differently during the session due to News Impact and only enter if we have the final confirmation for entry.
- Rejection Candle Formation - Green Candle after the Red Candle.
- Stochastic - Oversold Area
- Timing of entry Prior / during UK / US Market Session.

USDCAD - Daily Trade Idea - 9-Feb-23USDCAD (LONG)- If all the support holds in place.
If we see the Support broken out then we could see the shift in the trend.
I marked the TP 1 (20 pips), TP 2 (50 pips) , TP 3 (100 pips) and EXIT (SL - 60 pips) on the chart.
(THIS IDEAS VALID NEXT 24 HOURS)
Please note this is only the Trade Idea base on S & R and not a signal, the market can react differently during the session due to News Impact and only enter if we have the final confirmation for entry.
- Rejection Candle Formation - Green Candle after the Red Candle.
- Stochastic - Oversold Area
- Timing of entry Prior / during UK / US Market Session.

USDCAD - Daily Trade Idea - 7-Feb-23USDCAD (LONG)- If all the support holds in place.
If we see the Support broken out then we could see the shift in the trend.
I marked the TP 1 (20 pips), TP 2 (50 pips) , TP 3 (100 pips) and EXIT (SL - 60 pips) on the chart.
(THIS IDEAS VALID NEXT 24 HOURS)
Please note this is only the Trade Idea base on S & R and not a signal, the market can react differently during the session due to News Impact and only enter if we have the final confirmation for entry.
- Rejection Candle Formation - Green Candle after the Red Candle.
- Stochastic - Oversold Area
- Timing of entry Prior / during UK / US Market Session.

USDCAD - Daily Trade Idea - 6-Feb-23USDCAD (LONG)- If all the support holds in place.
If we see the Support broken out then we could see the shift in the trend.
I marked the TP 1 (20 pips), TP 2 (50 pips) , TP 3 (100 pips) and EXIT (SL - 60 pips) on the chart.
(THIS IDEAS VALID NEXT 24 HOURS)
Please note this is only the Trade Idea base on S & R and not a signal, the market can react differently during the session due to News Impact and only enter if we have the final confirmation for entry.
- Rejection Candle Formation - Green Candle after the Red Candle.
- Stochastic - Oversold Area
- Timing of entry Prior / during UK / US Market Session.

USDCAD - WAITING FOR CONFIRMATION!Waiting for confirmation to short USDCAD at 1.33965 back down to swing lows at 1.32793 or if we see a break of the level, I will wait for a retest of 1.33965 to long USDCAD back to swing highs at 1.35118.
If you agree drop a like and if you have any questions leave a comment :)

USDCAD Longs After the strong jobs data on Friday, a more strong bullish push is being presented by the market. Retests will occur and then a strong push to the upside is expected

usdcad trendcad perfectly reacted to the support zone, after eng. the fl price needs more long orders so Im ready to long it in support zones to new demand zones

DXY strong to the upside after FED meeting...DXY moving to the upside due to the interest hike by the FED, it means USD getting stronger, look for bullish for USD Pair at least for a week.
USDCAD - Bullish - as USD Strong, CAD (USOIL) will be traded to the south due to the slow demand as Operational Cost will be increased (USD).
USDJPY - Bullish - JPY so sensitive with the interest hike

USDCAD - Short from bearish orderblock ✅Hello traders!
‼️ This is my perspective on USDCAD.
Here we are bearish from H4 timeframe perspective, so I am looking for shorts. I expect price to continue the retracement to fill the imbalance higher and then to reject from bearish orderblock + institutional big figure 1.34000.
‼️Attention!!! Due to the fact that we have a news on USD tomorrow, the analysis can be invalidated.
Like, comment and subscribe to be in touch with my content!
