USDCAD: Dollar still strong!USDCAD
Intraday - We look to Buy at 1.2980 (stop at 1.2920)
Previous support located at 1.3000. Previous resistance located at 1.3050. We expect a reversal in this move. Risk/Reward would be poor to call a buy from current levels. A move through 1.3050 will confirm the bullish momentum.
Our profit targets will be 1.3100 and 1.3150
Resistance: 1.3050 / 1.3100 / 1.3150
Support: 1.3000 / 1.2980 / 1.2950
Please be advised that the information presented on TradingView is provided to Vantage (‘Vantage Global Limited’, ‘we’) by a third-party provider (‘Signal Centre’) . Please be reminded that you are solely responsible for the trading decisions on your account. There is a very high degree of risk involved in trading. Any information and/or content is intended entirely for research, educational and informational purposes only and does not constitute investment or consultation advice or investment strategy. The information is not tailored to the investment needs of any specific person and therefore does not involve a consideration of any of the investment objectives, financial situation or needs of any viewer that may receive it. Kindly also note that past performance is not a reliable indicator of future results. Actual results may differ materially from those anticipated in forward-looking or past performance statements. We assume no liability as to the accuracy or completeness of any of the information and/or content provided herein and the Company cannot be held responsible for any omission, mistake nor for any loss or damage including without limitation to any loss of profit which may arise from reliance on any information supplied by Signal Centre.
Usdcadlong

USDCAD*Everything is mentioned on the chart. I hope it is easy to understand.
*Don't jump in to trade at the beginning of the market. let it get settle for 15-20 min first and judge price action.
*Avoid gap up or gap down chase. Wait and trade between level.
Note :Trade with strict stop loss. It may or may not hit all the levels. So one can book profit / loss at respective level considering how price action work near that level.
Only for educations purpose.

USDCAD Multi-timeframe analysisHello traders, this is the full breakdown of this pair. We will take this trade if all the conditions are satisfied as discussed in the analysis. Smash the like button if you find value in this analysis and drop a comment if you have any questions or let me know which pair to cover in my next analysis.
Press the like button if you enjoy this content 😊

usdcad continue up because uptrendusdcad continue up because uptrend market gave ralley base ralley we expect bullish move continue because htf trend is bullish

USDCAD - Daily Trade Idea - 7-Sep-22USDCAD (LONG)- If all the support holds in place.
If we see the Support broken out then we could see the shift in the trend.
I marked the TP 1, TP 2 , TP 3 and EXIT (SL) on the chart.
(THIS IDEAS VALID NEXT 24 HOURS)
Please note this is only the Trade Idea base on S & R and not a signal, the market can react differently during the session and only enter if we have the final confirmation for entry.

USDCAD Uptrend Long!USD-CAD is trading in a up channel
And as the pair is going down
To retest the support leve at 1.30771
I think we will see a bullish rebound
And a move up to retest the
Rising resistance of the up channel again

USDCAD - FUNDAMENTAS WITH TECHNICAL LEVELS#USDCAD
USDCAD is going up quite a bit right now. That's because OIL is down quite a bit and POWELL'S HAWKISH COMMENTS UPDATES came. They have been working to make USD STRONG in recent days. Due to this reason, STOCKS can move DOWN SIDE if the USD becomes STRONG like this.
Right now, there is a very good BUY towards the UPSIDE because US DATA and UPDATES are POSITIVE. We think it will go down to the 1.3320 level before going down again with MARKET RISK ON SENTIMENT.
Somehow USDCAD will likely SELL up to 1.2827 LEVEL. We wait until the DOWNSIDE TREND CONTINUES. FOLLOW THE STRUCTURE GIVEN. usdcad

USDCAD LONGas long as this structure has not been broken i will be looking for buys back up to recent HH.
this structure lines up in between 50 and 61.8% on Fib
Also you can see it wasn't broken on the 4H which shows me there is buying pressure in this zone
Looking for entries around 1.3265

USDCAD - Daily Trade Idea - 6-Sep-22USDCAD (LONG)- If all the support holds in place.
If we see the Support broken out then we could see the shift in the trend.
I marked the TP 1, TP 2 , TP 3 and EXIT (SL) on the chart.
(THIS IDEAS VALID NEXT 24 HOURS)
Please note this is only the Trade Idea base on S & R and not a signal, the market can react differently during the session and only enter if we have the final confirmation for entry.

⁉️ USDCAD - Market AnalysisHello traders!
⁉️This is my analysis on USDCAD .
Here we are in a bullish market structure, so I am looking only for longs. I expect price to fill the imbalances below and to reject from bullish orderblock + institutional big figure 1.30000 or from bullish orderblock + mid figure 1.29500.
Like, comment and subscribe to be in touch with my content!

USDCAD: Dollar prevails above all!USDCAD
Intraday - We look to Buy at 1.3100 (stop at 1.3040)
Previous resistance located at 1.3180. Further upside is expected although we prefer to set longs at our bespoke support levels at 1.3100, resulting in improved risk/reward. A move through 1.3180 will confirm the bullish momentum.
Our profit targets will be 1.3220 and 1.3225
Resistance: 1.3180 / 1.3200 / 1.3225
Support: 1.3150 / 1.3100 / 1.3050
Please be advised that the information presented on TradingView is provided to Vantage (‘Vantage Global Limited’, ‘we’) by a third-party provider (‘Signal Centre’). Please be reminded that you are solely responsible for the trading decisions on your account. There is a very high degree of risk involved in trading. Any information and/or content is intended entirely for research, educational and informational purposes only and does not constitute investment or consultation advice or investment strategy. The information is not tailored to the investment needs of any specific person and therefore does not involve a consideration of any of the investment objectives, financial situation or needs of any viewer that may receive it. Kindly also note that past performance is not a reliable indicator of future results. Actual results may differ materially from those anticipated in forward-looking or past performance statements. We assume no liability as to the accuracy or completeness of any of the information and/or content provided herein and the Company cannot be held responsible for any omission, mistake nor for any loss or damage including without limitation to any loss of profit which may arise from reliance on any information supplied by Signal Centre.

USDCAD HUGE UPSIDE POTENTIAL!!I have explained I'm looking for a continuation higher on USDCAD so if we can get a little retracement ill be looking to jump on long trades. 1.31000 is the main area I'm looking at so if we see some support or a nice spike into this level ill be entering buy trades!

USDCAD EASY LONG TRADE SETUP!Pretty simple but I am looking at jumping on some continuation long trades as I have highlighted 1.31000 is the main area ill be watching price around!

USDCAD -LONG idea Hi Traders,
USD/CAD making higher after 11th August, market broke the range with really good volume traded.
Market retested strong support and 0.50 Fib level. we can expect USD/CAD long run from here.
I have SL 1.29860 and first Profit target 1.32563

USDCAD LONG - WEEKLY HIGHS TO BE TAKEN!Waiting for a pullback into 1.30693 or into 1.30263 to long USDCAD back to swing highs at 1.2230.
If you agree drop a like and if you have any questions leave a comment :)

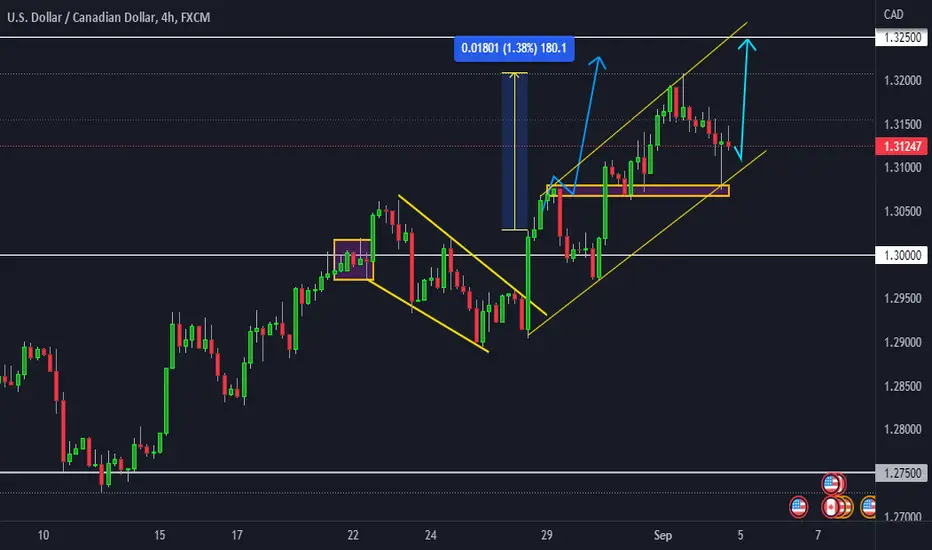
2X UCAD SIGNAL RAN FOR 180 PIPS!UCAD shook a lot of people out making this push up but there was a invalidation zone with that strong bullish candle it retested 50% of it and took back off! We are still in buys going into next week!
USDCAD Idea H1Here is my view for USDCAD on H1. The price could go up, you can put a pending order on the Order block or find an entry on LTF within OB Zone. Trade Safe!

USDCAD - Daily Trade Idea - 1-Sep-22USDCAD (LONG)- If all the support holds in place.
If we see the Support broken out then we could see the shift in the trend.
I marked the TP 1, TP 2 , TP 3 and EXIT (SL) on the chart.
(THIS IDEAS VALID NEXT 24 HOURS)
Please note this is only the Trade Idea base on S & R and not a signal, the market can react differently during the session and only enter if we have the final confirmation for entry.

USDCAD - Daily Trade Idea -31-Aug-22USDCAD (LONG)- If all the support holds in place.
If we see the Support broken out then we could see the shift in the trend.
I marked the TP 1, TP 2 , TP 3 and EXIT (SL) on the chart.
(THIS IDEAS VALID NEXT 24 HOURS)
Please note this is only the Trade Idea base on S & R and not a signal, the market can react differently during the session and only enter if we have the final confirmation for entry.


USDCAD BullishAfter the new release on Friday the dollar pushed to the upside. After pullback I'm predicting USDCAD to continue the up trend.

USDCAD - BACK TO HIGHS FOR THIS ONE!Waiting for a break and retest of 1.30784 or a pullback into 1.29591 to long USDCAD back to swing high target at 1.32235.
If you agree drop a like and if you have any questions leave a comment:)

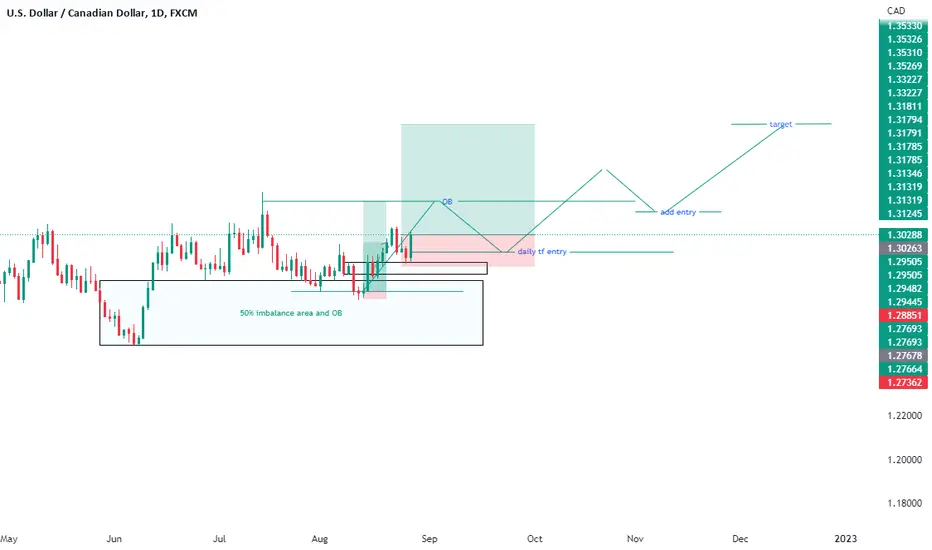
20 reason for buy USDCADUpdate 28/08/2022
1 Structure 1/2: sideways to bullish
2 imbalances : Target marked correction filled
3 Current Move1/2 : impulse
4 Entry TF : weekly
4.1 ETF Structure: bullish
4.2 move : IMPULSE
5 Support Resistance price support : Imbalance filled OB Support retest
6 FIB: this time also in 61.8 support level
7 candle Pattern : Back to momentum
8 Chart Pattern: LH HH
9 Volume : Above
10 Momentum: sideways bullish
11 Volatility : middle support
12 strength: bullish
13 Sentiment : due to commodities weakness CAD is in under pressure
14 Final Summary: buy at the price
15Buy /Sell/Wait : buy
16 Entry: 1.3053
17 Sl: 1.2890
18 Tp: 1.3537
19 Risk to reward Ratio: 1.4
20 Excepted Duration : 45 days