USDCADSo after USDCAD ran to the downside this week breaking a significant low, i'd expect a return to Supply(OB) for another expansion downwards.. Remember, our target is to completely fill the weekly F.V.G and tap into the demand zone below it... So i'd advice we wait for price to trade up into the supply zone before making any execution........ And wait for confirmations once price enters that zone before taking a sell.... HAVE A GREAT WEEKEND..........!!!!
Usdcadsell

USDCAD top-down analysisHello traders, this is a complete multiple timeframe analysis of this pair. We see could find significant trading opportunities as per analysis upon price action confirmation we may take this trade. Smash the like button if you find value in this analysis and drop a comment if you have any questions or let me know which pair to cover in my next analysis.

USDCAD setting up for a nice sellUSDCAD sentiment has been bearish throughout the entire NY session, we do have some liquidity siting below today's low, we have people who just bought and have their stops below the low, and some possible sell stops which would push the market further to the downside.
Nice retracement going on in the Asia session, looking for the downward momentum to continue, need to see a rejection in the H4 GAP / previous structure break

USD/CAD Made Double Top, Still Not Confirmed ,When We Can Sell ?This Is An Educational + Analytic Content That Will Teach Why And How To Enter A Trade
Make Sure You Watch The Price Action Closely In Each Analysis As This Is A Very Important Part Of Our Method
Disclaimer : This Analysis Can Change At Anytime Without Notice And It Is Only For The Purpose Of Assisting Traders To Make Independent Investments Decisions.

USDCAD sell the breakdown!!USDCAD 4h has formed a strong reversal pattern on the lower timeframe and the price currently breaking out of the previous support zone. As the market is over-extended, it is highly likely that USDCAD will reverse from this zone to test long-term monthly resistance turning support. Before, reversal, we could see a long spike to the upside and, upon rejection, a sell trade is highly probable!
Press the like button if you enjoy this content!!

USDCAD / possible sell off idea (right shoulder)Looking at catching a sell off on USDCAD, long term bullish but to continue this way we need to see a breather (correction). Can be very risky going against the overall trend but if we can manage to catch the move we can see huge potential for profit, again I will be aggress with stop loss and adjusting once in profit.

Thu 29th September 2022 USD/CAD Daily Forex Chart Sell SetupGood morning fellow traders. On my Daily Forex charts using the High Probability & Divergence trading methods from my books, I have identified a new trade setup this morning. As usual, you can read my notes on the chart for my thoughts on this setup. The trade being a USD/CAD Sell. Enjoy the day all. Cheers. Jim

USDCAD BIAS UPDATE: STILL A SELLPerhaps you have sold usdcad, and your stop loss has been hit, you can sell it again. The price has rejected the 61.8 fob level. The price is below the channel now, and as a result of this, it's going to sell strong.

USDCAD Wyckoff method Distribution 1 found 30 minutes timeframeUSDCAD
Wyckoff method ( Distribution Schematic 1) setup found on time frame 30 minutes
just for learning purpose not a financial advice

USD/CAD :: Multiple buy signals !USD/CAD :::
Blue Channel :: It has been drawn in a higher time frame and is growing.
Orange channel :: It is drawn with 4H time frame and it is also rising.
It is growing in two ascending channels and has broken two strong resistances, so it is a good signal to buy.
<<< Good luck >>>

USDCAD H4Hi traders, USDCAD is setting up for a downside move watch price action in a lower timeframe and look for short GOOD LUCK.

USDCADUSDCAD on upper line channel
taking sell order with sl above trend line and take profit around pivot weekly.

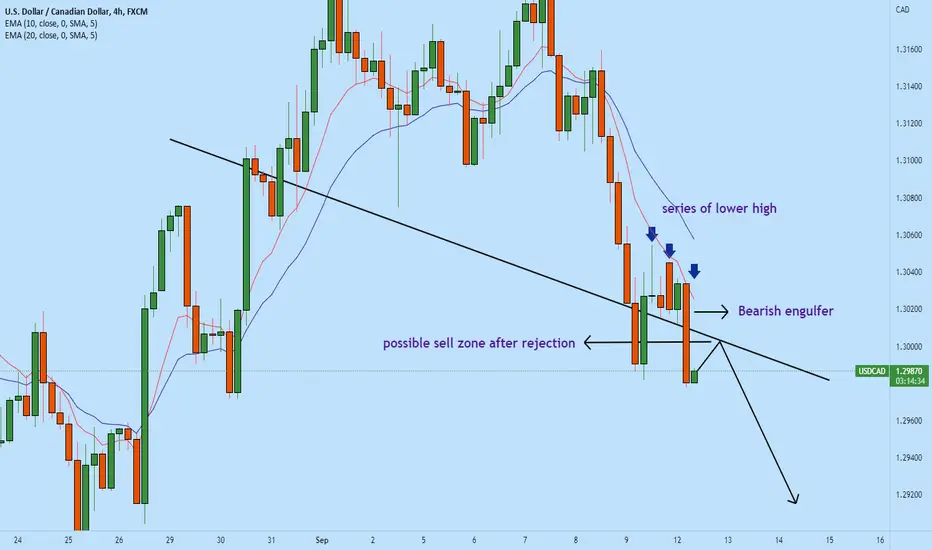
USDCAD possible sell zone!!USDCAD (4h) has formed a strong reversal pattern and the price has broken to the downside with a bearish engulfer. Currently, the price is below weekly support. in the new trading week, the price opened with a gap up with rejection to the downside. On the test of the neckline of the reversal pattern, the price may continue to drop. A sale is a high probability of set up after rejection.
Press the like button if you enjoy this content :)
Mon 12th September 2022 USD/CAD Daily Forex Chart Sell SetupGood morning fellow traders. On my Daily Forex charts using the High Probability & Divergence trading methods from my books, I have identified a new trade setup this morning. As usual, you can read my notes on the chart for my thoughts on this setup. The trade being a USD/CAD Sell. Enjoy the day all. Cheers. Jim

USDCAD Risky Short !!USD-CAD broke out of the rising channel
So I am bearish biased on the pair
But I think that we will first see a move up
To retest the broken support line of the channel at 1.30971
And only then the price will go down
Towards the target level below

USDCAD*Everything is mentioned on the chart. I hope it is easy to understand.
*Don't jump in to trade at the beginning of the market. let it get settle for 15-20 min first and judge price action.
*Avoid gap up or gap down chase. Wait and trade between level.
Note :Trade with strict stop loss. It may or may not hit all the levels. So one can book profit / loss at respective level considering how price action work near that level.
Only for educations purpose.

Big reversal in USD/CAD, Will it reach 1.2650?As predicted in my previous ideas, USD/CAD has reversed after hitting the top of the price channel and it has given us sellers almost 95+ pips profit from the top. Now, based on the price action in daily chart, it seems USD/CAD reversal is very likely to happen and price will drop even lower.
There is a very good chance that USD/CAD will drop to the lower TL of the channel near 1.2650 as price continues to fall. So, great opportunity for the sellers here.

USDCAD trade idea (MON - 05/09) : SELLUSDCAD has broken structure enough times - respecting the flow of the price after having met resistance by demand.
This is an idea. Thank you

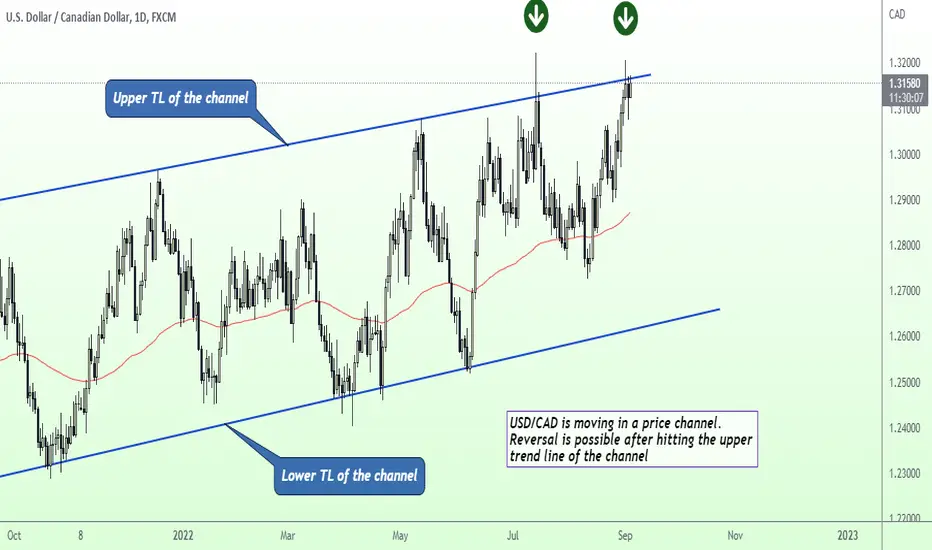
Will there be a reversal in USD/CAD?USD/CAD is moving within an ascending price channel for the last few months.
At present, price has hit the top of the channel and a bearish daily candlestick has formed at the channel top.
This gives us a slight bearish bias and the likelihood of a bearish reversal.
Potential sellers can consider selling at 1.3160-1.3220 area. If the reversal does happen, USD/CAD has the
potential to drop towards 1.27 level.
USD/CAD WAITE TO SELL CONFARMANATION.......
AronnoFX will not accept any liability for loss or damage as a result of
reliance on the information contained within this channel including
data, quotes, charts and buy/sell signals.
If you like this idea, do not forget to support with a like and follow.
Traders, if you like this idea or have your own opinion about it,
write in the comments. I will be glad.

USDCAD area for more short trades!Little breakdown on USDCAD for a small intraday trade. Looking to see if the price can rejected the area of 1.29600 again for a added short trade targeting 1.28800.

USDCAD nice short trade updates!We seen price make that right shoulder move I explained yesterday and got the nice drop down, I took 2 entrys but will be closing half my position down at 1.28800.. major target level 1.27700 and as always stops moved to break even!

USDCAD short running in blue 🟦4am UK time see an alert on my USDCAD 30M reversal strategy.
Reversal trade identified and entered.
Strategy can be automated I wasn't up at 4am.
Working the 30M timeframe.
Trade details can be found on the chart in red label.
Trade box is tracking the trade.
Trade currently running in blue but we'll see where we end up.
Want to know how I identified this trade you know what to do.
Thanks for looking
Darren🙌
