Holding shorts on USDCAD once againSeeing a bit of early movement in usdcad early this monday so i have entered shorts to atlest take out that little spike down it made on friday to around 1.27400, stops will be moved just before this level is reached
Usdcadsell

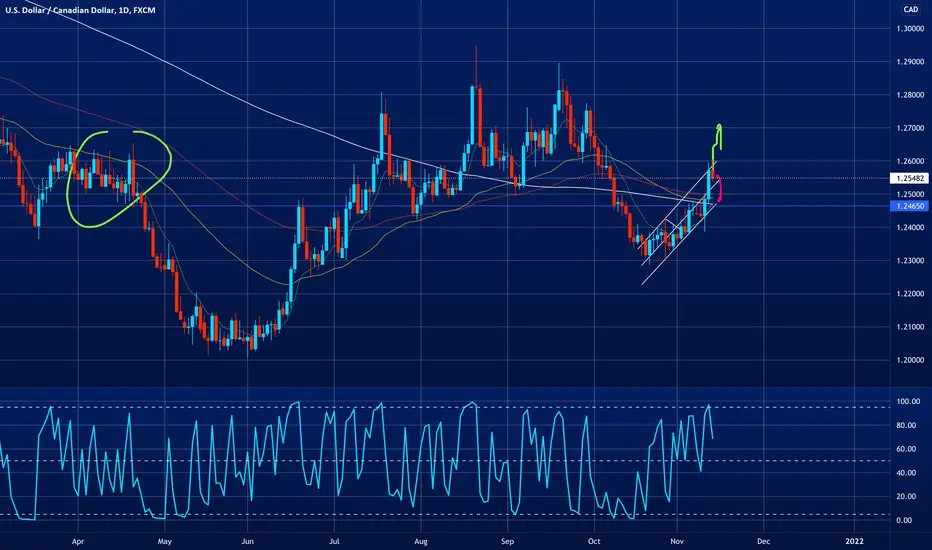
1.30 in sight for USDCADThe macro sentiment for the dollar is clear, we are expecting upside in 2022 and the fear is the market due to the OMNICRON strain as well as the fed's hawkish stance is accelerating this. Unless there's a macro uturn in the fed's policies, we should see price reach 1.30 some time soon.

USDCAD LONGS EDUCATIONAL 📉📉📉Its not a trading signal, i will look to long only if pric will return back into bullish orderblocks + imbalances confirmed with a HTF bullish market structure. Thats a perfect setup that i wait when i enter trades, htf structure combined with smart money concepts for entries.
What do you think ? Comment below..

USD/CAD 4HR CHART POSS SELL SET UPHi everyone this is my trade set up for the USD/CAD
USD/CAD possible short TRADE is going against the trend so slightly risky, wait for a confirmation candle or pattern to form look for something concrete then if it meets your criteria for a trade then execute
This is my analysis only please trade with caution and risk management in place
good luck for this weeks trading
please like and comment both are welcome

USDCAD short area!!I'm still holding the bias of seeing a further push down but now its just getting into the best entry point, after been stopped at breakeven from last night ill be watching for entry's again today! Price usually gives you more then one opportunity and we still haven't broken upside trend structure so I defiantly wouldn't look at taken shorts from current price, be patient and snipe those best entry points. Good luck!

USDCAD SHORT TRADESMoving stops to entry point if we can get a quick move down, only risking 0.5% as its a risk area and price is wild at the moment.

USDCAD short area update Just a quick update on USDCAD as I'm waiting for price to show better moves I thought id share what I'm looking for.

USDCAD running into resistance (short area)Will 1.28000 be the resistance that gives the much needed pullback on USDCAD? Ill just be monitoring price at the start of the week and hopefully price can shape nicely for either a bigger retracement or even possible reversal.

USDCAD breaks out cleanly. More upside but stay nimble!The dollar cad finally breaks out of the channel that it was trading in and we should see more upside in the coming weeks. But this upside move is capped by strong resistance areas and there isn't much of a room to go. I'd control my risk and stay agile if I were you.

USDCAD - SHORT - SELLHello everyone, I am shorting USDCAD for 135 pips with tight sl we are at demand

USDCAD = BearishHi fellow traders, look for more downside on USDCAD as the correction has completed and oil is ready to move higher. Goodluck!

USDCAD ( IT'S ALL ABOUT SNIPER ENTRY)Break of structure for potential downside movement , worse scenario is when price violates and continue to the upside due to higher tf point of interest above that are likely to be tested { we might extend the sl for the safety just depends on how price will react }

USDCAD SHORT TRADE UPDATESo hopefully some of you guys may be in this trade, as expected price is pushing down and looking like we may see a deeper pull back to go with the overall uptrend or possibly making a reversal for some further downside. Even though I'm not in the trade I will update later in the week.

USDCAD SHORTS TAKENHoping to see another much needed deeper pull back or possible trend change on USDCAD, I've just entered and like I said moving stops to entry point as soon as a few pips in profit as I'm not forgetting the overall 4hr uptrend!

USDCAD STILL HOLDING SHORTS UPDATE!Firstly I apologies for my voice I'm currently trying not to lose it LOL, anyway I've still got my short trade open but moving stops to breakeven, we seen price get a bit choppy Friday and I do expect weakness from the dollar... so a sell off or push down on USDCAD I feel is coming, the hard part is getting the best position with the lest risk. Ill monitor price at the start of the week and if I get stopped at break even I will start to map out next short areas.

USDCAD breaking out?Until farther evidence surfaces, our bias is towards the price continuing to range in the channel we drew. THis means that price will continue to move down. However, it's been in this channel for quite some time and may break out soon, in that event we want to trade the break out as it brings us bigger price movements.
BEAR CASE
If you want to short here, give it a generous stop loss and check the price action at 1.255 (bottom of the channel), if it breaks down, take the trade.
BULL CASE
If it breaks the top of the band, 1.275 is our target.

USDCAD SHORT TRADESo I've just taken short trades on USDCAD and hoping to see a quick move down where ill be moving my stop loss to entry point and hopefully catching a nice risk free short to finish the week on USDCAD.

USDCAD SHORT TRADES Looking at catching the pullback move back down to atlest 1.25400, we are still in an overall 4 hr uptrend so make sure if you do enter and go into profit, move those stop losses to breakeven pretty quickly.

USDCAD - SELL strategyThe suggestion to go long some weeks back worked well.
Now we are on the other side of the fence, expecting to retrace a bit. We should SELL at current 1.2605 and keep stop-loss tight at 1.2657 max.
The channel is well-define, and i feel we will remain below or around the mid-range of the channel and come to lower boundary again. Further, the Moon Phase is new moon suggesting a correction down again.
the profit should be somewhere 1.2450.

USDCAD is likely to breakdown!!Hello traders, USDCAD has tested the long-term trend line as resistance and rejected to the downside. This weekly price has opened with a gap and it is highly likely that this instrument may break to the downside.

USDCAD: Obvious SellsThis zone seems too obvious for sellers, I would like to get in once we see some manipulation of this region.
Once we clear the high of the OB, I will look for LTF shifts for sell entries.


Is the channel going to hold for the USDCAD?The dollar cad tested the bottom of the channel like we predicted and moved up higher, it has now tested the top of the channel and faced some rejection, are we going to see a break out?
BEAR CASE
Until proven otherwise, our bias is to the downside. We expect to see it test the bottom of the channel once more and if it faces rejection there or before there, we know a major upmove is coming for this pair.
BULL CASE
If a breakout happens, we're targeting 127 to put up some resistance.