Usdcadsell

USD/CAD SELL IDEAHey tradomaniacs,
welcome to another free trading-setup.
Notice: This is meant to be a preparation for you! As always we will have to wait for a confirmation!
USD/CAD: Daytrade-Preparation
Market-Sell: 1,28040
Stop-Loss: 1,28580
Point Of Risk-Reduction: 1,27580
Take-Profit: 1,26900
Stop-Loss: 56 pips
Risk: 0,5% - 1%
Risk-Reward: 2,0
LEAVE A LIKE AND A COMMENT - I appreciate every support! =)
Peace and good trades
Irasor
Wanna see more? Don`t forget to follow me!

USDCAD Short (Sell) Trade SetupPrice has ran into a strong-ish sell zone and has reacted well. Look for price action signals for a potential short back to one of the demand zones. I do believe 1.261 is a reasonable end target.

USD/CAD Time to ShortThis has moved beyond the upper trend line but looks like it has reached its peak which is a lower high. Now expect this to drop and possibly create a lower low, but to be on the safer side TP can be at the previous low. SL just above the previous high of 1.27994

USDCAD short active Taken a short on USDCAD as it failed to make a new higher high. Looking for downtrend to continue.

USD/CAD SELL SIGNALHey tradomaniacs,
welcome to another free trading-setup.
USD/CAD: Daytrade-Execution
Market-Sell-Order: 1,27115
Stop-Loss: 1,27540
Point Of Risk-Reduction: 1,26750
Take-Profit: 1,26100
Stop-Loss: 42 pips
Risk: 0,5% -1%
Risk-Reward: 2,50
LEAVE A LIKE AND A COMMENT - I appreciate every support! =)
Peace and good trades
Irasor
Wanna see more? Don`t forget to follow me

USDCAD ANALYSISUSDCAD ANALYSIS
Please consider to put a like to my idea for supporting me & subscribe for more ideas.
Idea is not the financial advice!

USD/CAD SELLThe price has been in a downtrend respecting the light blue trend line.
The price is reaching a key resistance area near the downward trend line indicating that the price is going to fall. I expect to enter the trade once it reaches the resistance level and take profit until the price reaches the yellow support level. Adding on to the confluence the price closed near this level with a doji candlestick pattern suggesting a failure in breaking the resistance level.

USDCAD Short when it hit the zoneHello, This is my analysis for USDCAD at TF 1H.
Reason Sell : Strong Resistance at 1.28050
Kindly follow me for more analysis! I might be young but my analysis can be sharp! Goodluck and All The Best!


USD/CAD SELL SIGNAL Hey tradomaniacs,
welcome to another free trading-setup.
USD/CAD: Daytrade-Execution
Market-Sell-Order: 1,26890
Stop-Loss: 1,27200
Point Of Risk-Reduction: 1,26520
Take-Profit: 1,26100
Stop-Loss: 30 pips
Risk: 0,5% -1%
Risk-Reward: 2,60
LEAVE A LIKE AND A COMMENT - I appreciate every support! =)
Peace and good trades
Irasor
Wanna see more? Don`t forget to follow me


USDCAD Technical Analysis 4h Timefram SHORT position OPENEDBearish trend line respected, US dollar seems bearish.

UC has been a short since monthsI've shorted some at 1.275xx range. shorting more here at 1.273x range.


USDCAD - SWING - 19. JANU. 2021Welcome to our weekly trade setup ( USDCAD )!
-
1 HOUR
Price turning bearish right now..
4 HOUR
Sideways waving market structure..
DAILY
Expecting another push towards previous lows and support zone.
-
FOREX SWING
SELL USDCAD
ENTRY LEVEL @ 1.27550
SL @ 1.28240
TP @ 1.26480
Max Risk: 0.5% - 1%!
(Remember to add a few pips to all levels - different Brokers!)
Leave us a comment or like to keep our content for free and alive.
Have a great week everyone!
ALAN


USDCAD BEARISH CONVERGENCEAs we can see a BEARISH CONVERGENCE in H1 timeframe. This indicate a regular bearish move.


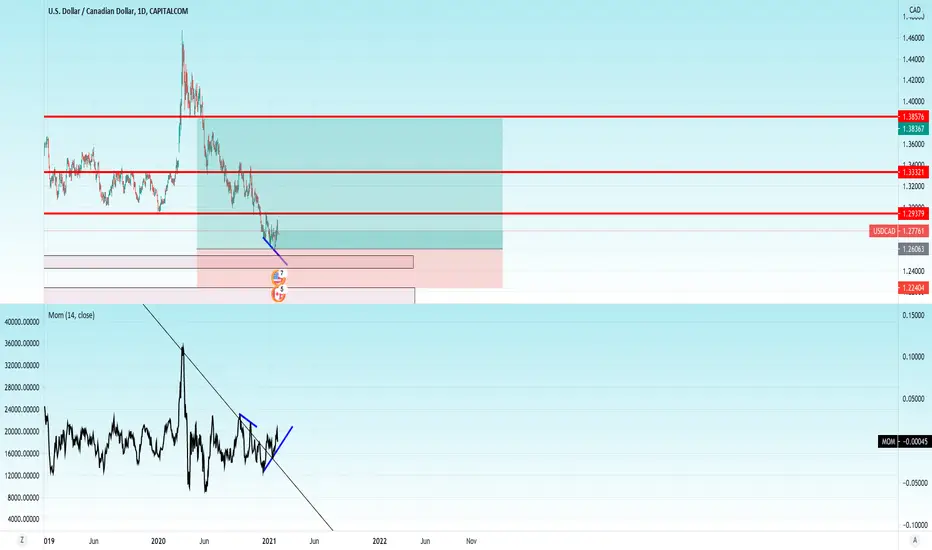
USD/CAD could FALL!Hey t radomaniacs,
USD/CAD could retrace in order to retest the breakout-zone 👉
Highver volatility and Volume-Digervence at strong resistance shows profit-saves and stop-loss-fishing.
Fakeout to the topside is also a strong evidence for reversal.
LEAVE A LIKE AND A COMMENT - I appreciate every support! =)
Peace and good trades
Irasor
Wanna see more? Don`t forget to follow me.
PS: This week I only share my analysis as market-conditions are still weak due to loq volume and liquidity! Will be back with signals next week!

USDCAD - SWING - 13. JANU. 2021Welcome to our weekly trade setup ( USDCAD )!
-
1 HOUR
Bullish reaction after closing below main sr level.
4 HOUR
Overall strong waving market structure.
DAILY
Expecting another push to previous lows and support zone..
-
FOREX SWING
SELL USDCAD
ENTRY LEVEL @ 1.27360
SL @ 1.27890
TP @ 1.26490
Max Risk: 0.5% - 1%!
(Remember to add a few pips to all levels - different Brokers!)
Leave us a comment or like to keep our content for free and alive.
Have a great week everyone!
ALAN
