Possible sell setup for USDCADThis is a scenario I am anticipating this week. I am looking for a sell at the support level we broke. A retest of this level will confirm the sell for me
Usdcadsetup


USDCAD create Bullish Butterfly With DivergenceUC Create strong bullish divergence with bullish butterfly pattern.
TP's point underlined.

USDCAD: Good Entry for take a short term signalA clear fix descending trend is drawed; so we take this

USDCAD buy from level USDCAD buy from level
❤️ If you find this helpful and want more FREE forecasts in TradingView
. . . . . Please show your support back,
. . . . . . . . Hit the 👍 LIKE button,
. . . . . . . . . . . Drop some feedback below in the comment!
❤️ Your Support is very much 🙏 appreciated!❤️
💎 Want us to help you become a better Forex trader?
Now, It's your turn!
Be sure to leave a comment let us know how do you see this opportunity and forecast.

USDCAD BUY1. Reversal zone with reversal pattern HCH
2. Fibonacci resistance 61% 78% zone
3. Retrecement pattern breakout and retest

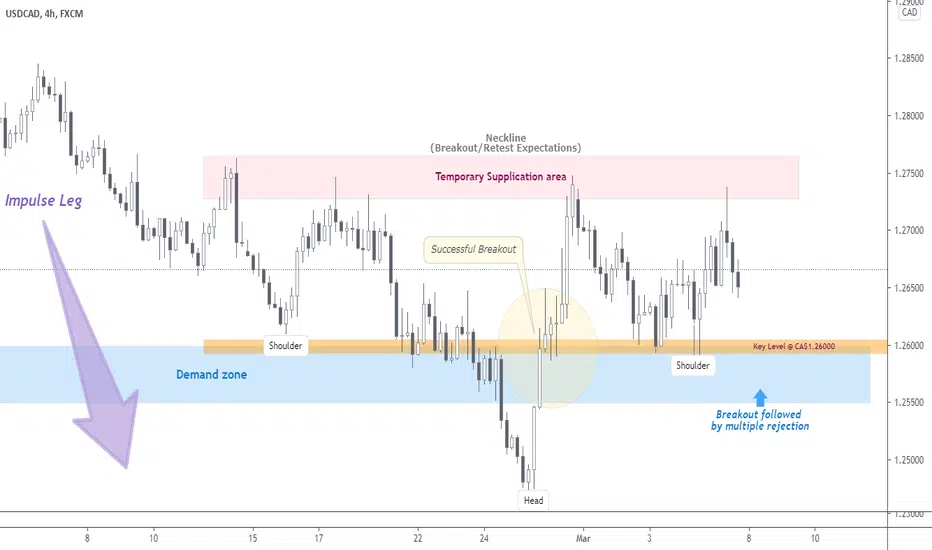
USDCAD | Perspective for the new week | Follow-upThe Bearish trend that began in October 2020 appears to have found a bottom @ around CA$1.24500 as the pattern transpose into what looks like an Inverse Head and Shoulder - a very strong reversal pattern.
My last publication on this pair still holds as I continue to look for Bullish expectations (see link below for reference purposes) following signs of positive expectations from the Greenback as the Non-Farm Payrolls report indicated that the U.S. economy added 379,000 jobs in February, a report that significantly exceeded analyst expectations.
Tendency: Uptrend ( Bullish )
Structure: Breakout | Supply & Demand | Reversal pattern (Inverse H & S)
Observation: i. Breakout of my Key level @ CA$1.26000 late February 2021 followed by multiple rejections of this level during last week trading session supports the expectation of a rally in the nearest future as the price remains supported at this level.
ii. After a significant Bearish Impulse leg, the appearance of an Inverse Head & Shoulder keeps my expectation LONG in the coming week(s).
iii. Bearish Leg that began Oct. 2020 falls to make a Shoulder and then rises to the Neckline(CA$1.27500); price then falls again and below the former Shoulder to make a Head and then rises again; finally, the price falls again but not as far as the second Shoulder with a good possibility of a Breakout/Retest expectation of Neckline @ CA$1.27500.
iv. Even as the CA$1.26000/1.25500 area remains a strong Demand area for me, a Breakout/Retest confirmation of Neckline might be a very good area you might want to join the rally.
Trading plan: BUY confirmation with a minimum potential profit of 350 pips.
Risk/Reward : 1:3.5
Potential Duration: 8 to 15days
NB: This speculation might be considered to make individual decisions on the lower timeframe.
Watch this space for updates as price action is been monitored.
Risk Disclaimer:
Margin trading in the foreign exchange market (including foreign exchange trading, CFDs, etc.) has a high risk and is not suitable for all investors. The content of this speculation (including all data) is organized and published by me for the sole purpose of education and assistance in making independent investment decisions. All information herein is for your reference only and I take no responsibility.
You are hereby advised to carefully consider your investment experience, financial situation, investment objective, risk tolerance level, and consult your independent financial adviser as to the suitability of your situation prior to making any investment.
I do not guarantee its accuracy and is not liable for any loss or damage which may result directly or indirectly from such content or the receipt of any instruction or notification therewith.
Past performance is not necessarily indicative of future results.

USDCAD LONG POSITIONLike and comment if interested
Post your ideas and questions in the comments section.
Good trades
NOTES:
- We follow the transactions we publish instantly and wait for our own signal strategies.
- We never trade as the price reaches the trade zone.
- Our analysis is not a buy or sell signal for you. It is not investment advice.
- trading with the signal is no better than having your own style.
Yours truly.

USDCADMajor trend: Up
Minor trend: Down
Price broke the minor trend
Price created triple bottom pattern
Waiting for retest of support trend line
Signal: Buy

Usdcad Using an trend following strategy we can see some volatility going in favor of the bear ( space between 50 ma and 200 ma)
also based on a fundamental point of view , with the oil going through the roof the cad should see some nice bullish attention from the correlation between the two assets.
so looking at how many time the trend reverse on the 50 ma usd/cad should reverse one more time.
bests regards, jeremy

USD/CAD Update +45 Pips This is an educational + analytic content that will teach why and how to enter a trade
Make sure you watch the price action closely in each analysis as this is a very important part of our method
Disclaimer : this analysis can change at anytime without notice and it is only for the purpose of assisting traders to make independent investments decisions

USD/CAD New Analysis To Catch More Than 300 PipsThis is an educational + analytic content that will teach why and how to enter a trade
Make sure you watch the price action closely in each analysis as this is a very important part of our method
Disclaimer : this analysis can change at anytime without notice and it is only for the purpose of assisting traders to make independent investments decisions


USD/CAD Short From Resistance This has retraced nicely to the point I marked out in my previous analysis for the pair. This is a good shorting entry to the target of 1.22500 with SL just above the resistance level. MACD is still below 0 so that signifies this is still bearish and EMA's are very close to crossing but I expect this to drop from here.

USD/CAD Waiting For Retrace To ShortThis has broken below a support, it now offers a chance to short this further but we need to see a retrace first for an opportunity to enter the trade. A retrace to at least 0.382 Fibonacci is required, then if and when it rebounds the short can be entered with a target of 1.22500 with SL just above the support level.

USD/CAD - BUY TRADE SETUP#USDCAD - Possible Buy Trade setup.
Use Max (0.5% or 1%) Risk / Trade.
What Do You Think About This?
Please Comment below OR Share Your IDEA.

H&S to get shorts trapped at the bottom or more downside to comeUSDCAD is painting a clear head and shoulders pattern. It hasn't break the neckline though.
the question is: is there more downside to come, or is this a trick to get shorts trapped at the bottom?
I'm long as long as the neckline isn't broken. we'll see.

How about UC short after a mini pump?I'm finding signs of exhaustion after this mini pump in USDCAD. based on trend line, candlestick confirmation, I'm shorting.

USDCAD buy opportunityhello traders welcome to usd cad technical analysis.
usdcad can bounce back from this support level .
good opportunity for buy .

USDCAD | Perspective for the new weekWith 102pips in our direction before the reversal on my last publication (see link below for reference purposes); we are at a juncture in the market with a viable opportunity to take advantage of. The Impulse move that begun mid-November 2020 appears to have found a bottom as the rejection of demand level @ CA$1.26500 area continue to gain momentum. Even though the USD/CAD pair came under renewed bearish pressure in the early session on Friday, I continue to see an opportunity to go Long as this Bearish move from my perspective is a corrective move following the successful Breakout of Bearish Trendline.
Tendency: Uptrend ( Bullish )
Structure: Reversal pattern | Breakout | Supply & Demand | Double Top
Observation: i. A visible Reversal structure is observed as price no longer deems it fit to respect the Bearish Trendline.
ii. Breakout of Bearish Trendline during last week trading session is a signal that we might be changing direction in the nearest future.
iii. Double Top at CA$1.28820 represent the beginning of the corrective phase of the Impulsive Breakout on the 27th of Jan 2020.
iv. I shall be anticipating the exhaustion of the Bearish steam around the Bearish trendline and Demand zone followed by signs of a rally in the following week(s).
Trading plan: BUY confirmation with a minimum potential profit of 300 pips.
Risk/Reward : 1:3.5
Potential Duration: 5 to 10 days
NB: This speculation can be considered to make decisions on lower timeframes.
Watch this space for updates as price action is been monitored.
Risk Disclaimer:
Margin trading in the foreign exchange market (including foreign exchange trading, CFDs, etc.) has a high risk and is not suitable for all investors. The content of this speculation (including all data) is organized and published by me for the sole purpose of education and assistance in making independent investment decisions. All information herein is for your reference only and I take no responsibility.
You are hereby advised to carefully consider your investment experience, financial situation, investment objective, risk tolerance level, and consult your independent financial adviser as to the suitability of your situation prior to making any investment.
I do not guarantee its accuracy and is not liable for any loss or damage which may result directly or indirectly from such content or the receipt of any instruction or notification therewith.
Past performance is not necessarily indicative of future results.

#163 USDCAD Long (Buy) Trade Setup IdeaUSDCAD has broken a daily support level and is now falling to a key demand level where we can expect some kind of a rejection. If price action permits, we can look to this level for a potential buy opportunity and aim for a test of the previous support, now turned resistance. If that level does not hold, then we can continue to hold our longs for higher highs on the daily timeframe.
This setup gives a great risk:reward.

USD/CAD Buy OpportunityTechnical Overview: - USD/CAD
DXY NFP last Friday was the juice needed to push price lower.
We are bullish from a higher time frame perspective, so we only look for buy potential entries
we do understand that smaller time frame suggests downside, this could be used as an opportunity to enter in when price is falling.
Analysis is only 1 piece of the puzzle 🧩
Our analysis is a sentiment for the upcoming week, month.
Use this as a weather forecast, you are the person that has to put on a jacket when it’s raining.
Trade this sentiment based off your own entry strategy at the right time.
Flow with the Devil 😈
Trade with the manipulation👾
