USDCADIs USDCAD exhausting at resistance zone?
As the price is been on high bull run but now it seems like price is lacking bullish momentum after printing double top pattern at resistance level and bearish divergence( on lower time frame) suggesting the sell pressure is about to start.
If the bears took control , the 1st target could be 1.3430
What you guys think of it?
Usdcadshort

USDCAD Short Idea from Eliot Wave and Trend AnalysisAs you see on the cart clearly up trend in channel. And i think eliot wave is completed so now we are in the area of ABC correction. so i see an opportunity for selling.
Min Target: 1.35

USDCAD - Potential long position ✅Hello traders!
‼️ This is my perspective on USDCAD.
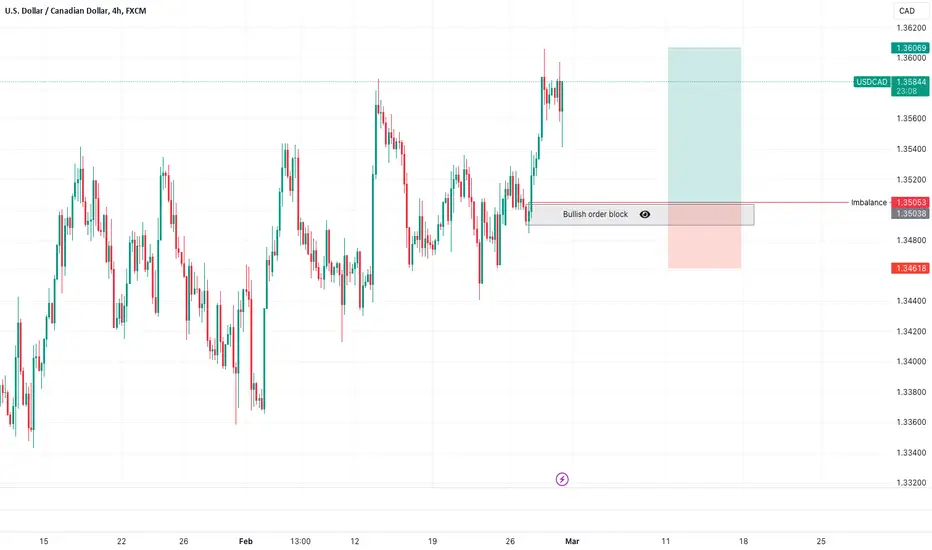
Technical analysis: Here we are in a bullish market structure from 4H timeframe perspective, so I am looking for a long. I wait price to make a retracement to fill the imbalance lower and then to reject from bullish order block + institutional big figure 1.35000.
Like, comment and subscribe to be in touch with my content!
USDCAD - Bullish continuation ✅Hello traders!
‼️ This is my perspective on USDCAD.
Technical analysis: As I expected in my previous analysis price filled the imbalance and rejected from support zone. Now I expect bullish continuation and my target is buy side liquidity.
Like, comment and subscribe to be in touch with my content!

USDCAD Trading Plan - 20/Feb/2024Hello Traders,
Hope you all are doing good!!
I expect USDCAD to go Down after completing this correction.
Look for your SELL setups.
Please follow me and like if you agree or this idea helps you out in your trading plan.
Disclaimer: This is just an idea. Please do your own analysis before opening a position. Always use SL & proper risk management.
Market can evolve anytime, hence, always do your analysis and learn trade management before following any idea.

USDCAD, It can be sell opportunity
Well as you can see the price created the inversion FVG at the 4-hour chart.
Now, if the price stays below this inversion we can target the sell-side liquidity.
On the other hand, if the price tries to move higher, liquidity above 1.36188 can be the price target.
💡Wait for the update!
🗓️21/02/2024
🔎 DYOR
💌It is my honor to share your comments with me💌

USDCAD Long Term buying Trading IdeaHello Traders
In This Chart USDCAD HOURLY Forex Forecast By FOREX PLANET
today USDCAD analysis 👆
🟢This Chart includes_ (USDCAD market update)
🟢What is The Next Opportunity on USDCAD Market
🟢how to Enter to the Valid Entry With Assurance Profit
This CHART is For Trader's that Want to Improve Their Technical Analysis Skills and Their Trading By Understanding How To Analyze The Market Using Multiple Timeframes and Understanding The Bigger Picture on the Charts

Trade idea: Canadian inflation data tomorrow On Tuesday, February 20, Canada will unveil the latest inflation data. It is anticipated that headline annual inflation will decrease to 3.2%, marking its first deceleration since October 2023, compared to December's figure of 3.4%. Bear in mind, the Bank of Canada's previously indicated that they expected inflation to persist near 3.5% until mid-2024. The forecasts obviously suggest a slight easing.
Various commercial banks offer a range of forecasts too. ING predicts 3.1%, Wells Fargo anticipates 3.2%, National Bank Financial (NBF) estimates 3.3 to 3.4%, CIBC forecasts 3.3%, and Citi expects 3.4%.
On the chart. the USDCAD faces challenges breaching the 1.3500 resistance line, but it currently hovers just above a supply zone and right on the threshold of its bullish trend line.
The next potential targets are in the range of 1.3530 to 1.3550, with December high at 1.3620, just above this.
It's worth noting that both Canada and the US observe bank holidays on Monday, which could lead to reduced trading volumes.

USD/CAD still selling offEarlier I posted a USD/CAD SHORT trade which was unforunately blocked because of a TV house violation I was unaware off bit one that I fully understand.
I had an initial target for this trade at 1.3492 which we have reached.
There's no sign that this pair have finished selling off following the major Retail Sales shock out of the US.
Core Retail Sales were expected in at +0.2% but missed by an astonishing 8 points to come in at -0.6%.
This has seriously impacted all USD pairs and as I'm in this USD/CAD SHORT I see no reason to close the position just yet.
My next target is 1.3470.

USDCAD - Still bullish ✅Hello traders!
‼️ This is my perspective on USDCAD.
Technical analysis: Here we are in a bullish market structure from 4H timeframe perspective, so I am looking for a long. I want price to go a little bit lower to fulfill the imbalance and then to reject from support zone for a long position.
Like, comment and subscribe to be in touch with my content!

⤵⤵ USD CAD bearish candle channel pattern) 🟢🟢⤵Hello traders what do you think about USD CAD)
(Technical analysis channe)
USD CAD) M 30 Team frame 🖼️ looking 👀 bearish candle channel pattern usdcad returning resistance levels 1.35167) fullback short 1.33709)
Safe trade ❤ plaes like ❣️ and comments posted)

USD / CAD Long Still very choppy but im long bias, but in order to take the entry I would be looking for break out of the wedge shape pattern with a 4h close above blue zone above structure.
Alternatively I would be looking for a pull back and rejection from the bottom of structure with a long back to the top.

USDCAD Short From Resistance!USD-CAD will soon hit
The horizontal resistance
Of 1.35257 from where
We are likely to see
A local bearish correction !

USDCAD,🔴Will the price drop further?🔴
As you can see, I expected that the price rose to more than 180 Pips and had a bearish reaction after collecting the liquidity above the previous high.
Now, by examining the 12-hour chart we can see the price created the FVG and I expect it to fill in the short term, then we can define a bullish order block where we should study the price in the lower time frame and see the bullish reaction in this zone.
So if the price stays below 1.3506, the price falls more to 1.3366- 1.33875
💡Wait for the update!
🗓️07/02/2024
🔎 DYOR
💌It is my honor to share your comments with me💌

Sell USDCAD Bearish ChannelThe USD/CAD pair on the M30 timeframe exhibits a potential selling opportunity due to a well-defined bearish channel pattern. This pattern suggests ongoing selling pressure and a higher likelihood of further declines in the coming minutes or hours.
Key Points:
Bearish Channel: As visualized on the M30 chart, the price has been confined within a descending channel characterized by two falling lines: a resistance line and a support line. This ongoing downtrend signals continued selling pressure.
Sell Entry: Consider entering a short position around the current price of 1.3460, positioned close to the channel resistance. This offers an entry point near a potential reversal zone.
Target Levels: Initial bearish targets lie at the support levels of 1.3414 and 1.3396, marking previous support zones within the channel.
Stop-Loss: To manage risk, place a stop-loss order above the channel resistance line at 1.3485. This helps limit potential losses if the trend unexpectedly breaks upwards.
Thank you

USDCAD - Long opportunity ✅ Hello traders!
‼️ This is my perspective on USDCAD.
Technical analysis: Here I think we are still bullish, so I am looking for short. I expect price to continue the retracement to fill half of imbalance and then to reject from support zone + institutional big figure 1.34000.
Fundamental news: Tomorrow we will see results of Unemployment Rate on CAD.
Like, comment and subscribe to be in touch with my content!

Yemi_Fx1 | Similar view and bias of USDJPY(Short)on USDCAD Both OANDA:USDJPY and OANDA:USDCAD has similar view, Short opportunity also on usdcad, I'm looking forward to price to test and validate the resistance zone at price 1.34940 , then before going short.

USDCADIs USDCAD exhausting at resistance zone?
As the price is been on high bull run but now it seems like price is lacking bullish momentum after printing double top pattern at resistance level and bearish divergence( on lower time frame) suggesting the sell pressure is about to start.
If the bears took control , the 1st target could be 1.3350.
What you guys think of it?

USDCAD SHORT POSITIONas you can see the price has completed 3 drive pattern also RSI divergence confirmed the bearish movement
please follow and support for more

USDCAD Sell-Short Trade Idea15minute timeframe entry
After NFP session Friday price has reached new highs. Scaling into lower timeframes we're anticipating the sell off to rebalance market structure.

USD/CAD - Sell Trend with resistance level of weekly and dailyHello everyone ...
if price break our entry areas then this idea will be invalid..
Use good trade management only thing important in Trading is how you manage your trade...
our signals are 95% accurate give us follow and motivate us by likes and comments...
.. good luck..

USDCAD !!! 31/1/24 TREND DOWN ! SELL NOW ⭐️ Smart investment, Strong finance
⭐️ USDCAD INFORMATION:
During the early Asian session on Wednesday, the USD/CAD pair ends its four-day losing streak. The recovery of the pair is supported by positive US job openings and consumer confidence data, which contribute to the strengthening of the US dollar (USD). The focus is now on the Federal Reserve (Fed) monetary policy meeting scheduled for Wednesday, where no changes in interest rates are expected. Currently, USD/CAD is trading at 1.3405, showing a 0.04% gain for the day.
Unexpectedly, the number of available jobs in the US increased in December to 9.026 million, as reported by the Bureau of Labor Statistics on Tuesday. This marks the first time that job openings have surpassed 9 million since September. In addition, the Conference Board Consumer Confidence index rose to 114.8 in January, compared to the previous reading of 108.0, reaching its highest level in two years.
⭐️ Personal comments NOVA:
The long-term price range is still in a DOWN trend, the next bottom is gradually lower than the previous bottom. Touching the trendline sets up a SELL signal. CAD economic data also does not have much important information
⭐️ SET UP PRICE:
🔥SELL USDCAD zone: 1.34200 - 1.34350 SL 1.34800
TP1: 1.33900
TP2: 1.33600
TP3: 1.33300
⭐️ Technical analysis:
Based on technical indicators EMA 34, EMA89 and support resistance areas to set up a reasonable SELL order.
⭐️ NOTE:
Note: Nova wishes traders to manage their capital well
- take the number of lots that match your capital
- Takeprofit equal to 4-6% of capital account
- Stoplose equal to 2-3% of capital account
- The winner is the one who sticks with the market the longest

USDCAD Local Short! USD-CAD went up to retest
The horizontal resistance
Of 1.34272from where
I think we will see
A local move down !
