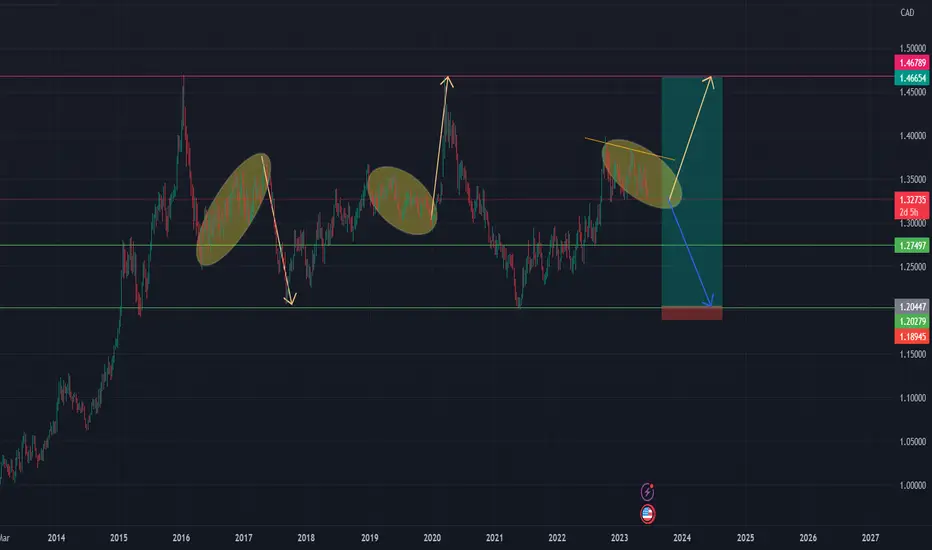
SHORT - USDCAD (D) (30 May 2023)Position Trade - USDCAD
In the Monthly Chart,
- Price is reaching again the Supply zone
- Although price has been testing it over the years, the Supply zone has been holding. Thus, the price may reach deeper into the zone before dropping again, thereby presenting opportunities in the lower TFs i.e. WK or D1 for SHORTS
In the Weekly Chart,
- 2 things can happen
- Either the price can break the Weekly demand OR the price will reach into Monthly Supply first and come down with good departure candles, then we can look for SELLS in the Daily timeframe.
Usdcadshort

USDCAD TradeAfter the liquidity taken and change of character and the rejection of the FVG we will see a drop in the price it's just idea

USDCADI think that the last downward movement can be up to OB or the bottom of the channel, of course, the end of the classic pattern is AB=CD and then the upward movement.

USDCAD - Short active ✅Hello traders!
‼️ This is my perspective on USDCAD.
Technical analysis: Here we are in a bearish market structure from 4H timeframe perspective, so I am looking for shorts. I expect bearish price action from here as we can see that price rejected from half of imbalance + 1H breaker block.
Fundamental analysis: Tomorrow we have news on CAD, will be released monthly GDP, which is forecasted to increase, this means strength in currency.
Like, comment and subscribe to be in touch with my content!

USDCAD⚠️ALERT:Reaction from SELL Zone✔️USDCAD is expected to fall
✔️Recommended to consider Selling from Seller Limit Area
1.3278 & 1.3250 Zone
Now try to move down with new Sellers.
⚠️SELL the TOPS!!!

📌 Potential SELL setup for: USD/CAD👩🏽💻 Technical: The USD/CAD pair has shown some intense selling pressure recently, hitting new daily lows. Yet, it keeps bouncing off the 1.3140 level on the 1-hour and 4-hour charts. This stubborn support is a clear sign of a tight competition between buyers and sellers.
🎯 For an ideal entry: For those who prefer safe plays, patience is key. Hold off any action until there's a clear break below the support, ideally with a push > exhaustion to affirm bearish bias.

USDCAD Long Term Buying IdeaHello Traders
In This Chart USDCAD DAILY Forex Forecast By FOREX PLANET
today USDJPYD analysis 👆
🟢This Chart includes_ (USDCAD market update)
🟢What is The Next Opportunity on USDCAD Market
🟢how to Enter to the Valid Entry With Assurance Profit
This CHART is For Trader's that Want to Improve Their Technical Analysis Skills and Their Trading By Understanding How To Analyze The Market Using Multiple Timeframes and Understanding The Bigger Picture on the Charts

usdcad with a strong bearish leg, where next?USDCAD after failing to trend upwards and ranging for the first 2 trading days of the week, has finally made the push downwards fulfilling my price speculation and weekly bias. Check out my previous publication for an image and explanation of what i expected going into the week, and now where could price possibly be headed going into the remaining 2 trading days of the week . please follow so as to get the next idea i publish on where the price could possibly be headed and more so other future publications by me.

USDCAD BearishCanadian dollar is much stronger against the US dollar. For the time being there is some chances that USD may rise little bit and then it will hard as per my analysis.

USDCAD - Sell#USDCAD in This Setup USDCAD is Clearly going to down after some restressing
Best Enter after Market Opining

USDCAD Local Bearish Bias!USD-CAD is now consolidating
Below a broken key horizontal
Level of 1.33200 after the
Bearish breakout of the Double Top pattern
so I am Somewhat bearish biased
And I think that we will
See a move down !

Bearish Outlook on USDCAD - 16 Jun 2023On the 4H timeframe, there is bearish order flow, forming lower highs and lower lows. A pullback to key resistance zone at 1.3350, which is in line with the 50% Fibonacci retracement level, could provide the bearish acceleration to the support zone at 1.3000, which coincides with the 261.8% Fibonacci extension level. Price is hovering below the 20 EMA and ichimoku cloud, supporting our bearish bias.

USDCAD analysis (1W time frame)On the chart we can see that the price is in the middle of the range. We expect that the price will come back down and will retest the key support at the bottom of the range. It may take some time, but we believe that it will happen in 2024. It would be our entry for a long position.
From another hand, if the price pump and reach the top of the range , it may be a good place to enter short position.
In this case the stop loss should be put above the resistance.
2 possible scenarios are shown on the chart
Good luck
USDCAD Potential ReversalIn my opinion, USDCAD appears to be showing signs of a potential reversal as it forms a falling wedge pattern on the 1-hour timeframe, with the current price finding support at a specific level. The falling wedge pattern typically indicates a bullish reversal, suggesting that the downward momentum may be weakening.
Considering this pattern and the support level, traders might consider a potential long position on USDCAD. However, it's important to manage risk effectively. Setting a stop loss at 1.3276 can help limit potential losses if the market moves against the anticipated reversal. Additionally, a take profit level of 1.3439 can be considered as a target to capture potential gains.
Looking forward to read your opinion about it.

Is it time to add buys in USD/CAD? Detailed analysis below!Dear traders, after Bank of Canada's rate event yesterday, USD/CAD dropped
to the 1.3321 level. However, the fall was arrested as it is a strong support level .
Based on the current price action, it seems the 1.3320 support level would continue
to hold.
So, if price action becomes bullish at this level and the support level stays
unbroken, traders can consider going long USDCAD@1.3320 with SL below 1.3250
and TP at 1.3650 .

USD/CAD: Consolidation Calm Before the Storm? The USD/CAD has been consolidating since late last Friday. Key levels include 1.346 and 1.345 for the upper bound and 1.341 and 1.340 for the lower bound. The market appears to be in the middle of the storm that might be unleashed after the Bank of Canada’s (BoC) interest rate decision on Wednesday.
In January, the BoC made history by being the first major global central bank to stop its rate-hiking cycle and has kept rates unchanged at its last two policy meetings. However, the economy's unexpectedly robust performance since then has placed the bank in a challenging position and will test its determination to maintain a neutral stance.
After declining from its peak at 8.1% in 2022, inflation in Canada unexpectedly experienced its first increase in 10 months, surging to 4.4% in April from 4.3% in March. The increase is being attributed to the recent rebound in Canada's housing market.
The current market consensus is for an approximately 40% to 45% chance of a 25-basis-point interest rate hike on Wednesday. According to some, this is underestimating the possibility of a rate hike. Which means that the lower bounds of the current consolidation band could easily be tested (and broken) in the lead up to the interest rate decision.
On the other side of the trade, the US dollar faced obstacles as it was revealed that the US services sector experienced minimal growth in May, primarily due to a slowdown in new orders. This news brought an end to the initial surge in the USD, which was triggered by incredibly robust job growth.

USDCAD Top-down analysisHello traders, this is a complete multiple timeframe analysis of this pair. We see could find significant trading opportunities as per analysis upon price action confirmation we may take this trade. Smash the like button if you find value in this analysis and drop a comment if you have any questions or let me know which pair to cover in my next analysis.

USDCAD POTENTIAL SHORTSUSDCAD made a reasonable impulse from the channel and has currently printed another continuation pattern.
looking forward to taking the break outside the pattern and setting my stops just above.

USDCAD POTENTIAL LONG FORMATION IN PROGRESSUSDCAD seems to have turned bullish on multiple time frames. We are waiting for a correction to end on the lower time frames before we enter long.
Various factors and patterns supporting out bullish stance has been plotted on the price chart.

USDCAD Analysis H1Here is my view for USDCAD on H1. The price could go bearish, you can put a pending order on the Order block or find an entry on LTF within OB Zone. Trade Safe!

SHORT USDCADThis pair broke the uptrend trend lines and now forming down trend. it is forming a flag which we expect it to move down at London or US session.

USDCAD Swing Short Forecast!USD-CAD broke a support
Cluster of the horizontal
And rising support levels
Around 1.358 and the
Breakout is confirmed
Because the 4H candle
Closed below the confluence
So a bearish continuaton
Is now to be expected on
The pair after the
Potential pullback !

USDCAD Sell TF H4. TP = 1.3499On the 4-hour chart the trend started on May 26 (linear regression channel).
There is a high probability of profit. A possible take profit level is 1.3499
But do not forget about SL = 1.3656
Using a trailing stop is also a good idea!
Please leave your feedback, your opinion. I am very interested. Thank you!
Good luck!
Regards, WeBelieveInTrading
