USDCAD: BEARISH Market Analysis! Watching for CONTINUATIONHello, everybody and welcome to Cybernetics Trading Lab, today we are going to analyse the USDCAD, translating the market information by using a full technical analysis on different time frames, giving you a personal opinion about the next most likely market movement and helping you to spot and manage market opportunities.
Top Down Technical Analysis:
In higher time frame the market reached and interesting level, double topping and reversing, forming a potential head and shoulders.
The market then proceeded breaking the neckline and starting dropping down, confirming the beginning of the impulsive phase.
In lower time frame, since the half of November, the market has been consolidating creating a potential corrective structure, with a good possibility to continue its previous downtrend, targeting at least the bottom of the LTF structure.
When, where and why would we step into the market?
Considering the overall bearish momentum, we will be looking to short this market in the scenario it will breakout the structure to the downside, correcting for a further down move.
However, no trade is guaranteed and the market could proceed to the upside invalidating out trade setup, forming eventually a deeper structure or a reversal pattern.
If you enjoy this trade idea, please support our work with a thumb up and don’t forget to follow our social medias!
Sincerely,
Cybernetics Trading Lab
DISCLAIMER
Please note the views are not investment advice and should be used only for educational purpose.
Usdcadshort

usdchfshortIf we see the entry signal in this zone with the set loss limit, we will enter the matter of the degree of ascent, but keep in mind that this signal is used in the upper periods, so you must be patient enough, but if the goals are achieved, there will be a good profit.

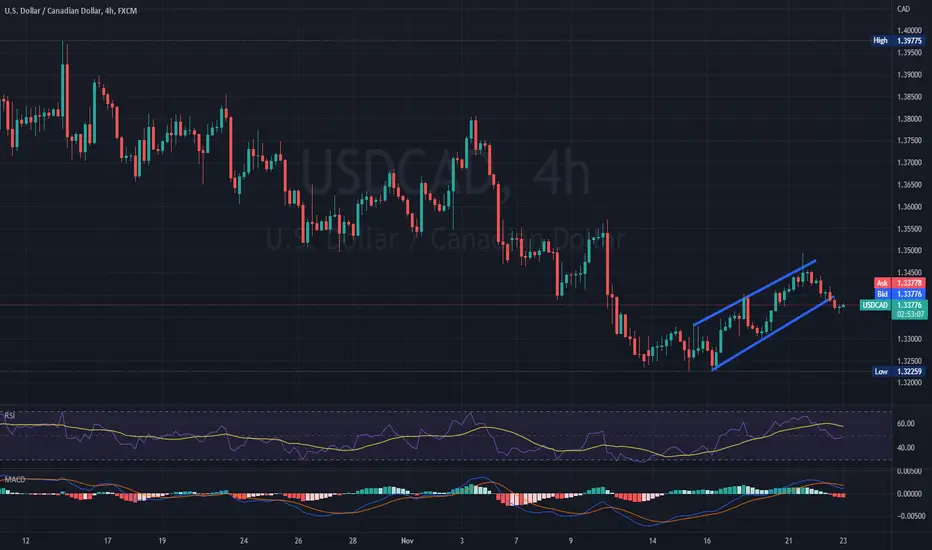
USDCAD DOWNTREND FORMATIONUS dollar stopped its gain and reverted against the most major currencies. On the 4H graph against Canadian dollar, the instrument managed to break the support of the forming uptrend channel and started reverting into downturn.
MACD histogram indicator is confirming this downtrend, the RSI fast moving line is already below the 50 neutral line, but with clearly expressed downtrend.
If this trend continues the price might test levels of 1.3349 but in the opposite scenario the price might try to reach its previous resistance at 1.3403
Risk Disclosure: Trading Foreign Exchange (Forex) and Contracts of Difference (CFD's) carries a high level of risk. By registering and signing up, any client affirms their understanding of their own personal accountability for all transactions performed within their account and recognizes the risks associated with trading on such markets and on such sites. Furthermore, one understands that the company carries zero influence over transactions, markets, and trading signals, therefore, cannot be held liable nor guarantee any profits or losses.
USDCAD - Daily Trade Idea - 23-Nov-22USDCAD (SHORT)- If all the resistance holds in place.
If we see the Resistance broken out then we could see the shift in the trend.
I marked the TP 1 (20 pips), TP 2 (50 pips) , TP 3 (100 pips) and EXIT (SL - 60 pips) on the chart.
(THIS IDEAS VALID NEXT 24 HOURS)
Please note this is only the Trade Idea base on S & R and not a signal, the market can react differently during the session due to News Impact and only enter if we have the final confirmation for entry.
- Rejection Candle Formation - Red Candle after the Green Candle.
- Stochastic - Overbought Area
- Timing of entry Prior / during UK / US Market Session.

USDCAD Sell!!USDCAD has created a beautiful and rather neat Head and Shoulders Pattern . Recently, the price tested the neck of the pattern and got pushed down ! not just the retest but also the fact that price is now back inside the parallel channel on the daily chart is a good confirmation of a downward move ! my final Target is 1.3069 ( the pivot line of the parallel Channel )

USDCADHi traders, watch USDCAD with your own according strategy and look for a short position opportunity for a short term trade setup GOOD LUCK.

USDCAD - FUNDAMENTAS WITH TECHNICAL LEVELS#USDCAD
USDCAD is now quite BUY. This is because OIL is slightly WEAK, CAD is WEAK and USD is slightly UP with RETAIL SALES being POSITIVE. Also, MARKETS RISK has been ON again due to this reason. But this time US CPI data was NEGATIVE. The FOMC OUTLOOK was also very NEUTRAL. So now USD is very WEAK. But now with US YEILD getting a good CORRECTION, USD is moving UP.
USDCAD MARKET is currently DOWN due to US DATA and UPDATES being NEGATIVE and MARKET SENTIMENT being RISK ON. We think it will go up to the 1.3810 level before going down again. Also, with this MARKET RISK ON SENTIMENT, the USDCAD PRICE can SELL to the 1.2800 LEVEL in the future.
In any case, there will be an opportunity to SELL USDCAD up to 1.2800 LEVEL. We wait until the DOWN TREND CONTINUES. MONDAY may be RISK ON again according to MARKET UPDATES. So follow the given STRUCTURE. It is seen that the OVERALL MARKET SENTIMENT has become POSITIVE.

USDCADOpinion for USDCAD. I was waiting to go in the light blue area to bounce back down but it may start selling from here.

usdcad short 4h If we see the entry signal in this zone with the set loss limit, we will enter the matter of the degree of ascent, but keep in mind that this signal is used in the upper periods, so you must be patient enough, but if the goals are achieved, there will be a good profit.

USDCAD - Short bearish orderblock ✅Hello traders!
‼️ This is my analysis on USDCAD.
Here we are bearish from H4 timeframe perspective, so I am looking for shorts. I expect price to continue the retracement to fill the imbalance higher and then to reject from bearish orderblock + institutional big figure 1.35000.
Like, comment and subscribe to be in touch with my content!

USDCAD SELL LIMITGood day everyone! Don't forget to put your thumbs up and write comment if you like the idea.
USDCAD sales 1.3360 and 1.3400. CT 1.3460. Risk 1%. Sale from the bottom edge of the weekly center and the day edge of accumulation. The first target is standard and global target to break through area 1.3220 and leave at 1.3120.
DISCLAIMER:
The opinion of the author may not coincide with yours! Keep this in mind and consider in your trading transactions before making a trading decision.

USDCAD: Bearish Wave Should Come SoonUSDCAD: Bearish Wave Should Come Soon
We are observing this pattern since many days now.
After the price broke below the patterns's neckline it continued
lower and not it looks like it is developing a large correction.
For the time being the correction is very ugly and risky but we can
see something clear very soon before the next bearish wave.
Don't miss it...
Thank you and Good Luck!

USDCAD M30: Bullish outlook seen, further upside above 1.33000On the M30 time frame, a throwback to the support zone at 1.33000, in line with the Fibonacci confluence levels presents an opportunity to play the bounce with 1.33900 as the resistance target. The 1.33900 resistance zone coincides with the graphical support-turned-resistance zone and 50% Fibonacci retracement. Failure to hold above the 1.33000 support zone could see prices push lower to the next support zone at 1.32500. Prices are holding above the Ichimoku cloud as well, supporting the bullish bias.

USDCAD top-down analysisHello traders, this is a complete multiple timeframe analysis of this pair. We see could find significant trading opportunities as per analysis upon price action confirmation we may take this trade. Smash the like button if you find value in this analysis and drop a comment if you have any questions or let me know which pair to cover in my next analysis.

USDCAD SHORT POSITIONEnjoy its looking good to entry on this area because we have two confirmation.1st it is on the support area and on the LL position of the trend so now it will bounce back to its LH but entry with good money management

USDCAD top-down analysisHello traders, this is a complete multiple timeframe analysis of this pair. We see could find significant trading opportunities as per analysis upon price action confirmation we may take this trade. Smash the like button if you find value in this analysis and drop a comment if you have any questions or let me know which pair to cover in my next analysis

USD/CAD Running In 260 Pips 0 Drawdown F Last Video, New Entry This Is An Educational + Analytic Content That Will Teach Why And How To Enter A Trade
Make Sure You Watch The Price Action Closely In Each Analysis As This Is A Very Important Part Of Our Method
Disclaimer : This Analysis Can Change At Anytime Without Notice And It Is Only For The Purpose Of Assisting Traders To Make Independent Investments Decisions.

USDCAD - PRICE GOING FOR 1.30000 ZONEThey say never time the market. Well, I make profits from timing the market. "LOOK BEFORE YOU LEAP". USDCAD has respected my analysis just like many other pairs I'm analyzing. The market-maker did push the price to around 1.39900 to take out some STOP LOSSES. Now price is headed for the 1.30000 zone (My 1st TP). I'm in deep profits and will be taking partial profits at the 1.30000 zone. Congratulations if you were BEARISH on this pair with me!
.............................................................................................................................................
Check out my previous analyses

USDCAD - BIG Short Pending - Trade Like BatManUSDCAD is preparing a BIG downtrend.
A bearish swing is pending, with multiple patterns displayed.
Technical Analysis & Patterns:
- Double Top (Traditional Tech.)
- Bearish Bat (Harmonics)
- Wave B Retracement (ABC)
- Bear Flag
- 61.8% Fibonacci Retracement
Many pips ahead and stay awesome Gotham!

USDCAD Bearish Bias!USD-CAD was trading in an uptrend
But now we are seeing a bearish breakout
Of the rising support line
So after the retest of the horizontal resistance at 1.38093 above
I think the move down is likely

USDCAD: The Bearish Move Is Not Over YetUSDCAD: The Bearish Move Is Not Over Yet
This is an idea I shared 3 days ago.
After the price completed the Head & Shoulder pattern, the bearish wave reaction was very aggressive.
The price has already reached the first target and only by calculating it from the neckline of the pattern it was 160 pips😁
Considering the current political situation in the U.S, the price should continue to move lower even if we see any minor correction on the way down.
Objectives:
🎯 1.33417 done :)
🎯 1.31713
🎯 1.29887
Thanks and good luck!
Previous Analysis:USDCAD: The Bearish Move Is Not Over Yet

USDCAD top-down analysisHello traders, this is a complete multiple timeframe analysis of this pair. We see could find significant trading opportunities as per analysis upon price action confirmation we may take this trade. Smash the like button if you find value in this analysis and drop a comment if you have any questions or let me know which pair to cover in my next analysis.

USDCAD - Daily Trade Idea - 11-Nov-22USDCAD (SHORT)- If all the resistance holds in place.
If we see the Resistance broken out then we could see the shift in the trend.
I marked the TP 1 (20 pips), TP 2 (50 pips) , TP 3 (100 pips) and EXIT (SL - 60 pips) on the chart.
(THIS IDEAS VALID NEXT 24 HOURS)
Please note this is only the Trade Idea base on S & R and not a signal, the market can react differently during the session due to News Impact and only enter if we have the final confirmation for entry.
- Rejection Candle Formation - Red Candle after the Green Candle.
- Stochastic - Overbought Area
- Timing of entry Prior / during UK / US Market Session.
