Usdcadshort
USDCAD Head and Shoulder PatternUSDCAD formed a nice Head and Shoulder Pattern and now is testing the ressistance of the base of Head and Shoulder Structure.
if we see clear rejection, a short trade can be taken with very good risk/reward ratio

usdcadhi
the market structure is down and we have alot of sl in daily structure we need a good area for sell and i think i can find this in m30
goodluck

USDCAD; HEAD & SHOULDERS BROKENThe head and shoulders structure's support has been broken and price has retested this new resistance. Price may sell off to the next support level at 1.316, a distance equal to the Height of the broken HEAD & SHOULDERS structure.

USDCAD SHORTPlease comment and let me know thought's, hoping to get a nice entry from this order block!
USDCAD SHORT

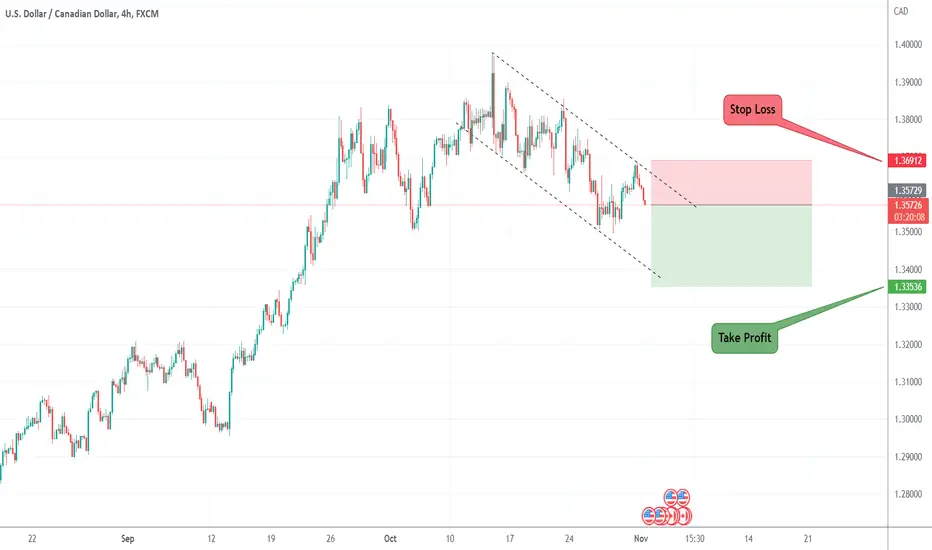
Possible Head & Shoulders; USDCADGood Day All,
Stumbling across the USDCAD 1D Chart, I observed a possible Head & Shoulders pattern ranging from 23th Sept to 4th Nov.
Though by chance, After the major price rejection at 1.39790 not letting price touch the 1.4 mark, The traders seems to have taken control sending it down a controlled pattern giving Novice Traders like myself the idea it'll fall.
At first sight it may seem the case but by recent personal events I've determined it isn't always the case.
Do pay attention to incoming news and such as they can either slingshot prices toward the SL or the TP hopefully.
Please do your own analysis first before deciding whether to follow this or not, while I may not mind sharing gains, I wouldn't like to see others suffer losses due to my own.
Recommended Order Type : Market Sell
Take Profit 1 : 1.33250
Take Profit 2 : 1.32600
Take Profit 3 : 1.31820
Stop Loss : 1.35750
R/R Ratio : 2+ (ONLY IF TP3 HIT!)
R/R Ratio : 0.9 (TP 1)
Prediction Nullifying Requiems: Price out of bounds or beyond the 1 W mark.
P/S: Do Consider Lowering The SL before letting it run as R/R seems a bit low.

USDCAD - Daily Trade Idea - 9-Nov-22USDCAD (SHORT)- If all the resistance holds in place.
If we see the Resistance broken out then we could see the shift in the trend.
I marked the TP 1 (20 pips), TP 2 (50 pips) , TP 3 (100 pips) and EXIT (SL - 60 pips) on the chart.
(THIS IDEAS VALID NEXT 24 HOURS)
Please note this is only the Trade Idea base on S & R and not a signal, the market can react differently during the session due to News Impact and only enter if we have the final confirmation for entry.
- Rejection Candle Formation - Red Candle after the Green Candle.
- Stochastic - Overbought Area
- Timing of entry Prior / during UK / US Market Session.

USD/CAD Made Head&Shoulders Pattern,Short Entry To Get 300 PipsThis Is An Educational + Analytic Content That Will Teach Why And How To Enter A Trade
Make Sure You Watch The Price Action Closely In Each Analysis As This Is A Very Important Part Of Our Method
Disclaimer : This Analysis Can Change At Anytime Without Notice And It Is Only For The Purpose Of Assisting Traders To Make Independent Investments Decisions.

USDCAD possible sell zone!!USDCAD 4h, After NFP release USDCAD has changed it's uptrend to downtrend on the lower timeframe. As the price has broken down with a strong momentum, currently the price retracing to the previous resistance turned support. It is highly likely price will test the 20EMA on the 4h and will bounce off. Upon rejection a sell trade is high probable targeting monthly support level.

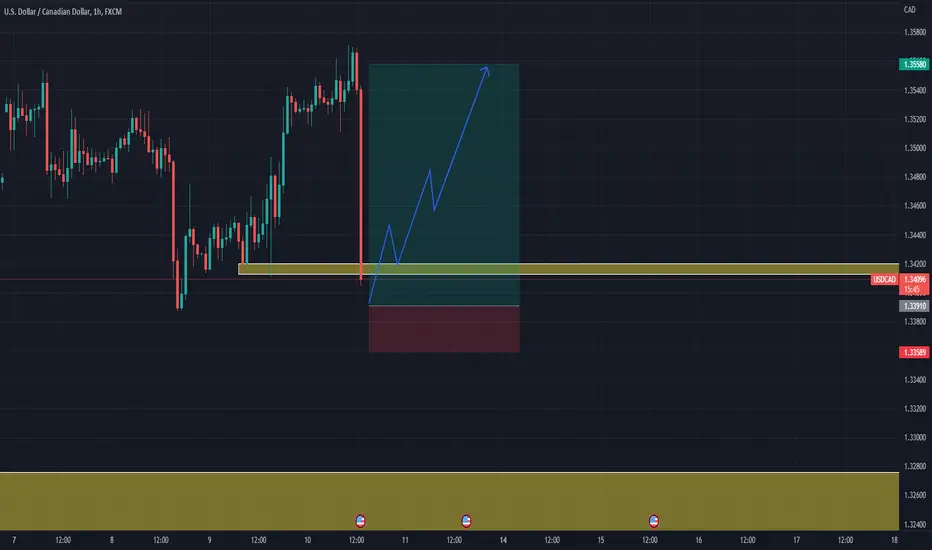
Update On USDCAD SELL 450 Pips Profit & CountingA quick update on the SELL position from the other week the trade has been running nicely and is approaching the first target of 1.34 have closed 50% of position and moved STOP loss to 1.37.
Read the related post to see how I spotted this trade setup

USDCAD - Daily Trade Idea - 8-Nov-22USDCAD (SHORT)- If all the resistance holds in place.
If we see the Resistance broken out then we could see the shift in the trend.
I marked the TP 1 (20 pips), TP 2 (50 pips) , TP 3 (100 pips) and EXIT (SL - 60 pips) on the chart.
(THIS IDEAS VALID NEXT 24 HOURS)
Please note this is only the Trade Idea base on S & R and not a signal, the market can react differently during the session due to News Impact and only enter if we have the final confirmation for entry.
- Rejection Candle Formation - Red Candle after the Green Candle.
- Stochastic - Overbought Area
- Timing of entry Prior / during UK / US Market Session.

USDCAD Nov 07 2022USDCAD
Selling opportunity.
Price made a break of structure on higher time frames.
Now we wait for it to approach our Supplly zone.

USDCADso this is a tricky area for cad the main thing is the trend is down so im looking and waiting for sell setups at the moment
now with that being said there is equal lows meaning theres a nice amount of liquidity resting below 1.34600 area so im looking for break of that for a sell or for buyers to push price up to retest that trend line area possible even retest the orderblock for a nice move down just have to wait for the setup to break structure to the downside b4 getting in

USDCAD ! It looks like a Head and shoulders pattern, short ideaUSDCAD has been trading in an ascending channel for a long time. I currently see a USDCAD made Head and shoulders pattern on the daily chart, but neckline has not been broken yet. If the neckline breaks, of course it will be confirmed. Therefore, it is too early to see long trades, I think you should open a long trade test 100 EMA..

USDCAD - Daily Trade Idea - 7-Nov-22USDCAD (SHORT)- If all the resistance holds in place.
If we see the Resistance broken out then we could see the shift in the trend.
I marked the TP 1 (20 pips), TP 2 (50 pips) , TP 3 (100 pips) and EXIT (SL - 60 pips) on the chart.
(THIS IDEAS VALID NEXT 24 HOURS)
Please note this is only the Trade Idea base on S & R and not a signal, the market can react differently during the session due to News Impact and only enter if we have the final confirmation for entry.
- Rejection Candle Formation - Red Candle after the Green Candle.
- Stochastic - Overbought Area
- Timing of entry Prior / during UK / US Market Session.


USDCADit seems DXY get some down reactions of M4 level and Usd/Cad going to down.
I think Usd/Cad goes with head and shoulders pattern and we can sell 1:1.8 RAW

USDCAD - Sell-off expected ✅Hello traders!
‼️ This is my analysis on USDCAD .
Here we are bearish from H4 timeframe perspective, so I am looking for shorts. I expect bearish price action from this bearish orderblock + institutional big figure 1.38000 after price filled the imbalance.
Like, comment and subscribe to be in touch with my content!

USDCAD ShortPrior to the news in a short while, this price action in usdcad is showing high probability of price reversing here. Currently it has taken the Buyside liquidity of the previous day at a standard deviation of 2 from the cbdr, and has shifted bearish on the 15m TF and LTF .
Daily price is exactly at a bearish Orderblock. Expecting to see price move from internal to external liquidity now.


USDCAD SHORT POSITIONOnce again another best trade entry to bearish zone its move from HL & HH to HL & LL. short after the price reach the HL

USDCAD,you can have short and logn position.you can have a lot of point to enter,but do all of them take profit? definitely not. you should pay attention to choose positions and wait.
so, there are two point for usdcad and you can enter the trade after waiting and the price reaches to zone

USDACAD SELL LONGUSD/CAD is the abbreviation for the U.S. dollar versus Canadian dollar (USD/CAD) currency pair. The quote given for the USD/CAD currency pair tells the reader how many Canadian dollars (the quote currency) are needed to purchase one U.S. dollar (the base currency).