USDCAD sell the breakdown!!USDCAD 4h has formed a strong reversal pattern on the lower timeframe and the price currently breaking out of the previous support zone. As the market is over-extended, it is highly likely that USDCAD will reverse from this zone to test long-term monthly resistance turning support. Before, reversal, we could see a long spike to the upside and, upon rejection, a sell trade is highly probable!
Press the like button if you enjoy this content!!
Usdcadsignal

DeGRAM | USDCAD at strong resistence USDCAD moved out of the ascending channel.
The market formed a double top with divergence at a strong resistance level 1.38000.
Price was rejected by the level.
We expect short-term term pullback.
-------------------
Share your opinion in the comments and support the idea with like. Thanks for your support!

usdcad ready to fly wait for retestusdcad ready to fly wait for retest the demand zone we are looking bullish from the demand zone.are you ready to for flying

USDCAD top-down analysisHello traders, this is a complete multiple timeframe analysis of this pair. We see could find significant trading opportunities as per analysis upon price action confirmation we may take this trade. Smash the like button if you find value in this analysis and drop a comment if you have any questions or let me know which pair to cover in my next analysis.

USDCAD Idea H1Here is my view for USDCAD on H1. The price could go up, you can put a pending order on the Order block or find an entry on LTF within OB Zone. Trade Safe!

USDCAD top-down analysisHello traders, this is complete multiple timeframe analysis of this pair. We see could find significant trading opportunity as per analysis upon price action confirmation we may take this trade. Smash the like button if you find value in this analysis and drop a comment if you have any questions or let me know which pair to cover in my next analysis.

USDCAD Idea H1Here is my view for USDCAD on H1. The price could go up, you can put a pending order on the Order block or find an entry on LTF within OB Zone. Trade Safe!

USDCAD possible top short for 1.30005th-9th September weekly inside bar range confined within in the range of the previous bar. supply zone for short 1.3200-20. stop loss 1.3240, target: 1.3000

USDCAD - FUNDAMENTAS WITH TECHNICAL LEVELS#USDCAD
USDCAD is going up quite a bit right now. The reason for that is that OIL is slightly DOWN and the US CPI DATA is very good. So now USD has become very STRONG. SENTIMENT related to USD became WEAK in recent days. But now with good DEMAND for US YEILD, USD is moving UP. Due to this reason, STOCKS can continue to move DOWN SIDE if the USD goes up like this.
Right now, the USDCAD market is BUYing very well towards the UP due to US DATA and UPDATES being POSITIVE. We think it will go up to the 1.3320 level before going down again with the MARKET RISK OFF SENTIMENT.
Somehow USDCAD will likely get SELL up to 1.2879 LEVEL. We wait until the DOWNSIDE TREND CONTINUES. FOLLOW THE STRUCTURE GIVEN.

USDCAD possible long for 1.3120Demand zone for long 1.2955 & 1.2906. split your risk into two positions by dividing risk equally 0.5% each. stop loss 1.2870, target: 1.3120

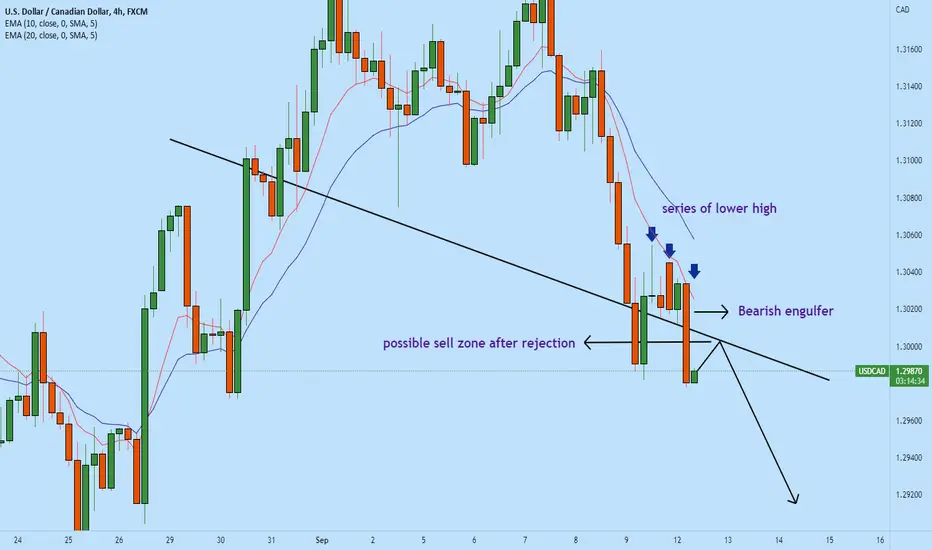
USDCAD possible sell zone!!USDCAD (4h) has formed a strong reversal pattern and the price has broken to the downside with a bearish engulfer. Currently, the price is below weekly support. in the new trading week, the price opened with a gap up with rejection to the downside. On the test of the neckline of the reversal pattern, the price may continue to drop. A sale is a high probability of set up after rejection.
Press the like button if you enjoy this content :)
DeGRAM | USDCAD gaining momentumUSDCAD is gaining momentum after sell off.
The market double-topped at the resistance level, then broke and closed below the psychological level of 1.3000.
We expect further bearish move.
-------------------
Share your opinion in the comments and support the idea with like. Thanks for your support!

USDCAD Risky Short !!USD-CAD broke out of the rising channel
So I am bearish biased on the pair
But I think that we will first see a move up
To retest the broken support line of the channel at 1.30971
And only then the price will go down
Towards the target level below

usdcad ready to reversal are you ready ?usdcad ready to reversal are you ready ? i m expecting bullish move short term

USDCAD Multi timeframe analysis,UPDATEDHello traders, this is the full breakdown of this pair. We will take this trade if all the conditions are satisfied as discussed in the analysis. Smash the like button if you find value in this analysis and drop a comment if you have any questions or let me know which pair to cover in my next analysis.
Press like button if you enjoy this content 😊

📉✌USDCAD Short position ✌📈FX:USDCAD
You can enter a short position between Now and the Yellow area.
If the price falls and reaches the risk-free level, you can risk-free the position.
TP 1&2&3 are on the chart.
The optimum stop-loss is above the determined line.
Please share ideas and leave a comment,
let me know what's your idea.
CrazyS✌

USDCAD - FUNDAMENTAS WITH TECHNICAL LEVELS#USDCAD
USDCAD is going up quite a bit right now. That's because OIL is down quite a bit and POWELL'S HAWKISH COMMENTS UPDATES came. They have been working to make USD STRONG in recent days. Due to this reason, STOCKS can move DOWN SIDE if the USD becomes STRONG like this.
Right now, there is a very good BUY towards the UPSIDE because US DATA and UPDATES are POSITIVE. We think it will go up to the 1.3320 level before going down again with the MARKET RISK OFF SENTIMENT.
Somehow USDCAD will likely SELL up to 1.2827 LEVEL. We wait until the DOWNSIDE TREND CONTINUES. FOLLOW THE STRUCTURE GIVEN.

USDCAD Multi-timeframe analysisHello traders, this is the full breakdown of this pair. We will take this trade if all the conditions are satisfied as discussed in the analysis. Smash the like button if you find value in this analysis and drop a comment if you have any questions or let me know which pair to cover in my next analysis.
Press the like button if you enjoy this content 😊

USDCAD Uptrend Long!USD-CAD is trading in a up channel
And as the pair is going down
To retest the support leve at 1.30771
I think we will see a bullish rebound
And a move up to retest the
Rising resistance of the up channel again

USDCAD - FUNDAMENTAS WITH TECHNICAL LEVELS#USDCAD
USDCAD is going up quite a bit right now. That's because OIL is down quite a bit and POWELL'S HAWKISH COMMENTS UPDATES came. They have been working to make USD STRONG in recent days. Due to this reason, STOCKS can move DOWN SIDE if the USD becomes STRONG like this.
Right now, there is a very good BUY towards the UPSIDE because US DATA and UPDATES are POSITIVE. We think it will go down to the 1.3320 level before going down again with MARKET RISK ON SENTIMENT.
Somehow USDCAD will likely SELL up to 1.2827 LEVEL. We wait until the DOWNSIDE TREND CONTINUES. FOLLOW THE STRUCTURE GIVEN. usdcad

USD/CAD WAITE TO SELL CONFARMANATION.......
AronnoFX will not accept any liability for loss or damage as a result of
reliance on the information contained within this channel including
data, quotes, charts and buy/sell signals.
If you like this idea, do not forget to support with a like and follow.
Traders, if you like this idea or have your own opinion about it,
write in the comments. I will be glad.

USDCAD Idea H1Here is my view for USDCAD on H1. The price could go up, you can put a pending order on the Order block or find an entry on LTF within OB Zone. Trade Safe!

USDCAD - FUNDAMENTAS WITH TECHNICAL LEVELS#USDCAD
USDCAD is going up quite a bit right now. That's because OIL is down quite a bit and POWELL'S HAWKISH COMMENTS UPDATES came. They have been working to make USD STRONG in recent days. Due to this reason, STOCKS can move DOWN SIDE if the USD becomes STRONG like this.
Right now, there is a very good BUY towards the UPSIDE because US DATA and UPDATES are POSITIVE. We think it will go down to 1.2999 level before going UP again with MARKET RISK ON SENTIMENT.
Somehow, there will be a chance for USDCAD to go up to 1.3221 LEVEL again. We wait until the UPSIDE TREND CONTINUES. FOLLOW THE STRUCTURE GIVEN. usdcadusdcad
